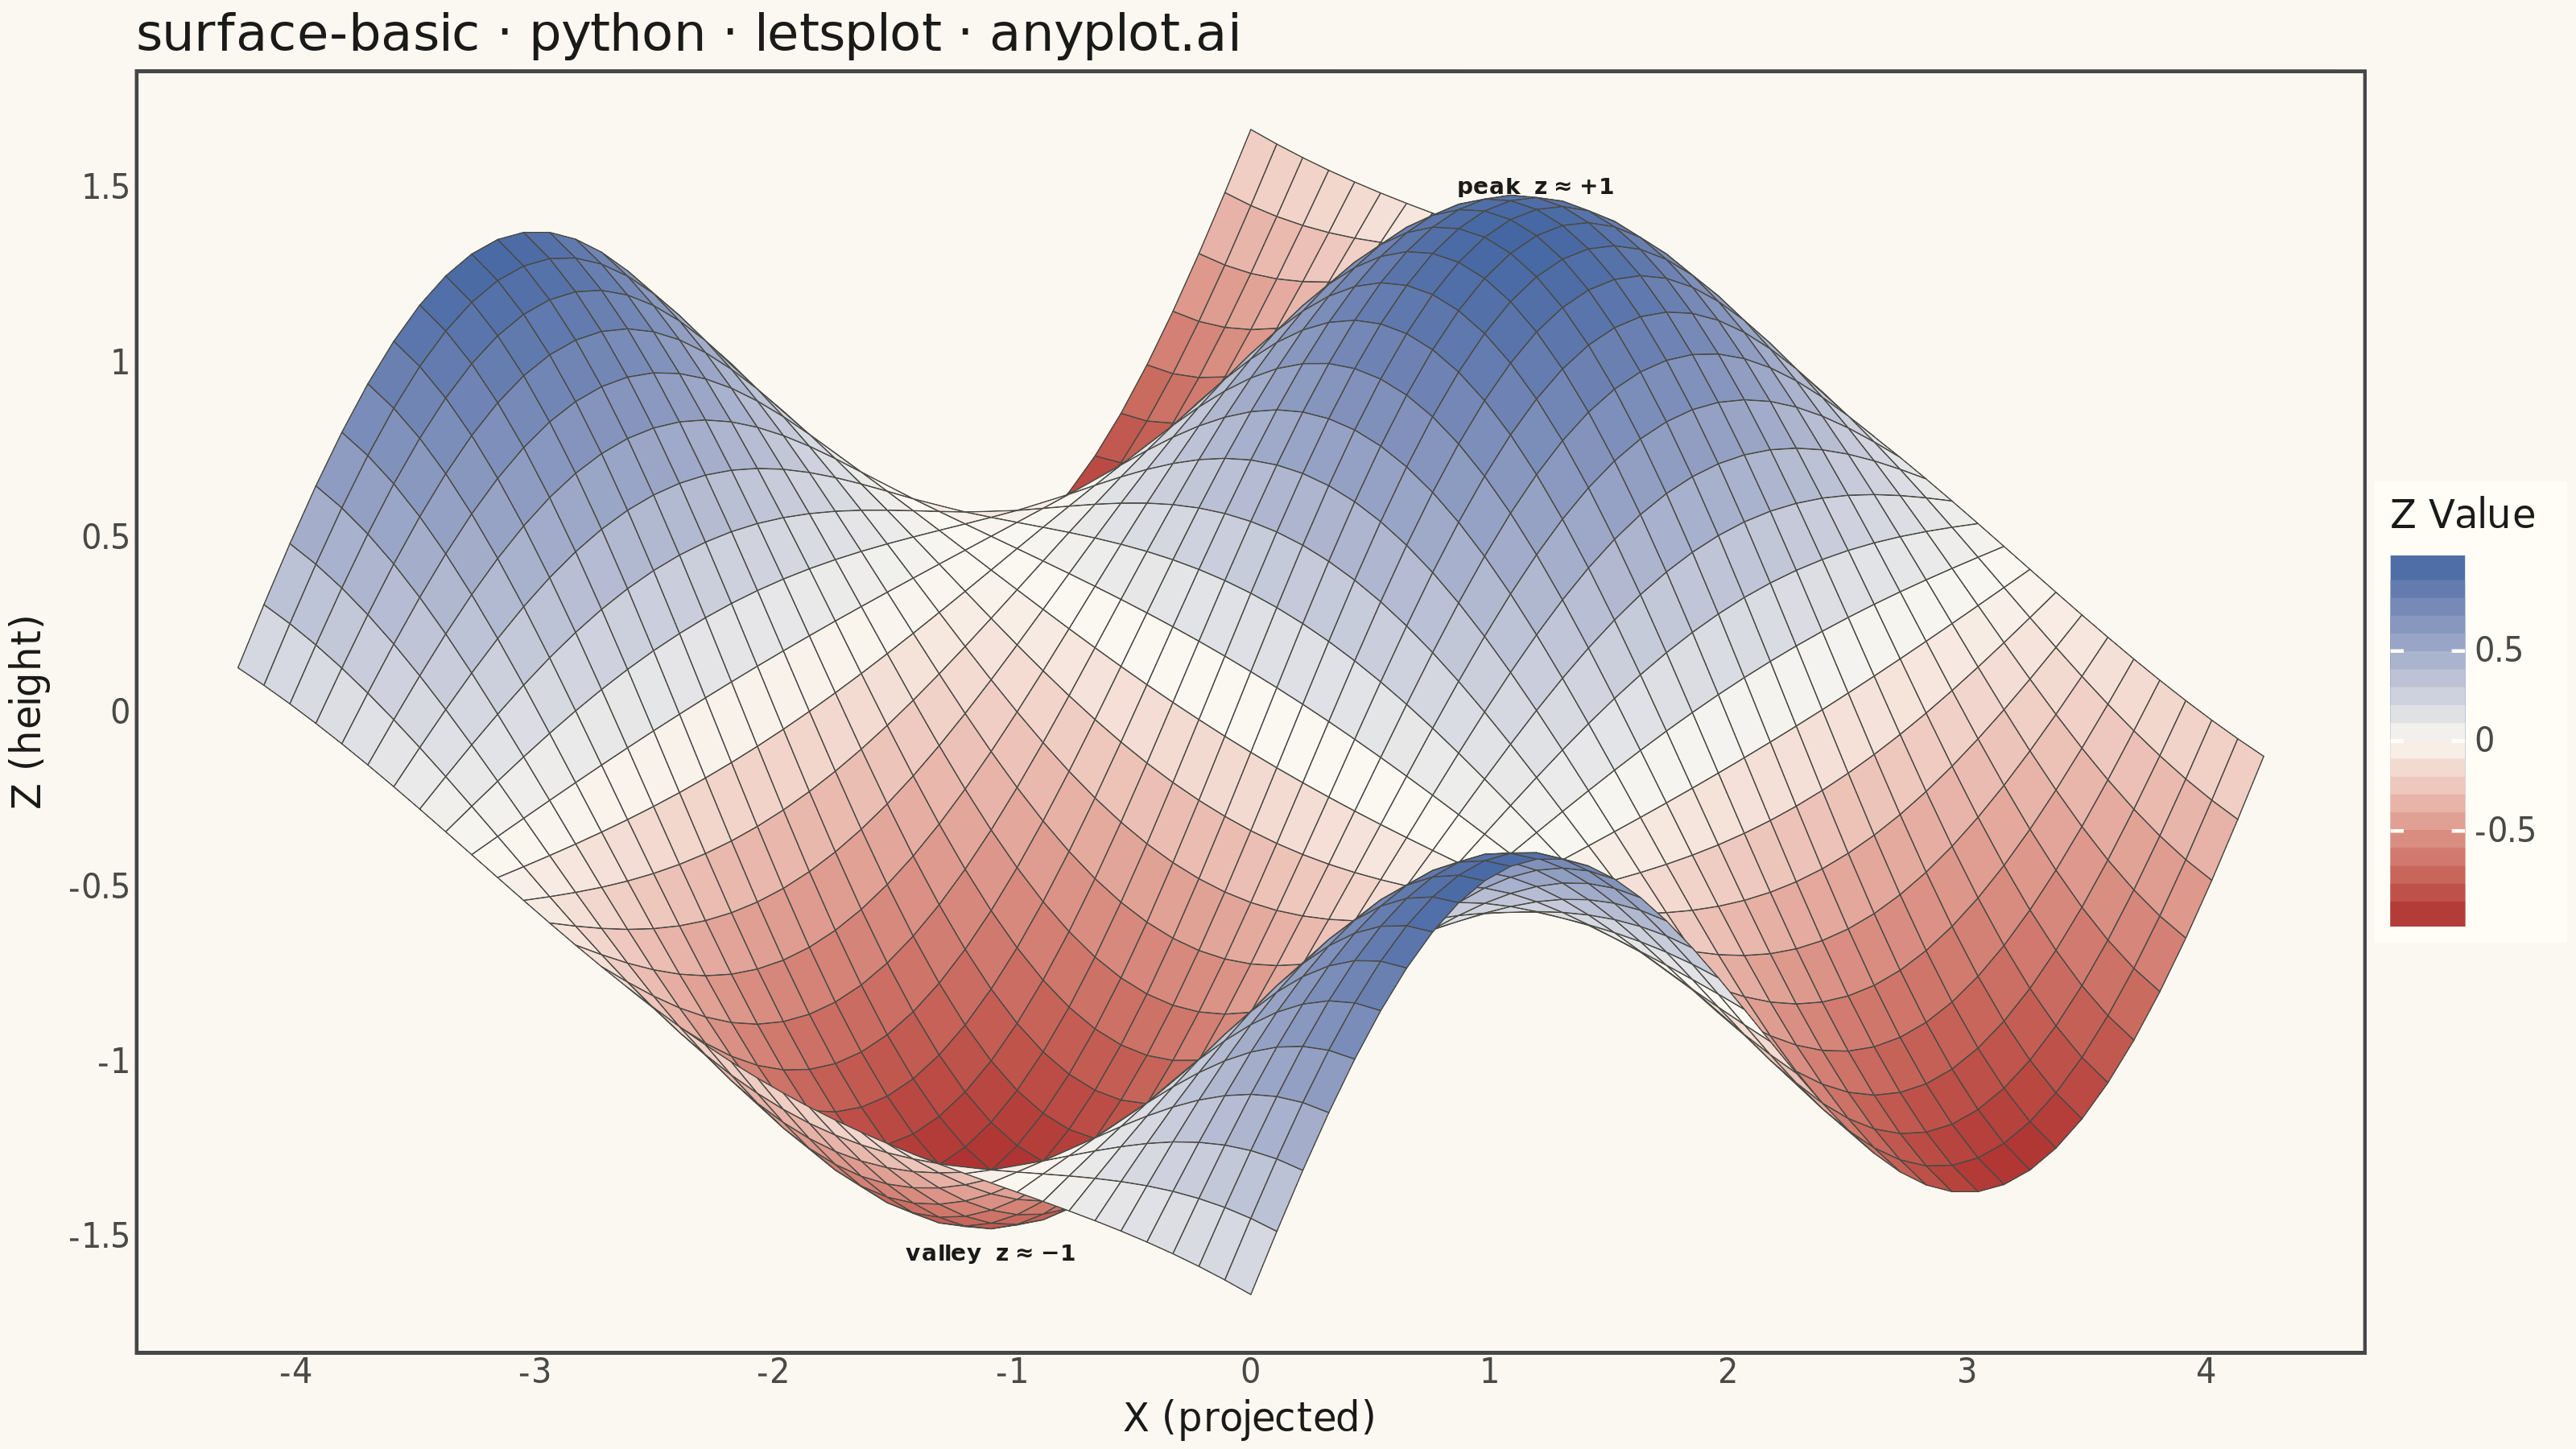
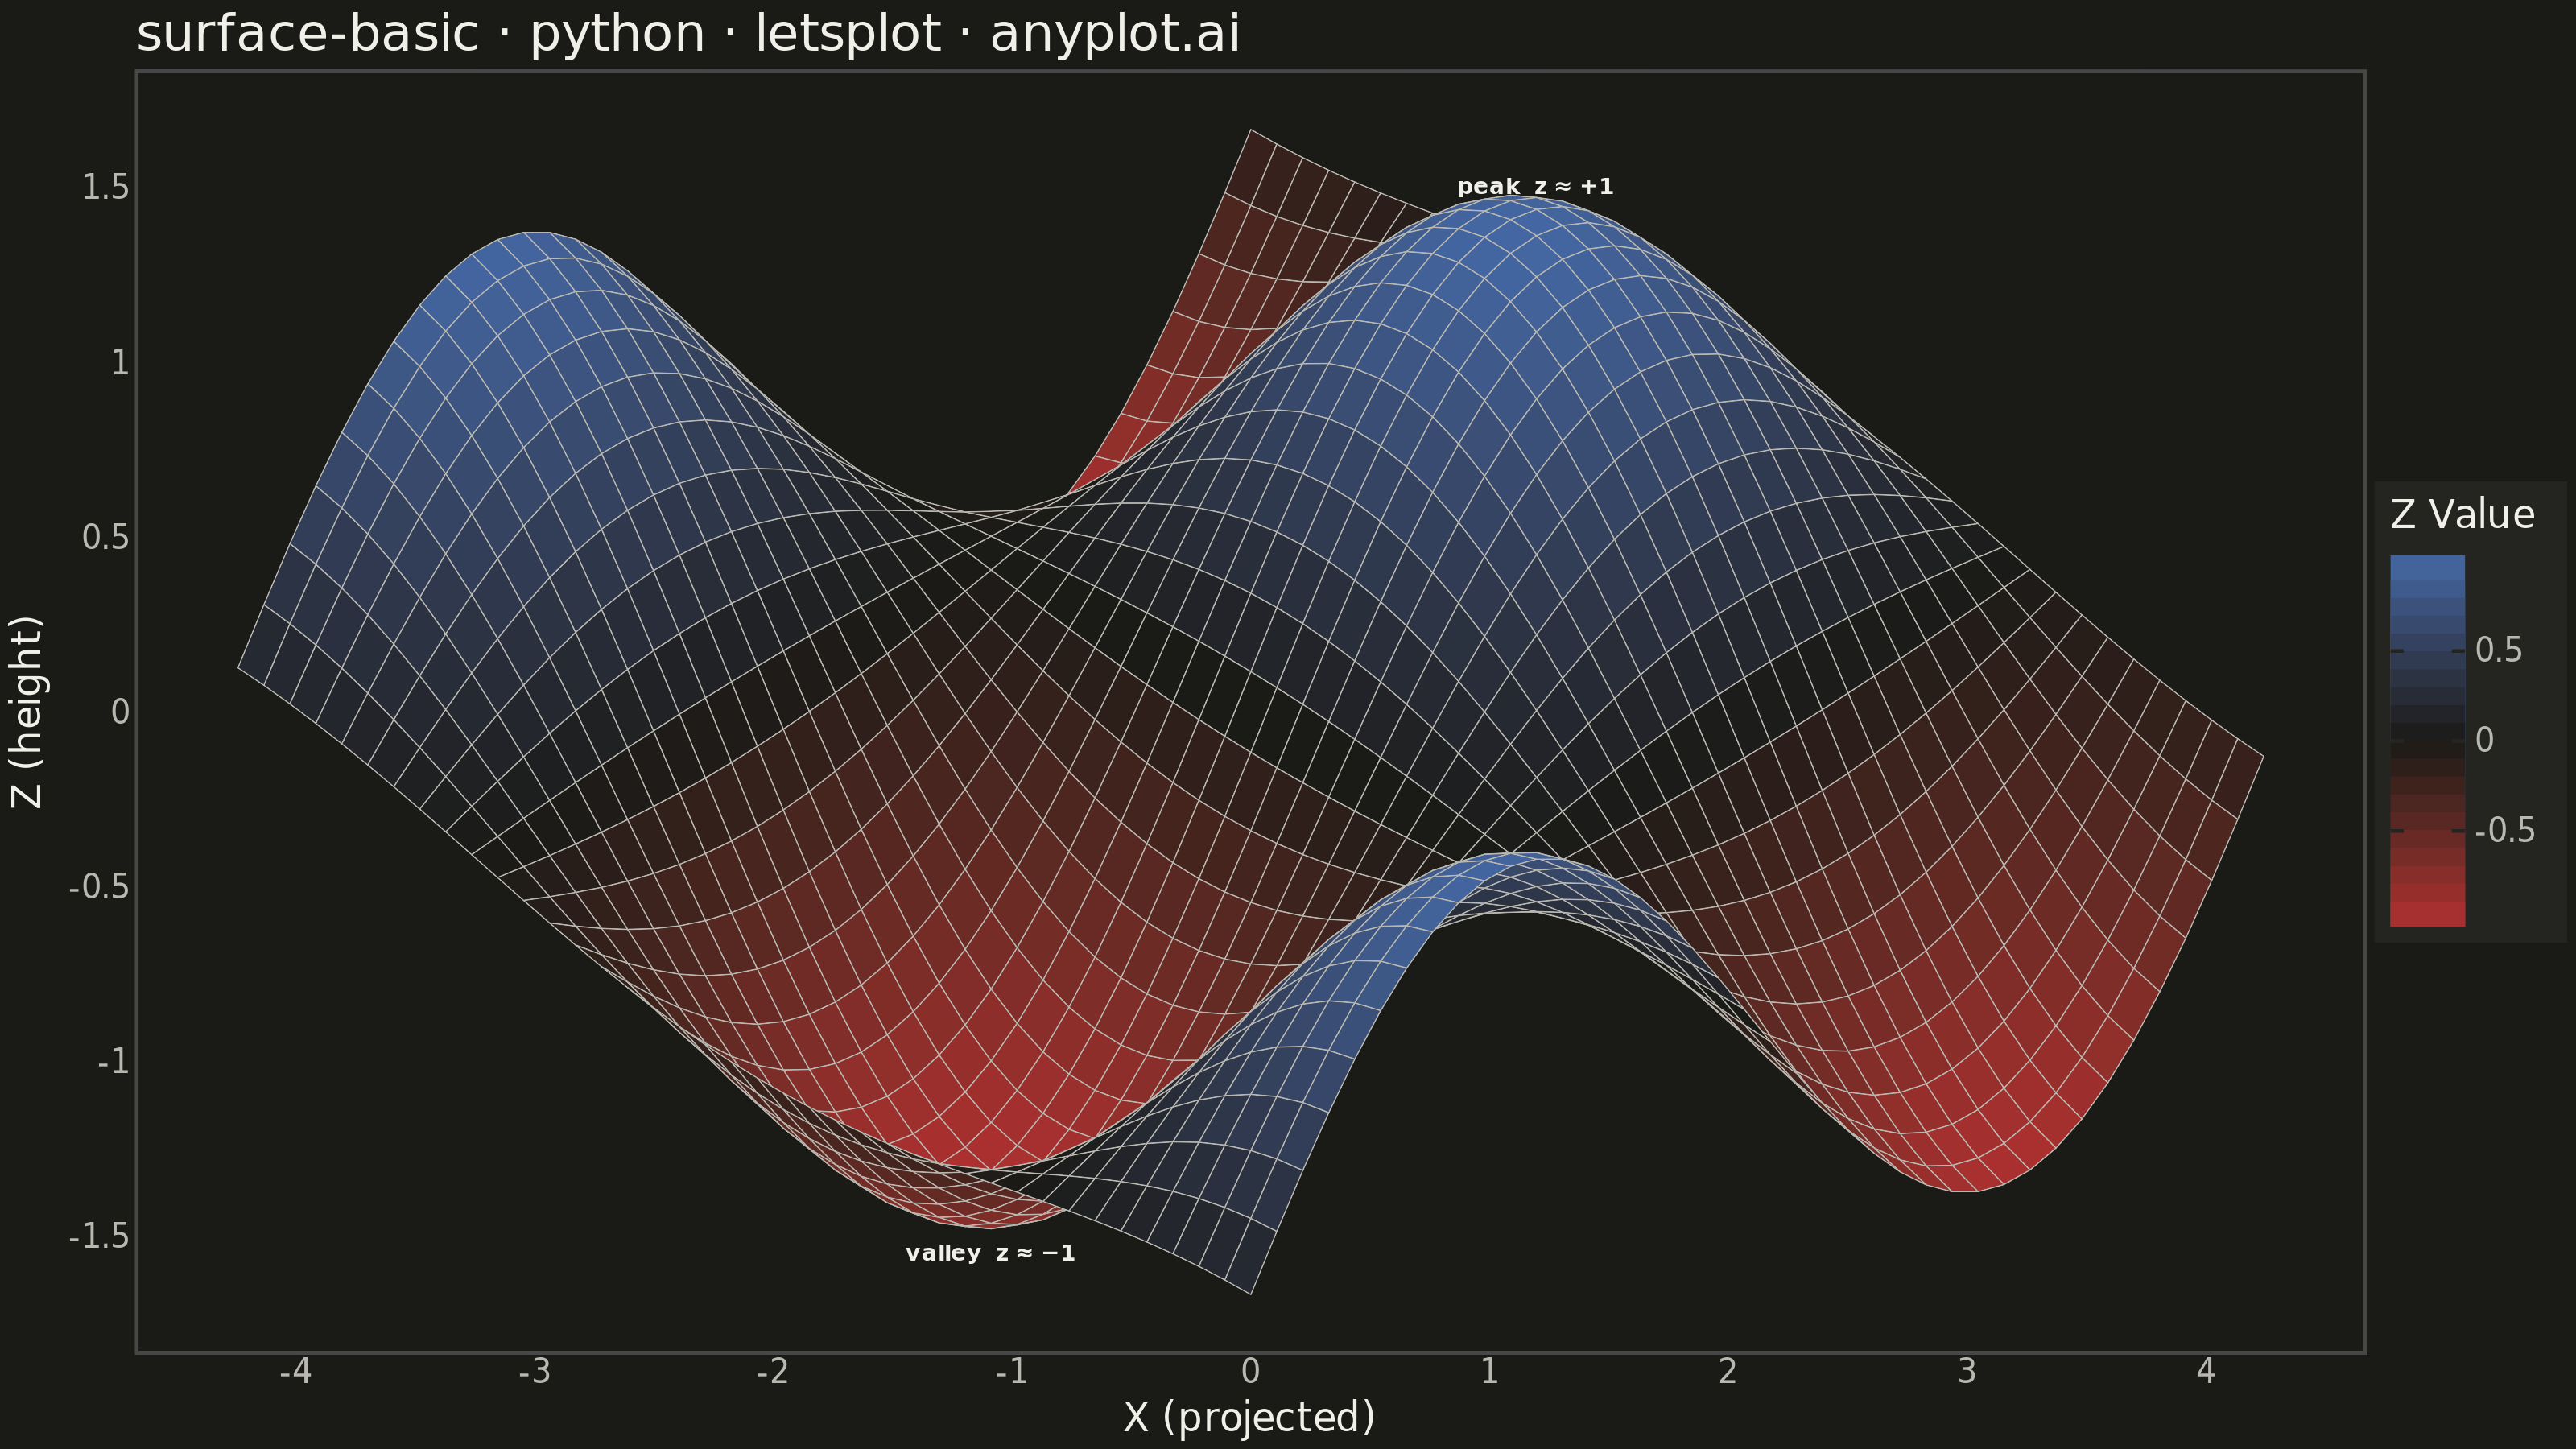
A 3D surface plot visualizes a function of two variables as a continuous surface in three-dimensional space. The height (z-axis) represents the function value at each (x, y) point, with color encoding the same information to enhance depth perception. This visualization is ideal for understanding mathematical functions, terrain data, and response surfaces where the relationship between two inputs and one output needs to be explored.
""" anyplot.ai
surface-basic: Basic 3D Surface Plot
Library: letsplot 4.10.1 | Python 3.13.13
Quality: 88/100 | Updated: 2026-06-17
"""

import os

import numpy as np
import pandas as pd
from lets_plot import (
    LetsPlot,
    aes,
    element_blank,
    element_rect,
    element_text,
    geom_polygon,
    geom_text,
    ggplot,
    ggsize,
    labs,
    layer_tooltips,
    scale_fill_gradient2,
    theme,
    theme_minimal,
)
from lets_plot.export import ggsave


LetsPlot.setup_html()

# Theme-adaptive chrome tokens
THEME = os.getenv("ANYPLOT_THEME", "light")
PAGE_BG = "#FAF8F1" if THEME == "light" else "#1A1A17"
ELEVATED_BG = "#FFFDF6" if THEME == "light" else "#242420"
INK = "#1A1A17" if THEME == "light" else "#F0EFE8"
INK_SOFT = "#4A4A44" if THEME == "light" else "#B8B7B0"

# Imprint diverging midpoint is theme-adaptive
DIV_MID = "#FAF8F1" if THEME == "light" else "#1A1A17"

# Data: z = sin(x)*cos(y) — shows peaks, valleys, and saddle points on a 40×40 grid
np.random.seed(42)
n_points = 40
x = np.linspace(-3, 3, n_points)
y = np.linspace(-3, 3, n_points)
X, Y = np.meshgrid(x, y)
Z = np.sin(X) * np.cos(Y)

# 3D → 2D projection (elevation=25°, azimuth=45°)
elev_rad = np.radians(25)
azim_rad = np.radians(45)
X_rot = X * np.cos(azim_rad) - Y * np.sin(azim_rad)
Y_rot = X * np.sin(azim_rad) + Y * np.cos(azim_rad)
X_proj = X_rot
Z_proj = Y_rot * np.sin(elev_rad) + Z * np.cos(elev_rad)

# Build quads with painter's algorithm (back-to-front depth sort)
quads = []
for i in range(n_points - 1):
    for j in range(n_points - 1):
        corners_x = [X_proj[i, j], X_proj[i, j + 1], X_proj[i + 1, j + 1], X_proj[i + 1, j]]
        corners_y = [Z_proj[i, j], Z_proj[i, j + 1], Z_proj[i + 1, j + 1], Z_proj[i + 1, j]]
        avg_z = (Z[i, j] + Z[i, j + 1] + Z[i + 1, j + 1] + Z[i + 1, j]) / 4
        depth = (Y_rot[i, j] + Y_rot[i, j + 1] + Y_rot[i + 1, j + 1] + Y_rot[i + 1, j]) / 4
        quads.append((depth, corners_x, corners_y, avg_z))

quads.sort(key=lambda q: q[0], reverse=True)

poly_data = []
for group_id, (_, corners_x, corners_y, avg_z) in enumerate(quads):
    for cx, cy in zip(corners_x, corners_y, strict=True):
        poly_data.append({"x": cx, "y": cy, "z": avg_z, "group": group_id})

df = pd.DataFrame(poly_data)

# Annotate peak (x≈π/2, y≈0, z≈+1) and valley (x≈−π/2, y≈0, z≈−1)
j_peak = np.argmin(np.abs(x - np.pi / 2))
i_peak = np.argmin(np.abs(y - 0.0))
j_valley = np.argmin(np.abs(x + np.pi / 2))
i_valley = i_peak

ann_df = pd.DataFrame(
    {
        "x": [X_proj[i_peak, j_peak], X_proj[i_valley, j_valley]],
        "y": [Z_proj[i_peak, j_peak] + 0.14, Z_proj[i_valley, j_valley] - 0.14],
        "z": [1.0, -1.0],
        "group": [-1, -2],
        "label": ["peak  z ≈ +1", "valley  z ≈ −1"],
    }
)

# Imprint diverging colormap: matte-red (negative) → neutral midpoint → blue (positive)
plot = (
    ggplot(df, aes(x="x", y="y", group="group", fill="z"))
    + geom_polygon(color=INK_SOFT, size=0.15, alpha=1.0, tooltips=layer_tooltips().line("Z value: @z{.3f}"))
    + geom_text(aes(label="label"), data=ann_df, color=INK, size=3.5, fontface="bold")
    + scale_fill_gradient2(low="#AE3030", mid=DIV_MID, high="#4467A3", midpoint=0, name="Z Value")
    + labs(x="X (projected)", y="Z (height)", title="surface-basic · python · letsplot · anyplot.ai")
    + theme_minimal()
    + theme(
        plot_background=element_rect(fill=PAGE_BG, color=PAGE_BG),
        panel_background=element_rect(fill=PAGE_BG),
        axis_title=element_text(size=12, color=INK),
        axis_text=element_text(size=10, color=INK_SOFT),
        plot_title=element_text(size=16, color=INK),
        legend_background=element_rect(fill=ELEVATED_BG, color=INK_SOFT),
        legend_text=element_text(size=10, color=INK_SOFT),
        legend_title=element_text(size=12, color=INK),
        panel_grid=element_blank(),
        axis_line=element_blank(),
    )
    + ggsize(800, 450)
)

# scale=4 → 3200×1800 px (landscape, per canvas contract)
ggsave(plot, f"plot-{THEME}.png", path=".", scale=4)
ggsave(plot, f"plot-{THEME}.html", path=".")
Runnable source as JSON, for any HTTP client: https://api.anyplot.ai/specs/surface-basic/letsplot/code. Any spec id and library id listed in llms-full.txt fit the same URL shape; every URL below is complete and callable.
{
  "spec_id": "surface-basic",
  "language": "python",
  "library": "letsplot",
  "page": "https://anyplot.ai/surface-basic/python/letsplot",
  "hub": "https://anyplot.ai/surface-basic",
  "code_json": "https://api.anyplot.ai/specs/surface-basic/letsplot/code",
  "spec_json": "https://api.anyplot.ai/specs/surface-basic",
  "render_light_png": "https://storage.googleapis.com/anyplot-images/plots/surface-basic/python/letsplot/plot-light.png",
  "render_dark_png": "https://storage.googleapis.com/anyplot-images/plots/surface-basic/python/letsplot/plot-dark.png",
  "interactive_light_html": "https://storage.googleapis.com/anyplot-images/plots/surface-basic/python/letsplot/plot-light.html",
  "interactive_dark_html": "https://storage.googleapis.com/anyplot-images/plots/surface-basic/python/letsplot/plot-dark.html",
  "quality_score": 88.0,
  "license": "MIT",
  "guide": "https://anyplot.ai/llms.txt"
}
Part of Basic 3D Surface Plot on anyplot.ai.