The same plot in 12 other libraries — Python: Altair, Bokeh, lets-plot, Matplotlib, Plotly, Pygal, Seaborn; R: ggplot2; JavaScript: D3.js, Apache ECharts, Highcharts, MUI X Charts. Compare all 13 side by side: Basic 3D Surface Plot in Python, R, Julia and JavaScript.
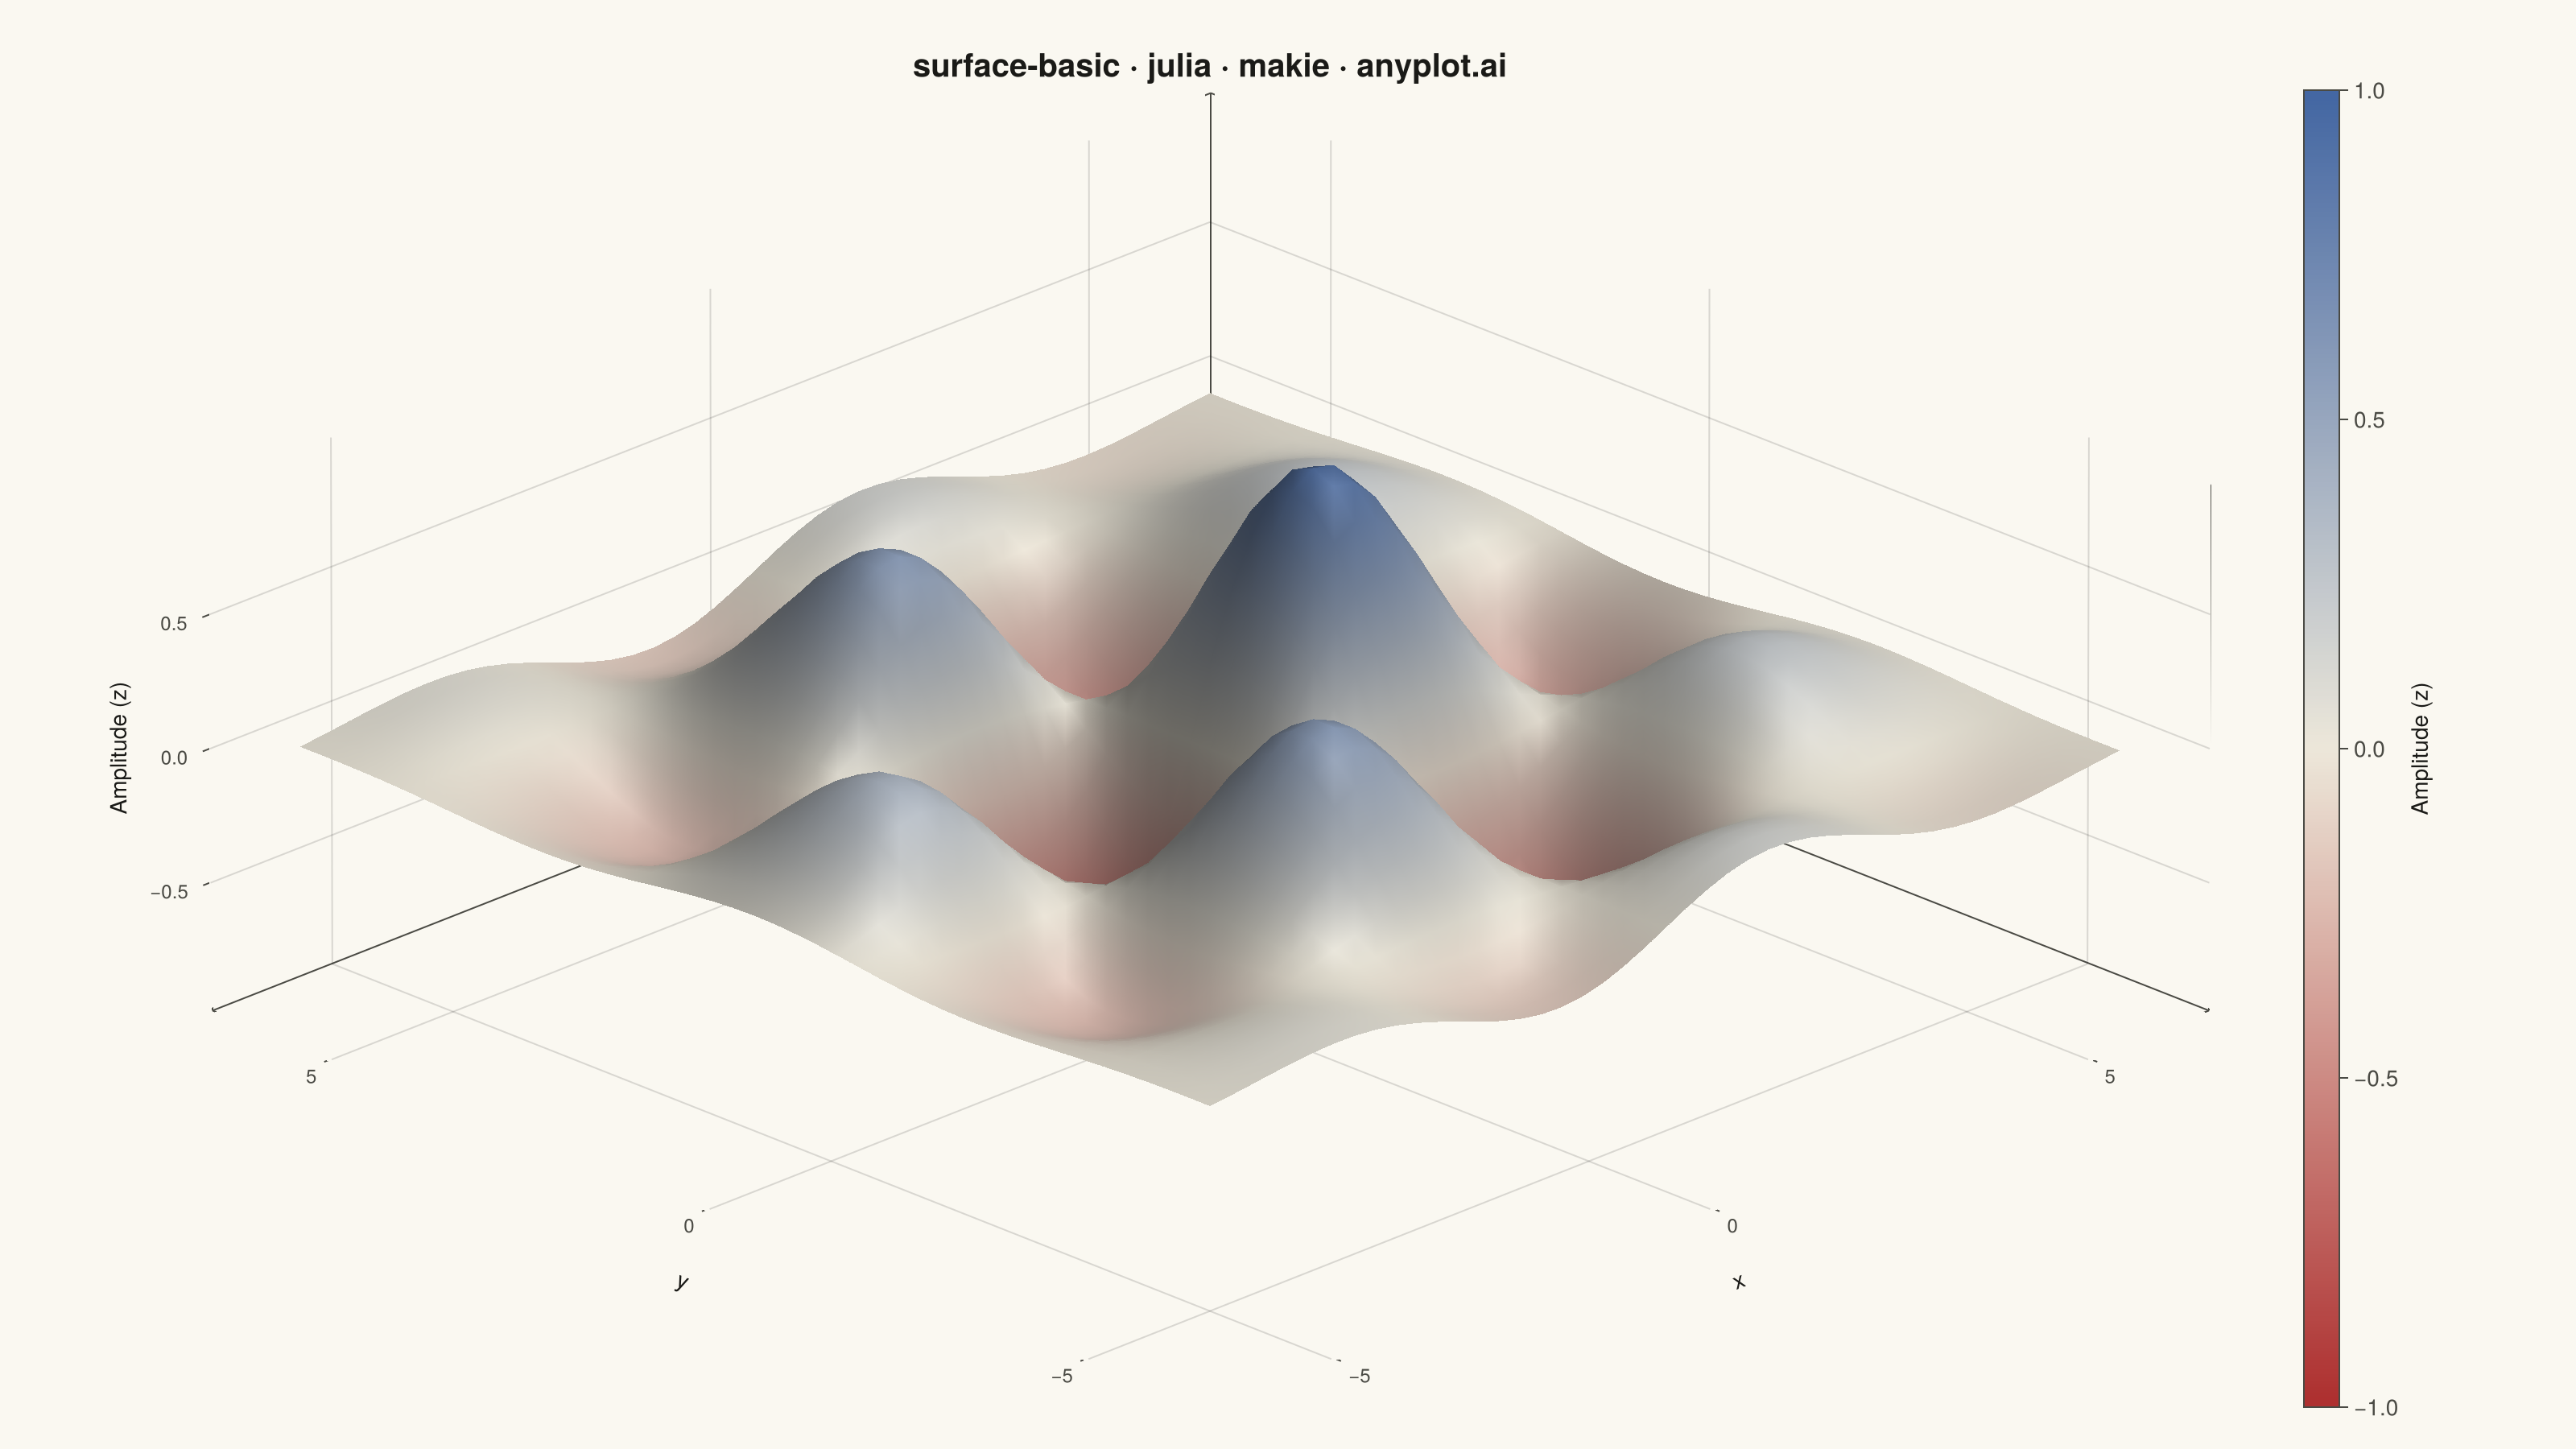
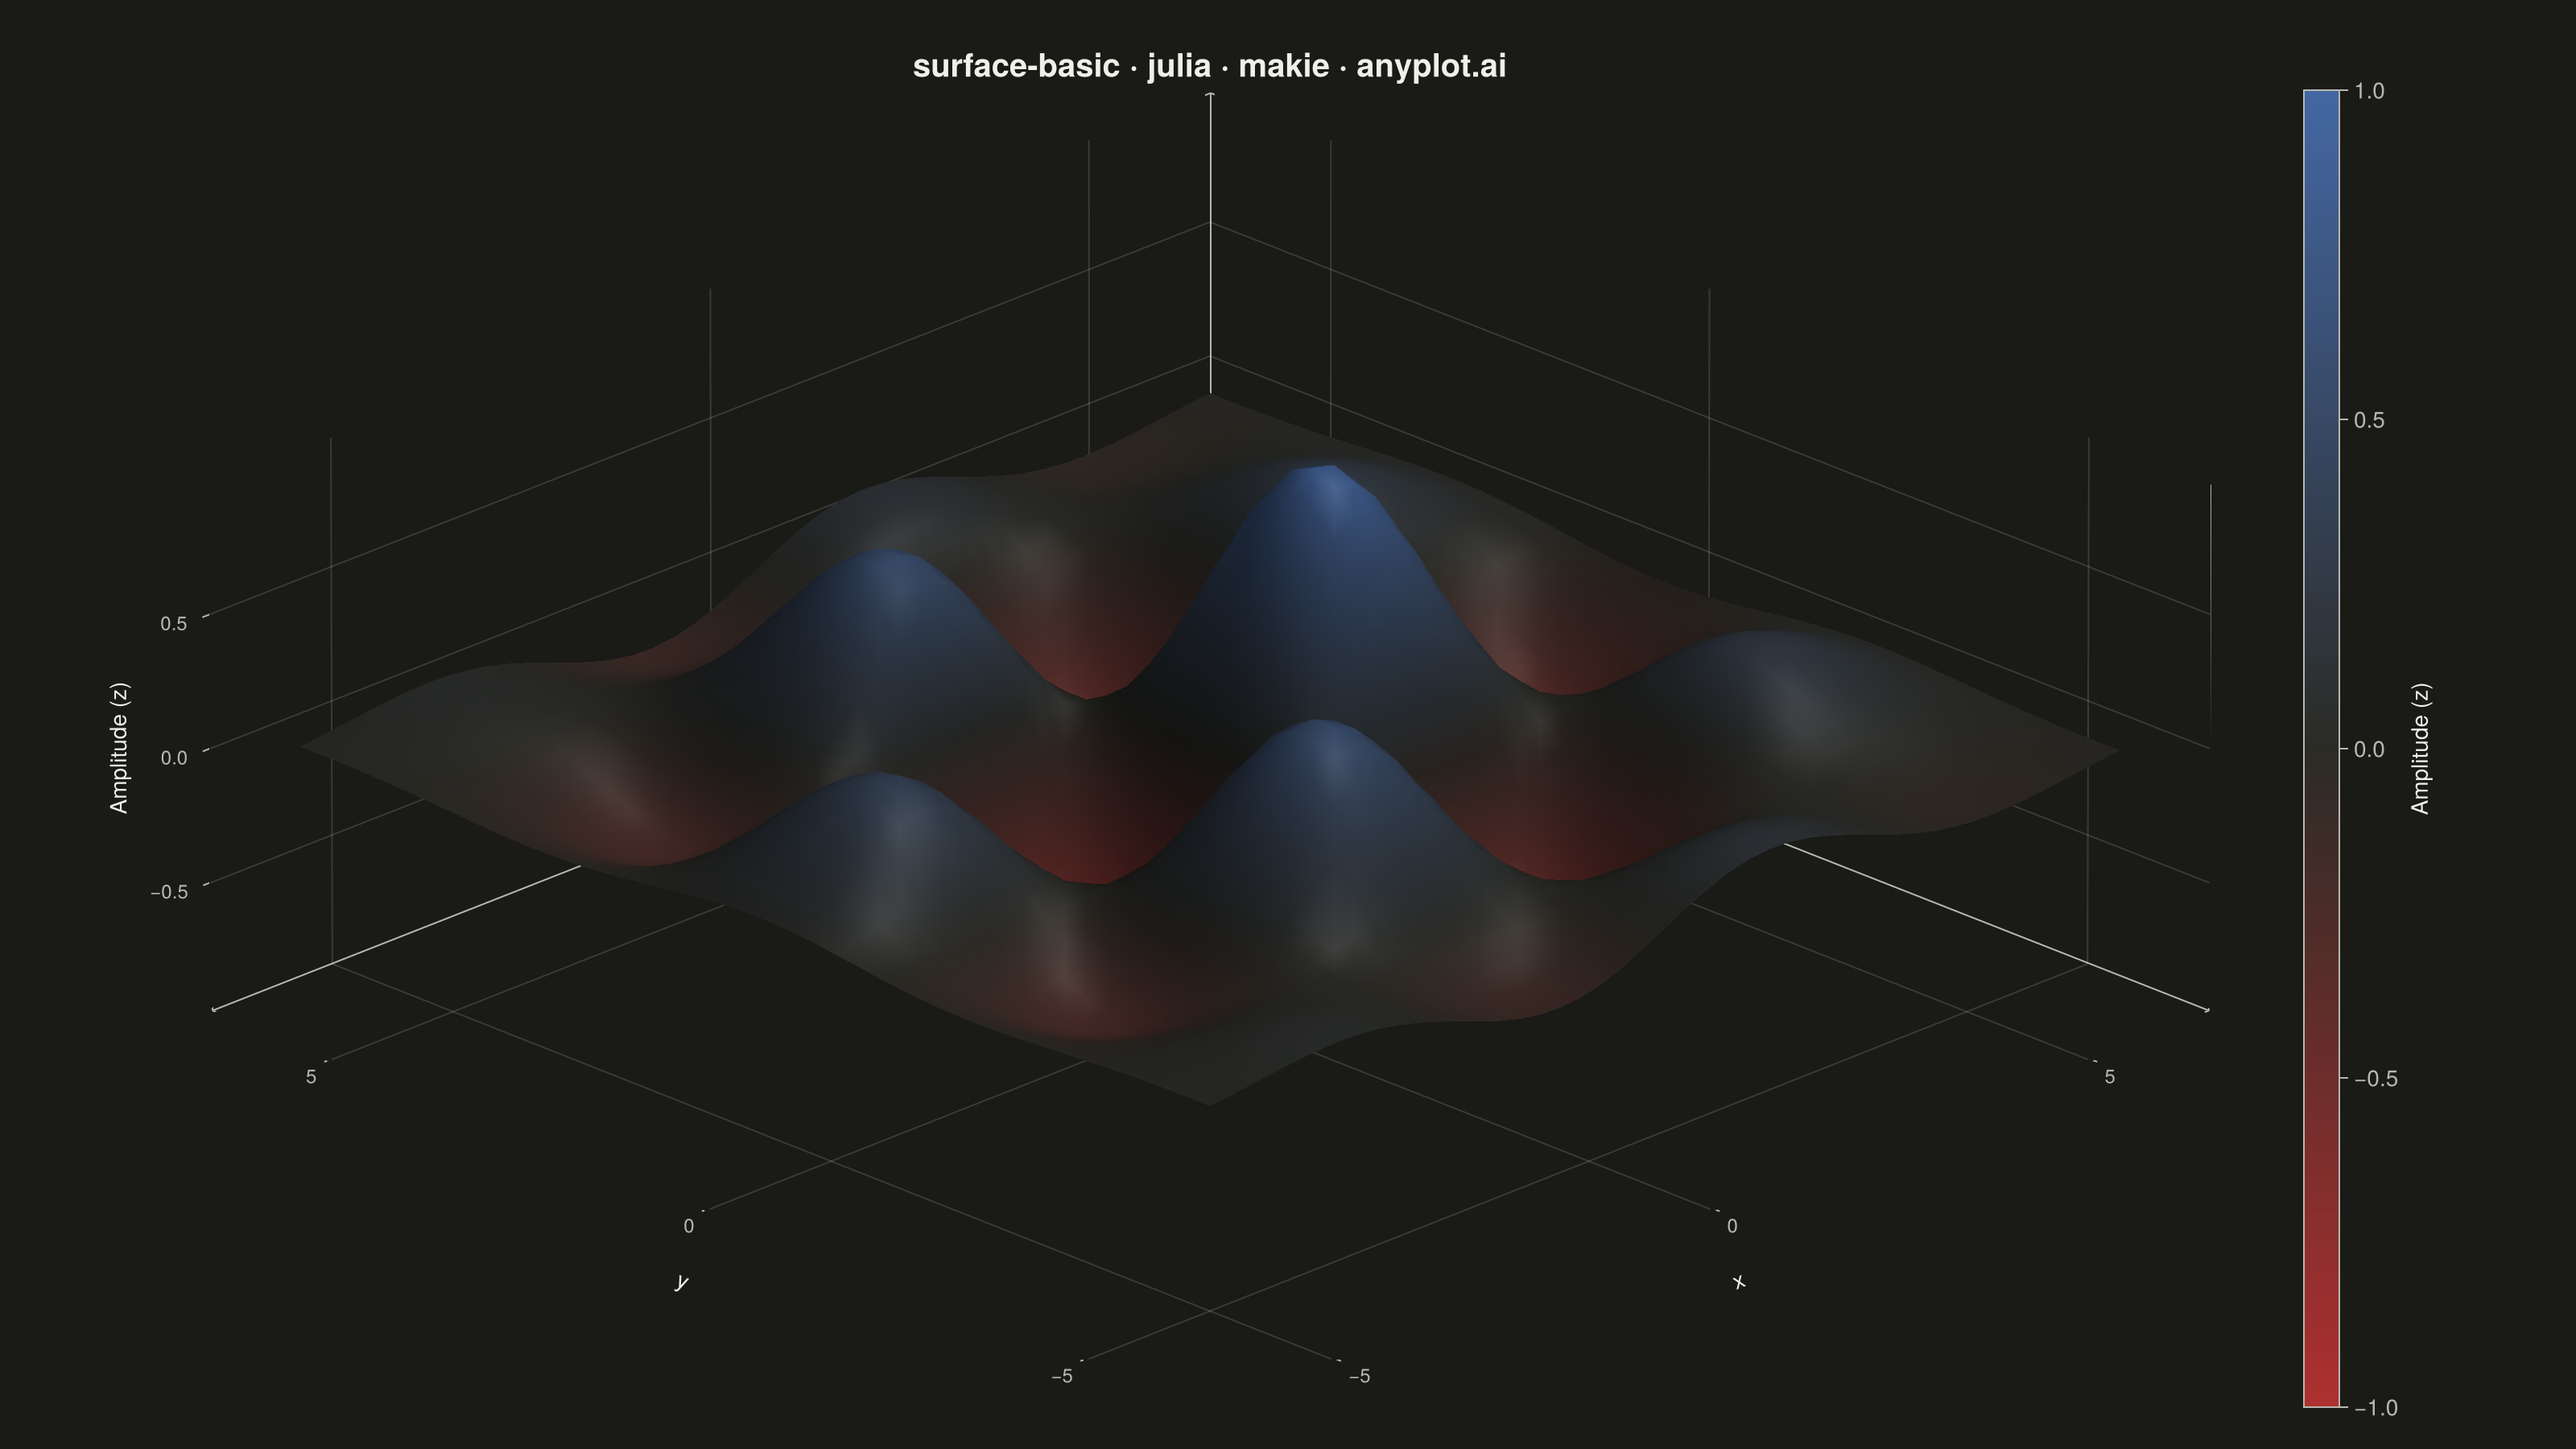
A 3D surface plot visualizes a function of two variables as a continuous surface in three-dimensional space. The height (z-axis) represents the function value at each (x, y) point, with color encoding the same information to enhance depth perception. This visualization is ideal for understanding mathematical functions, terrain data, and response surfaces where the relationship between two inputs and one output needs to be explored.
# anyplot.ai
# surface-basic: Basic 3D Surface Plot
# Library: makie 0.21.9 | Julia 1.11.9
# Quality: 86/100 | Created: 2026-09-10

using CairoMakie
using Colors

# --- Theme tokens -----------------------------------------------------------
const THEME    = get(ENV, "ANYPLOT_THEME", "light")
const PAGE_BG  = THEME == "light" ? colorant"#FAF8F1" : colorant"#1A1A17"
const INK      = THEME == "light" ? colorant"#1A1A17" : colorant"#F0EFE8"
const INK_SOFT = THEME == "light" ? colorant"#4A4A44" : colorant"#B8B7B0"
# Nudged slightly off the exact page-background color (rather than the plain
# #FAF8F1/#1A1A17 tokens) so near-zero surface regions stay visually distinct
# from the Axis3 panel walls, which are also filled with PAGE_BG.
const MIDPOINT = THEME == "light" ? colorant"#EDE8DA" : colorant"#2B2B26"

# Imprint diverging colormap — the wave field oscillates above and below the
# z=0 plane, a signed deviation rather than a single-polarity magnitude
# (default-style-guide.md "Continuous Data").
const IMPRINT_DIV = cgrad([colorant"#AE3030", MIDPOINT, colorant"#4467A3"])

# --- Data ---------------------------------------------------------------
# Damped standing-wave field z = sin(x)*cos(y)*exp(-r^2 * decay), a classic
# two-variable function surface (default-style-guide "Applications").
# Deterministic, no RNG needed.
x = range(-6, 6, length=45)
y = range(-6, 6, length=45)
z = [sin(xi) * cos(yi) * exp(-0.05 * (xi^2 + yi^2)) for xi in x, yi in y]

# --- Plot -----------------------------------------------------------------
title_str = "surface-basic · julia · makie · anyplot.ai"

fig = Figure(
    resolution      = (1600, 900),
    fontsize        = 14,
    backgroundcolor = PAGE_BG,
)

ax = Axis3(
    fig[1, 1];
    title              = title_str,
    titlesize          = 20,
    titlecolor         = INK,
    xlabel             = "x",
    ylabel             = "y",
    zlabel             = "Amplitude (z)",
    xlabelsize         = 14,
    ylabelsize         = 14,
    zlabelsize         = 14,
    xlabelcolor        = INK,
    ylabelcolor        = INK,
    zlabelcolor        = INK,
    xticklabelsize     = 12,
    yticklabelsize     = 12,
    zticklabelsize     = 12,
    xticklabelcolor    = INK_SOFT,
    yticklabelcolor    = INK_SOFT,
    zticklabelcolor    = INK_SOFT,
    xtickcolor         = INK_SOFT,
    ytickcolor         = INK_SOFT,
    ztickcolor         = INK_SOFT,
    xspinecolor_1      = INK_SOFT,
    yspinecolor_1      = INK_SOFT,
    zspinecolor_1      = INK_SOFT,
    xspinecolor_2      = INK_SOFT,
    yspinecolor_2      = INK_SOFT,
    zspinecolor_2      = INK_SOFT,
    xspinecolor_3      = INK_SOFT,
    yspinecolor_3      = INK_SOFT,
    zspinecolor_3      = INK_SOFT,
    xgridcolor         = RGBAf(INK.r, INK.g, INK.b, 0.15),
    ygridcolor         = RGBAf(INK.r, INK.g, INK.b, 0.15),
    zgridcolor         = RGBAf(INK.r, INK.g, INK.b, 0.15),
    xypanelcolor       = PAGE_BG,
    xzpanelcolor       = PAGE_BG,
    yzpanelcolor       = PAGE_BG,
    backgroundcolor    = PAGE_BG,
    aspect             = (1, 1, 0.6),
    azimuth            = 1.25 * pi,
    elevation          = 0.18 * pi,
    protrusions        = (40, 40, 10, 40),
    viewmode           = :stretch,
)

surf = surface!(ax, x, y, z; colormap = IMPRINT_DIV, colorrange = (-1, 1))

Colorbar(
    fig[1, 2], surf;
    label = "Amplitude (z)", width = 22,
    labelcolor = INK, ticklabelcolor = INK_SOFT, tickcolor = INK_SOFT,
    leftspinecolor = INK_SOFT, rightspinecolor = INK_SOFT,
    topspinecolor = INK_SOFT, bottomspinecolor = INK_SOFT,
)

colsize!(fig.layout, 1, Relative(0.88))

# --- Save -------------------------------------------------------------------
save("plot-$(THEME).png", fig; px_per_unit = 2)
Runnable source as JSON, for any HTTP client: https://api.anyplot.ai/specs/surface-basic/makie/code. Any spec id and library id listed in llms-full.txt fit the same URL shape; every URL below is complete and callable.
{
  "spec_id": "surface-basic",
  "language": "julia",
  "library": "makie",
  "page": "https://anyplot.ai/surface-basic/julia/makie",
  "hub": "https://anyplot.ai/surface-basic",
  "code_json": "https://api.anyplot.ai/specs/surface-basic/makie/code",
  "spec_json": "https://api.anyplot.ai/specs/surface-basic",
  "render_light_png": "https://storage.googleapis.com/anyplot-images/plots/surface-basic/julia/makie/plot-light.png",
  "render_dark_png": "https://storage.googleapis.com/anyplot-images/plots/surface-basic/julia/makie/plot-dark.png",
  "quality_score": 86.0,
  "license": "MIT",
  "guide": "https://anyplot.ai/llms.txt"
}
Part of Basic 3D Surface Plot on anyplot.ai.