The same plot in 12 other libraries — JavaScript: D3.js, Apache ECharts, MUI X Charts; Python: Altair, Bokeh, lets-plot, Matplotlib, Plotly, Pygal, Seaborn; R: ggplot2; Julia: Makie.jl. Compare all 13 side by side: Basic 3D Surface Plot in Python, R, Julia and JavaScript.
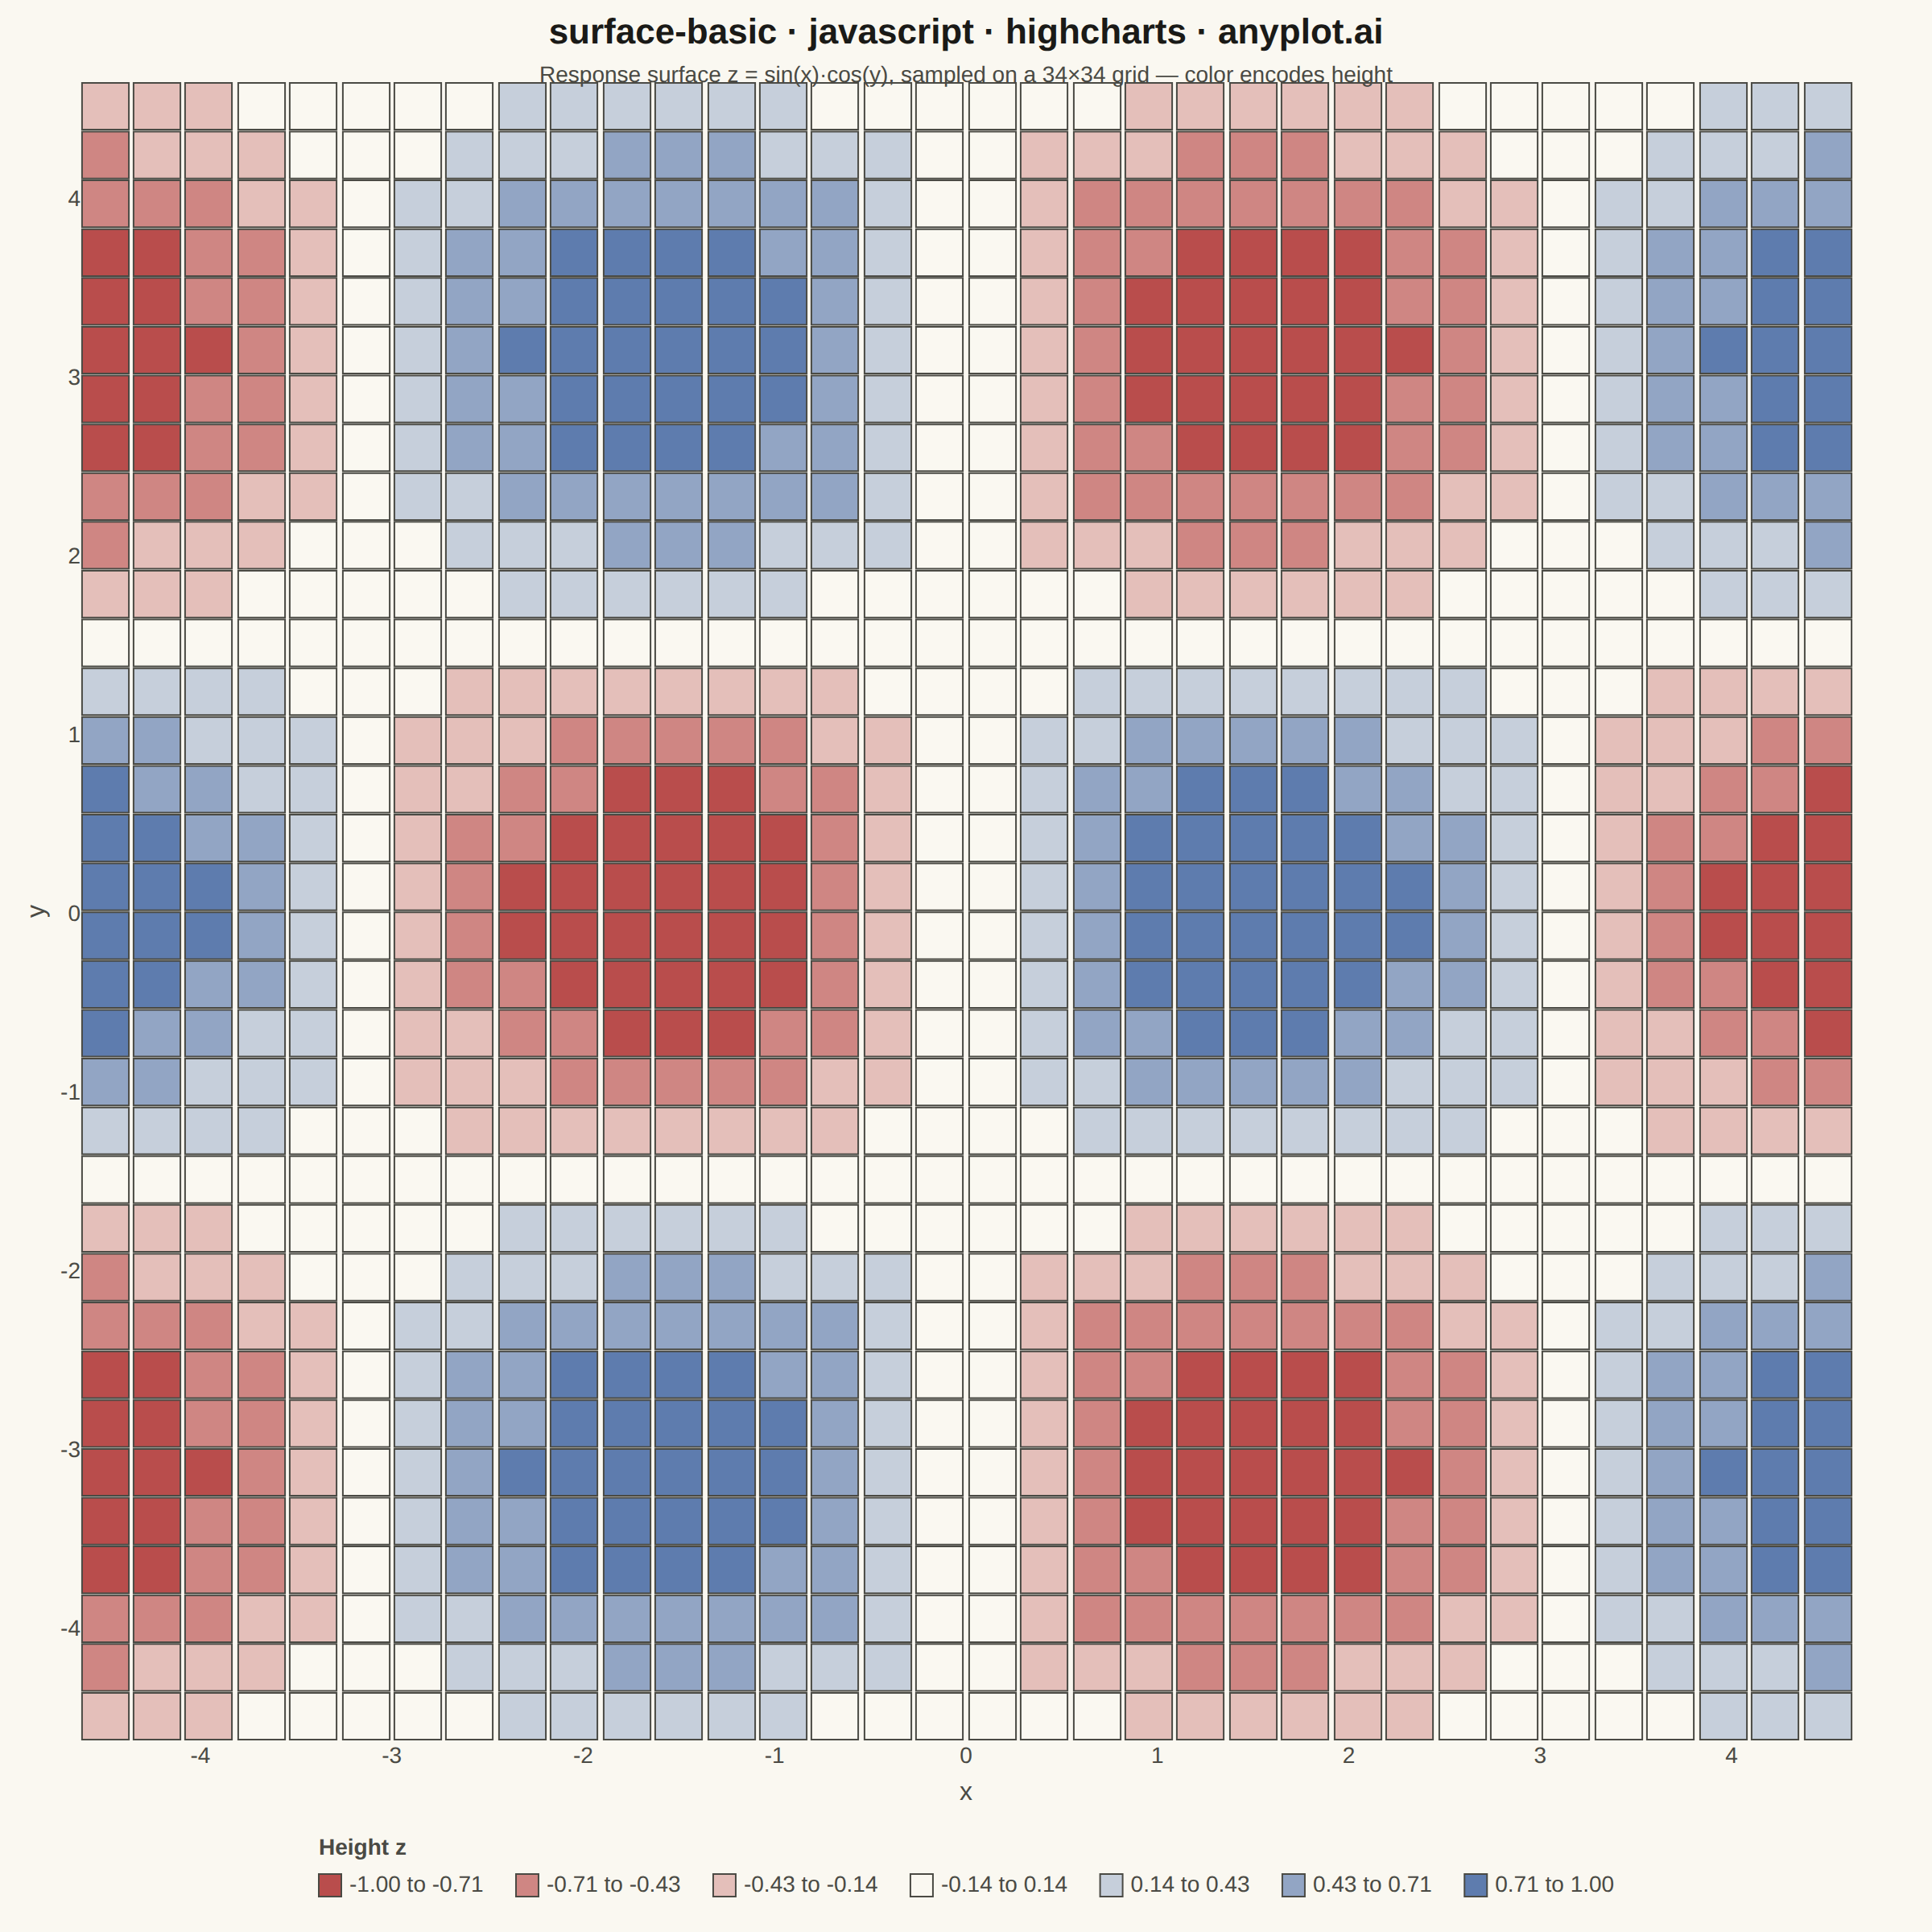
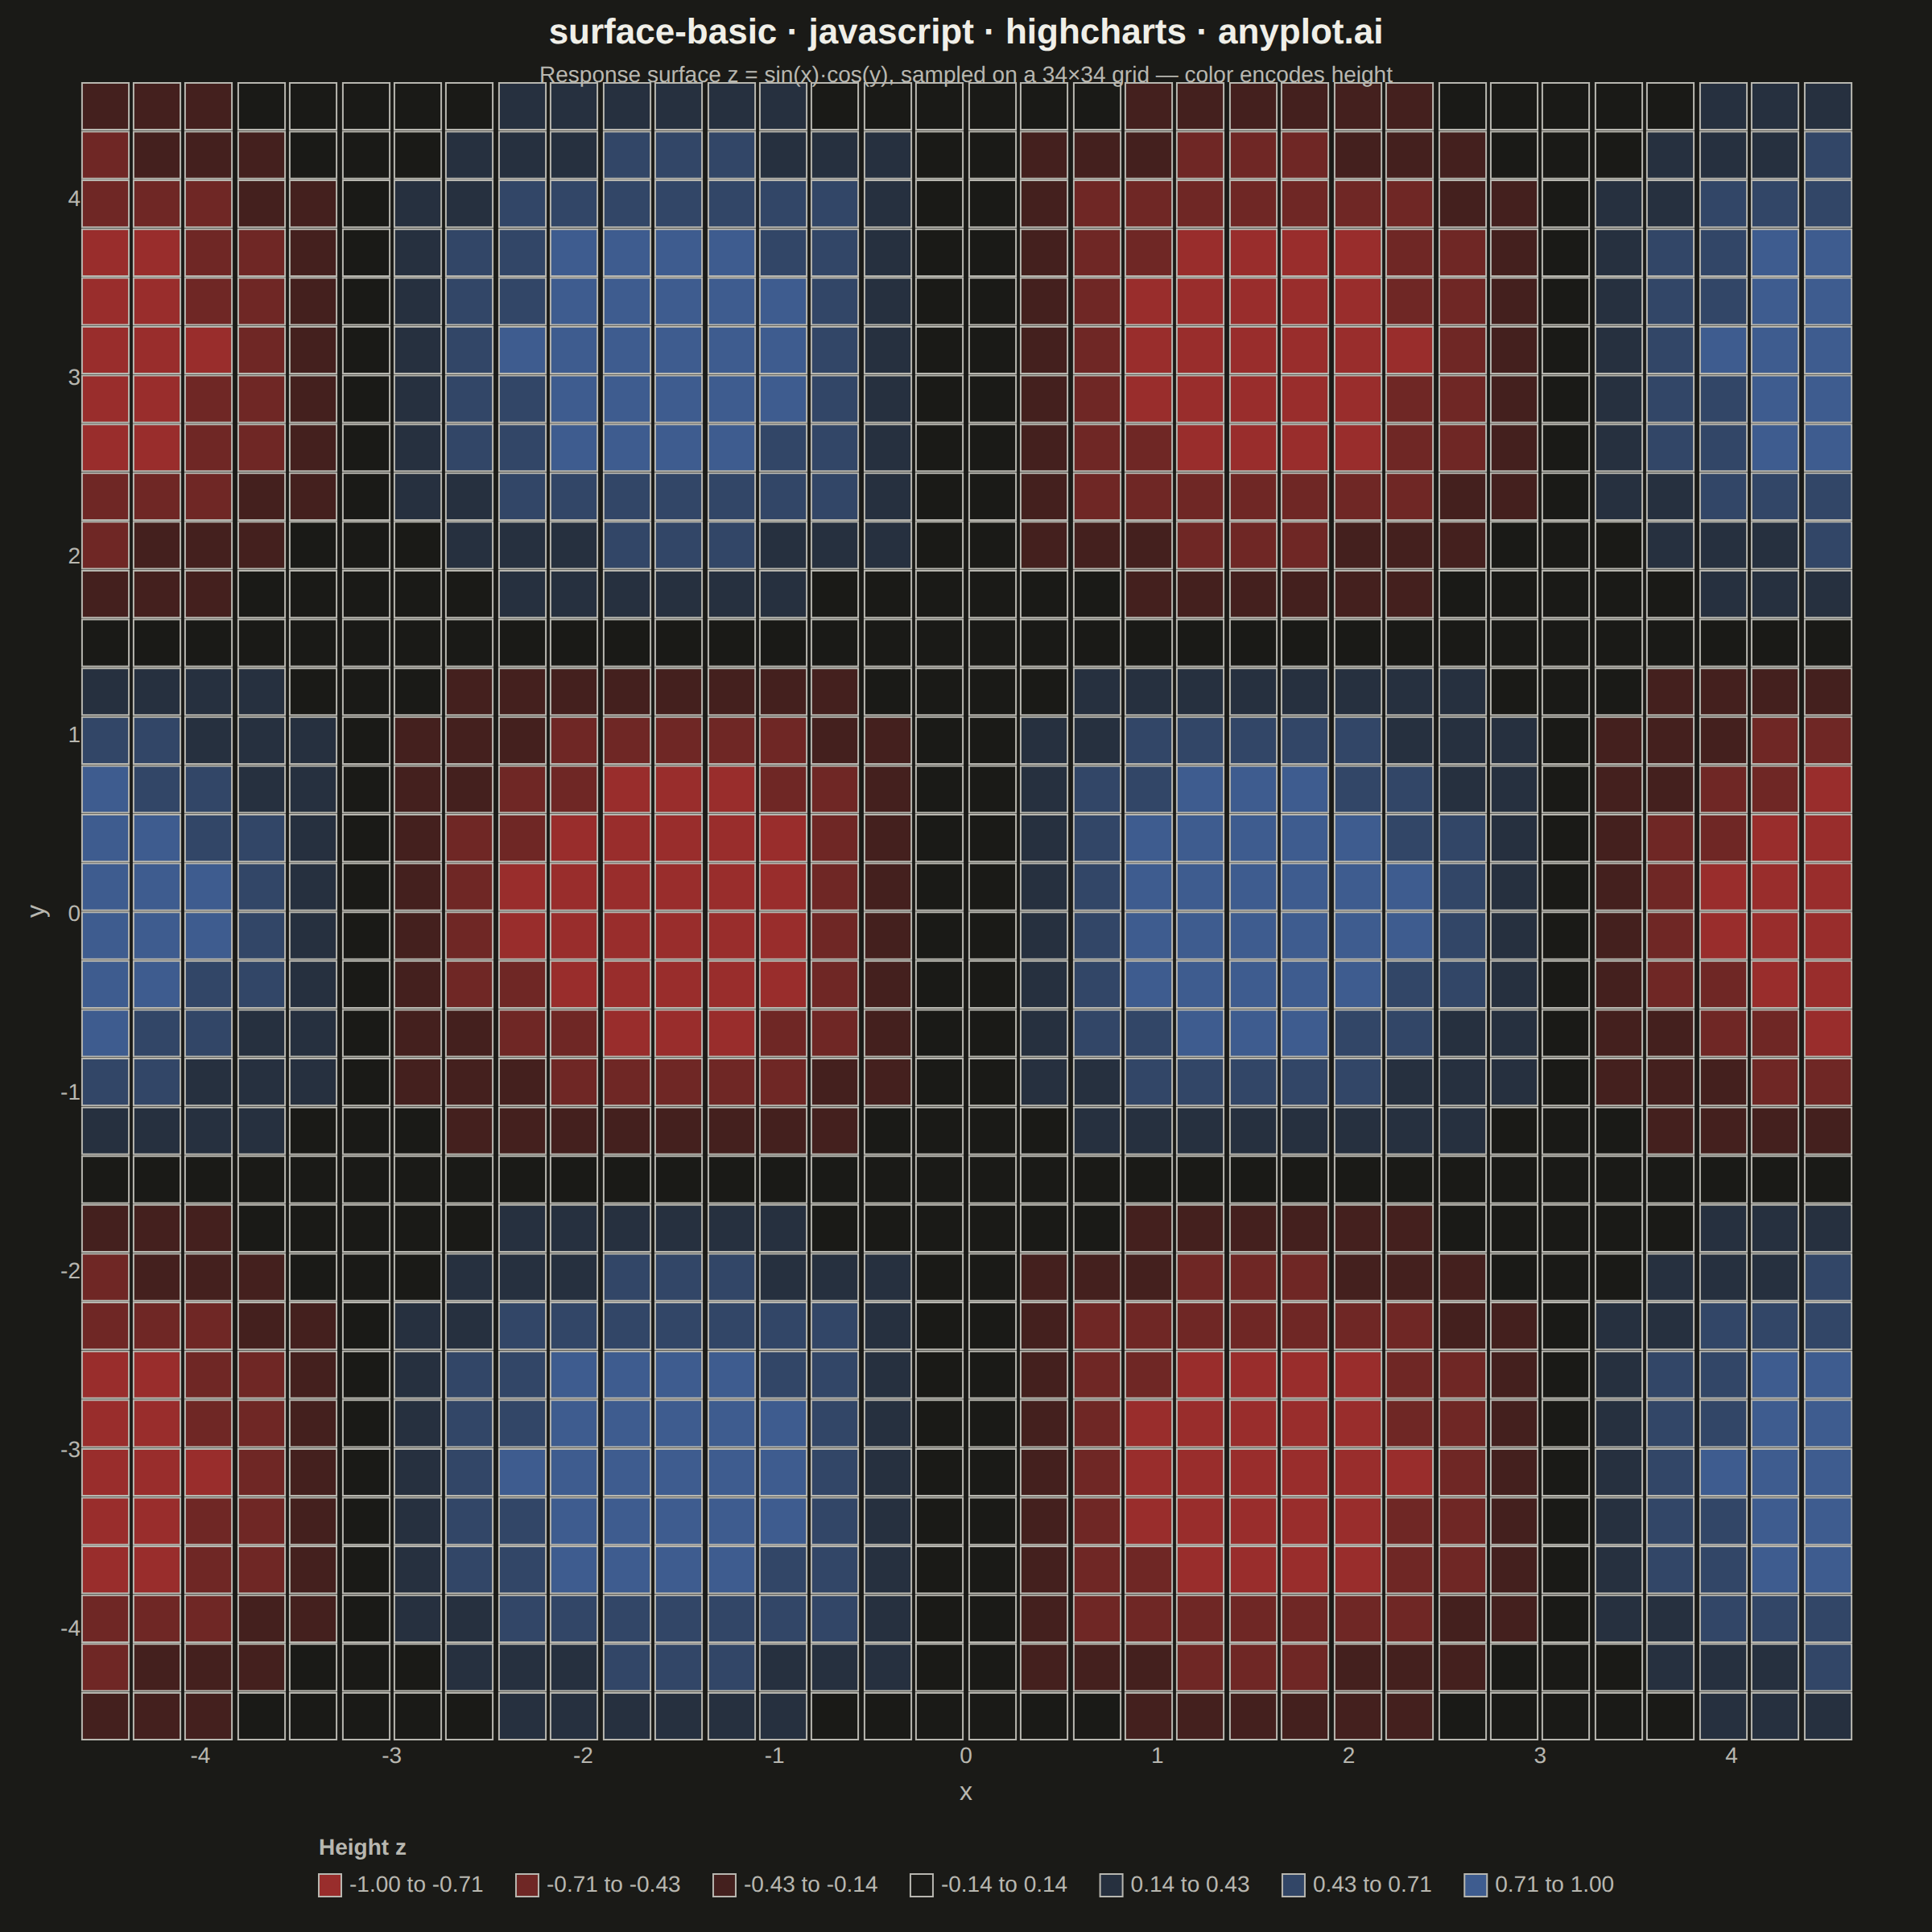
A 3D surface plot visualizes a function of two variables as a continuous surface in three-dimensional space. The height (z-axis) represents the function value at each (x, y) point, with color encoding the same information to enhance depth perception. This visualization is ideal for understanding mathematical functions, terrain data, and response surfaces where the relationship between two inputs and one output needs to be explored.
// anyplot.ai
// surface-basic: Basic 3D Surface Plot
// Library: highcharts 12.6.0 | JavaScript 22.23.2
// Quality: 81/100 | Created: 2026-09-10
//# anyplot-orientation: square

const t = window.ANYPLOT_TOKENS;

// The harness loads only the core `highcharts.js` bundle (see prompts/library/
// highcharts.md "Forbidden patterns") — no `highcharts-3d` (no surface/mesh
// series exists in Highcharts at all, even in that module), no `modules/
// coloraxis` or `modules/heatmap`, no `highcharts-more` (bubble). A true 3D
// surface or a colorAxis-driven heatmap is therefore not representable.
// Instead the height field is rendered as a tiled grid of square scatter
// markers, colored per band by manual hex interpolation — a genuine static
// encoding of z via color + position, not a simulated 3D effect.

// --- Color interpolation (imprint_div — data is signed, meaningful zero) ----
function hexToRgb(hex) {
  const n = parseInt(hex.slice(1), 16);
  return [(n >> 16) & 255, (n >> 8) & 255, n & 255];
}
function rgbToHex(rgb) {
  return (
    "#" +
    rgb
      .map((v) => Math.max(0, Math.min(255, Math.round(v))).toString(16).padStart(2, "0"))
      .join("")
  );
}
function lerpColor(hexA, hexB, frac) {
  const a = hexToRgb(hexA);
  const b = hexToRgb(hexB);
  return rgbToHex(a.map((v, i) => v + (b[i] - v) * frac));
}
function divergingColor(frac) {
  // frac in [0, 1]; 0 = most negative, 0.5 = zero, 1 = most positive
  return frac < 0.5
    ? lerpColor(t.div[0], t.div[1], frac / 0.5)
    : lerpColor(t.div[1], t.div[2], (frac - 0.5) / 0.5);
}

// --- Data (in-memory, deterministic) ----------------------------------------
// Response surface z = sin(x) * cos(y), sampled on a 34x34 grid.
const NX = 34;
const NY = 34;
const HALF_RANGE = 4.5;
const xs = Array.from({ length: NX }, (_, i) => -HALF_RANGE + (2 * HALF_RANGE * i) / (NX - 1));
const ys = Array.from({ length: NY }, (_, i) => -HALF_RANGE + (2 * HALF_RANGE * i) / (NY - 1));

let zAbsMax = 0;
const points = [];
for (const y of ys) {
  for (const x of xs) {
    const z = Math.sin(x) * Math.cos(y);
    points.push({ x, y, z });
    zAbsMax = Math.max(zAbsMax, Math.abs(z));
  }
}

// --- Bin into bands for a discrete, legend-backed color scale (pseudo-colorbar)
const NUM_BANDS = 7;
const bandsData = Array.from({ length: NUM_BANDS }, () => []);
for (const p of points) {
  const frac = (p.z + zAbsMax) / (2 * zAbsMax);
  const band = Math.min(NUM_BANDS - 1, Math.max(0, Math.floor(frac * NUM_BANDS)));
  bandsData[band].push(p);
}

const series = bandsData
  .map((data, k) => {
    const loEdge = -zAbsMax + (2 * zAbsMax * k) / NUM_BANDS;
    const hiEdge = -zAbsMax + (2 * zAbsMax * (k + 1)) / NUM_BANDS;
    const color = divergingColor((k + 0.5) / NUM_BANDS);
    return {
      name: `${loEdge.toFixed(2)} to ${hiEdge.toFixed(2)}`,
      color,
      data,
      // A thin ink-toned stroke keeps every band visible even when its fill
      // is near-identical to the page background (the middle diverging band
      // sits within ~1 RGB unit of both #FAF8F1 and #1A1A17).
      marker: { symbol: "square", radius: 6, fillColor: color, lineWidth: 1, lineColor: t.inkSoft },
    };
  })
  .filter((s) => s.data.length > 0);

// --- Chart -------------------------------------------------------------------
Highcharts.chart("container", {
  chart: {
    type: "scatter",
    backgroundColor: "transparent",
    animation: false,
    style: { fontFamily: "inherit" },
    events: {
      // Markers must tile the (x, y) grid with no gaps to read as a
      // continuous surface. The true plot-area pixel size only exists after
      // Highcharts lays out the title/legend/axes, so the radius is derived
      // from the rendered axis scale (toPixels) rather than guessed margins.
      load: function () {
        const chart = this;
        // The y-axis title + tick labels reserve real width on the plot
        // area's left edge; nothing reserves matching width on the right by
        // default, so the tiled grid sits flush against the right canvas
        // edge while the left keeps a full margin. Mirror the (larger) left
        // margin onto the right before sizing markers, so both edges match.
        if (chart.plotLeft > chart.marginRight) {
          chart.update({ chart: { marginRight: chart.plotLeft } }, true);
        }
        const xPx = Math.abs(chart.xAxis[0].toPixels(xs[1]) - chart.xAxis[0].toPixels(xs[0]));
        const yPx = Math.abs(chart.yAxis[0].toPixels(ys[1]) - chart.yAxis[0].toPixels(ys[0]));
        const radius = Math.max(2, (Math.min(xPx, yPx) / 2) * 0.96);
        chart.series.forEach((s) => s.update({ marker: { radius } }, false));
        chart.redraw();
      },
    },
  },
  credits: { enabled: false },
  colors: t.palette,
  title: {
    text: "surface-basic · javascript · highcharts · anyplot.ai",
    style: { color: t.ink, fontSize: "22px", fontWeight: "600" },
  },
  subtitle: {
    text: "Response surface z = sin(x)·cos(y), sampled on a 34×34 grid — color encodes height",
    style: { color: t.inkSoft, fontSize: "14px" },
  },
  // Axis lines off: the tiled grid already delineates the data extent, and a
  // drawn axis line renders on top of the boundary markers, slicing through
  // them at every seam once markers are sized to tile edge-to-edge.
  xAxis: {
    title: { text: "x", style: { color: t.inkSoft, fontSize: "16px" } },
    min: -HALF_RANGE,
    max: HALF_RANGE,
    startOnTick: false,
    endOnTick: false,
    minPadding: 0.03,
    maxPadding: 0.03,
    lineWidth: 0,
    tickLength: 0,
    gridLineWidth: 0,
    labels: { style: { color: t.inkSoft, fontSize: "14px" } },
  },
  yAxis: {
    title: { text: "y", style: { color: t.inkSoft, fontSize: "16px" } },
    min: -HALF_RANGE,
    max: HALF_RANGE,
    startOnTick: false,
    endOnTick: false,
    minPadding: 0.03,
    maxPadding: 0.03,
    lineWidth: 0,
    tickLength: 0,
    gridLineWidth: 0,
    labels: { style: { color: t.inkSoft, fontSize: "14px" } },
  },
  legend: {
    title: { text: "Height z", style: { color: t.inkSoft, fontSize: "14px" } },
    itemStyle: { color: t.inkSoft, fontSize: "14px" },
    itemHoverStyle: { color: t.ink },
    verticalAlign: "bottom",
    align: "center",
    layout: "horizontal",
    symbolHeight: 14,
    symbolWidth: 14,
  },
  tooltip: {
    formatter: function () {
      return `x: ${this.point.x.toFixed(2)}<br>y: ${this.point.y.toFixed(2)}<br>z: ${this.point.z.toFixed(3)}`;
    },
  },
  plotOptions: {
    series: { animation: false, states: { hover: { enabled: false } } },
  },
  series,
});
Runnable source as JSON, for any HTTP client: https://api.anyplot.ai/specs/surface-basic/highcharts/code. Any spec id and library id listed in llms-full.txt fit the same URL shape; every URL below is complete and callable.
{
  "spec_id": "surface-basic",
  "language": "javascript",
  "library": "highcharts",
  "page": "https://anyplot.ai/surface-basic/javascript/highcharts",
  "hub": "https://anyplot.ai/surface-basic",
  "code_json": "https://api.anyplot.ai/specs/surface-basic/highcharts/code",
  "spec_json": "https://api.anyplot.ai/specs/surface-basic",
  "render_light_png": "https://storage.googleapis.com/anyplot-images/plots/surface-basic/javascript/highcharts/plot-light.png",
  "render_dark_png": "https://storage.googleapis.com/anyplot-images/plots/surface-basic/javascript/highcharts/plot-dark.png",
  "interactive_light_html": "https://storage.googleapis.com/anyplot-images/plots/surface-basic/javascript/highcharts/plot-light.html",
  "interactive_dark_html": "https://storage.googleapis.com/anyplot-images/plots/surface-basic/javascript/highcharts/plot-dark.html",
  "quality_score": 81.0,
  "license": "MIT",
  "guide": "https://anyplot.ai/llms.txt"
}
Part of Basic 3D Surface Plot on anyplot.ai.