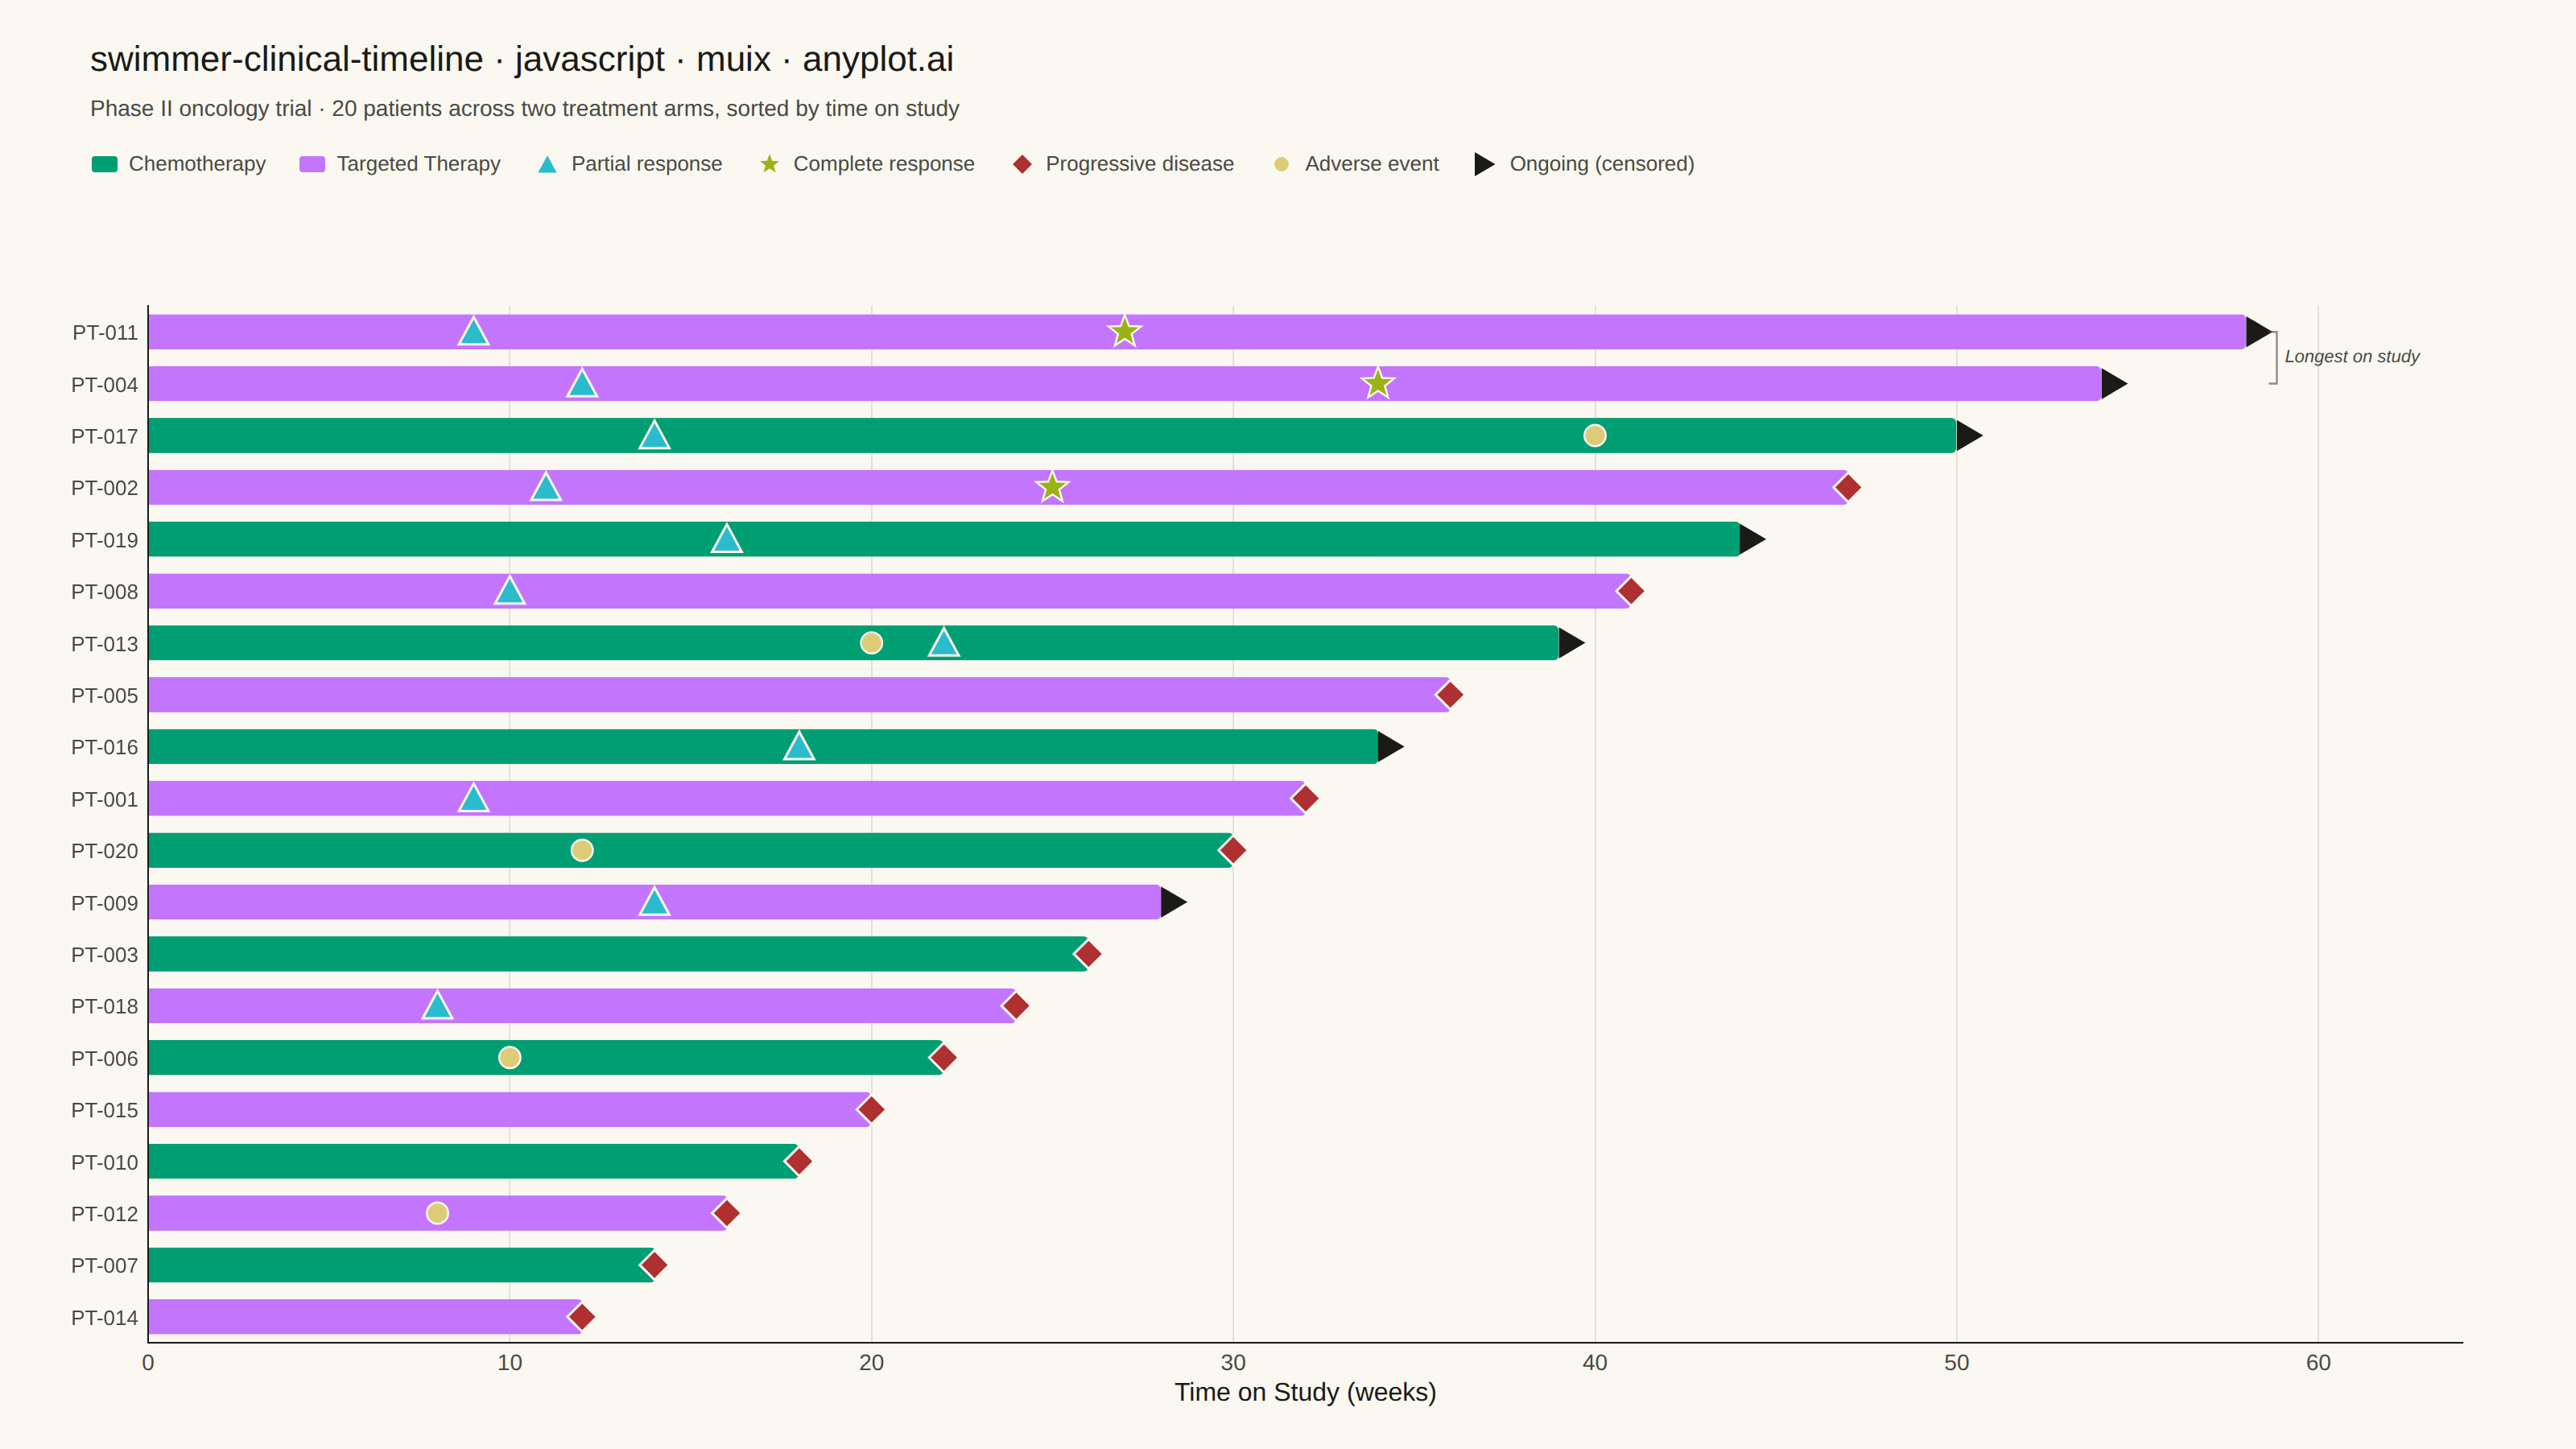
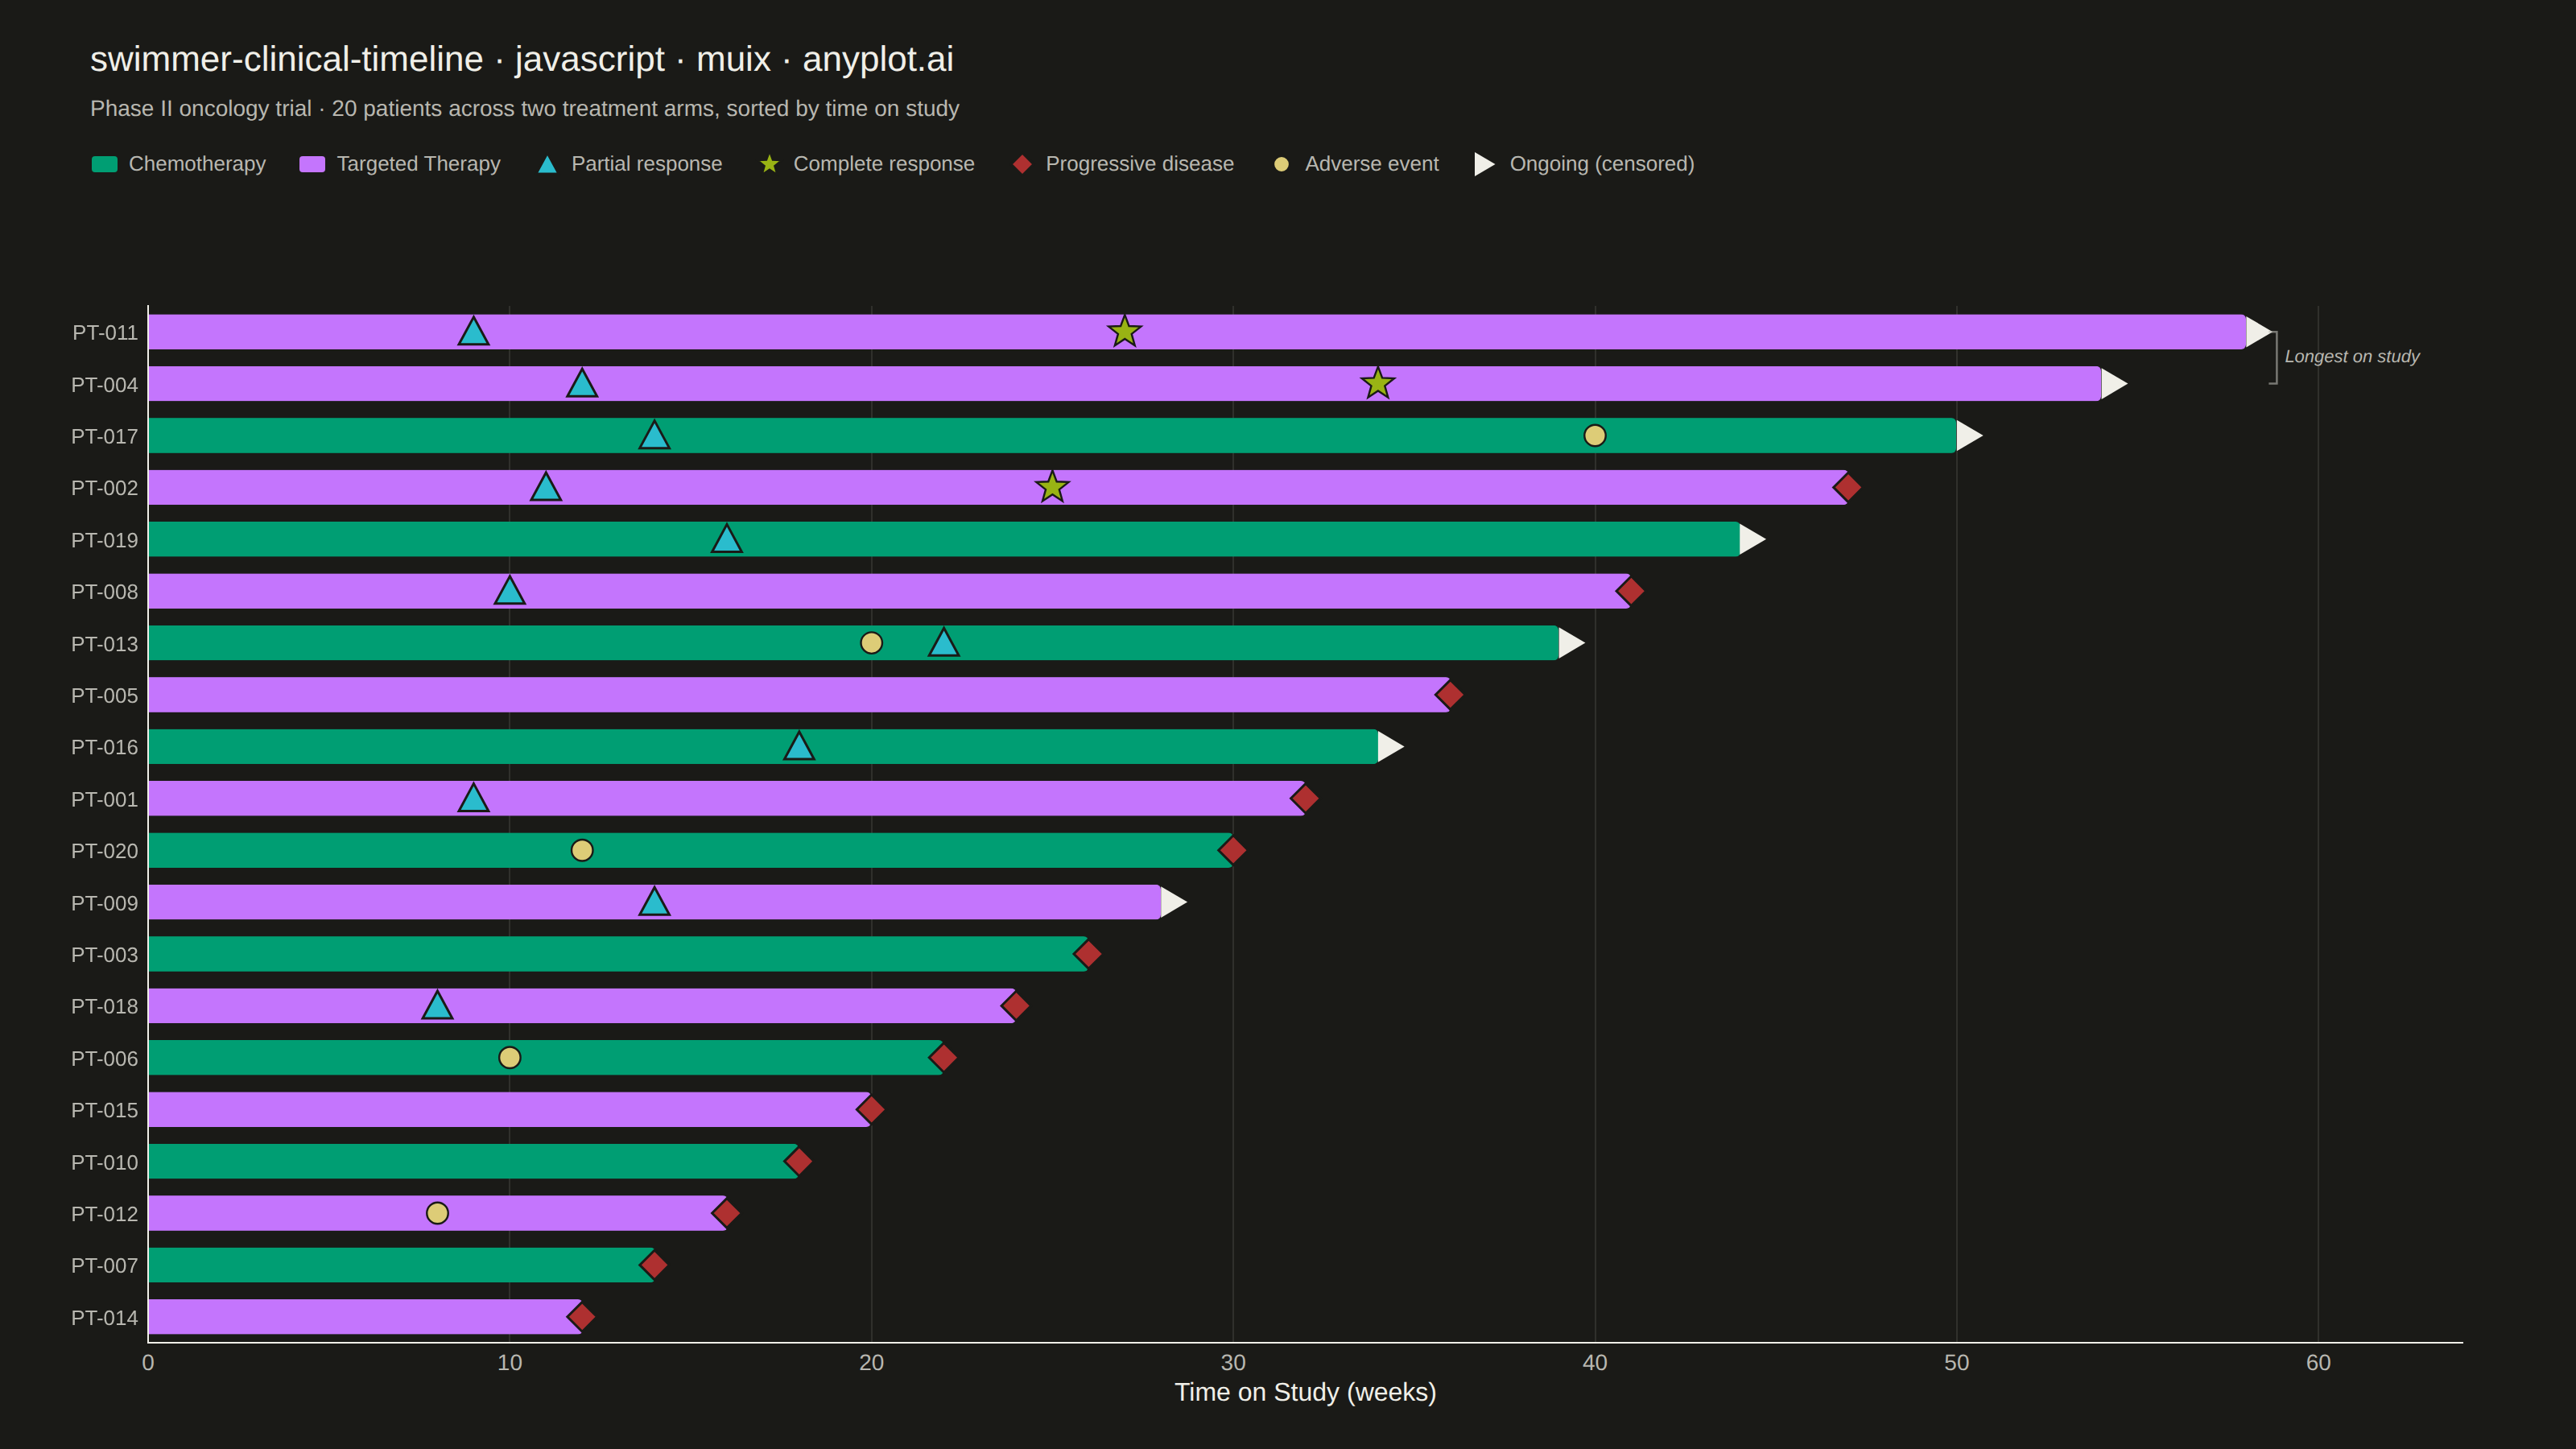
A swimmer plot displays individual patient timelines as horizontal bars, commonly used in clinical oncology to visualize treatment duration, response events, and disease progression across a study cohort. Each bar represents one patient, typically sorted by treatment duration, with symbols or color changes marking key clinical events such as partial response, complete response, or progressive disease. This plot is standard in clinical trial publications and regulatory submissions for conveying patient-level longitudinal outcomes at a glance.
Preview render from the MUI X Charts implementation.