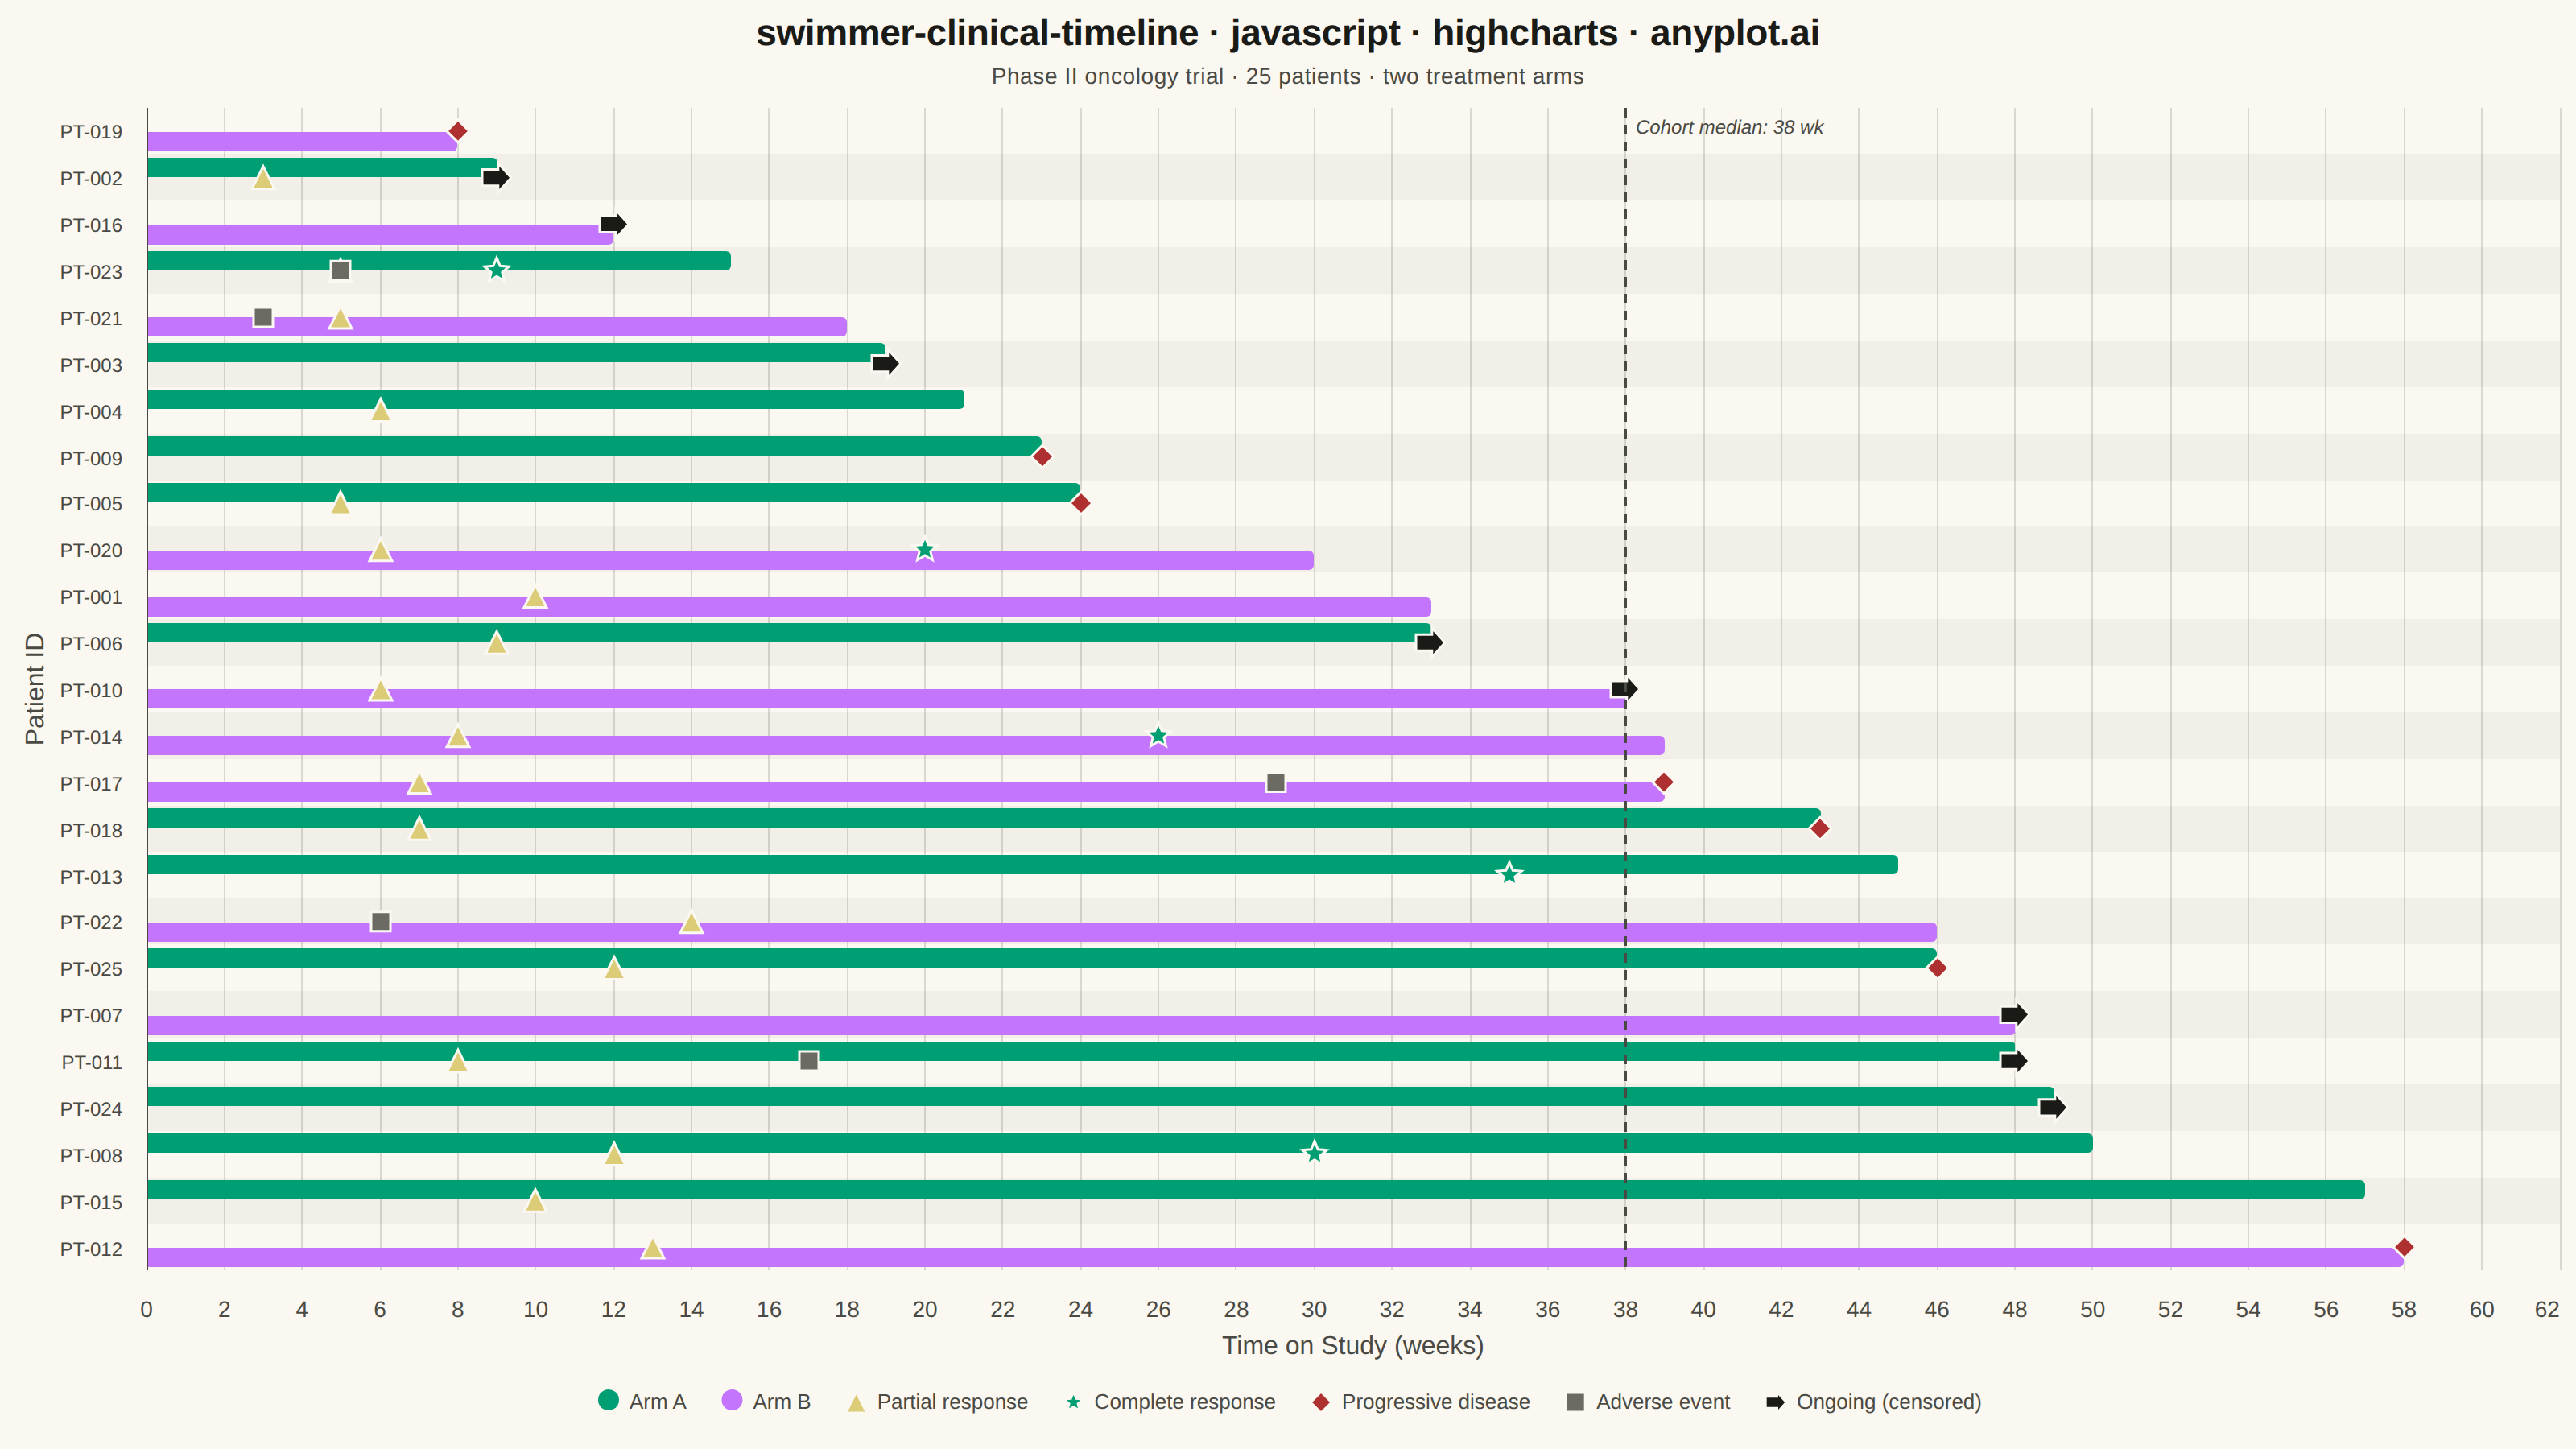
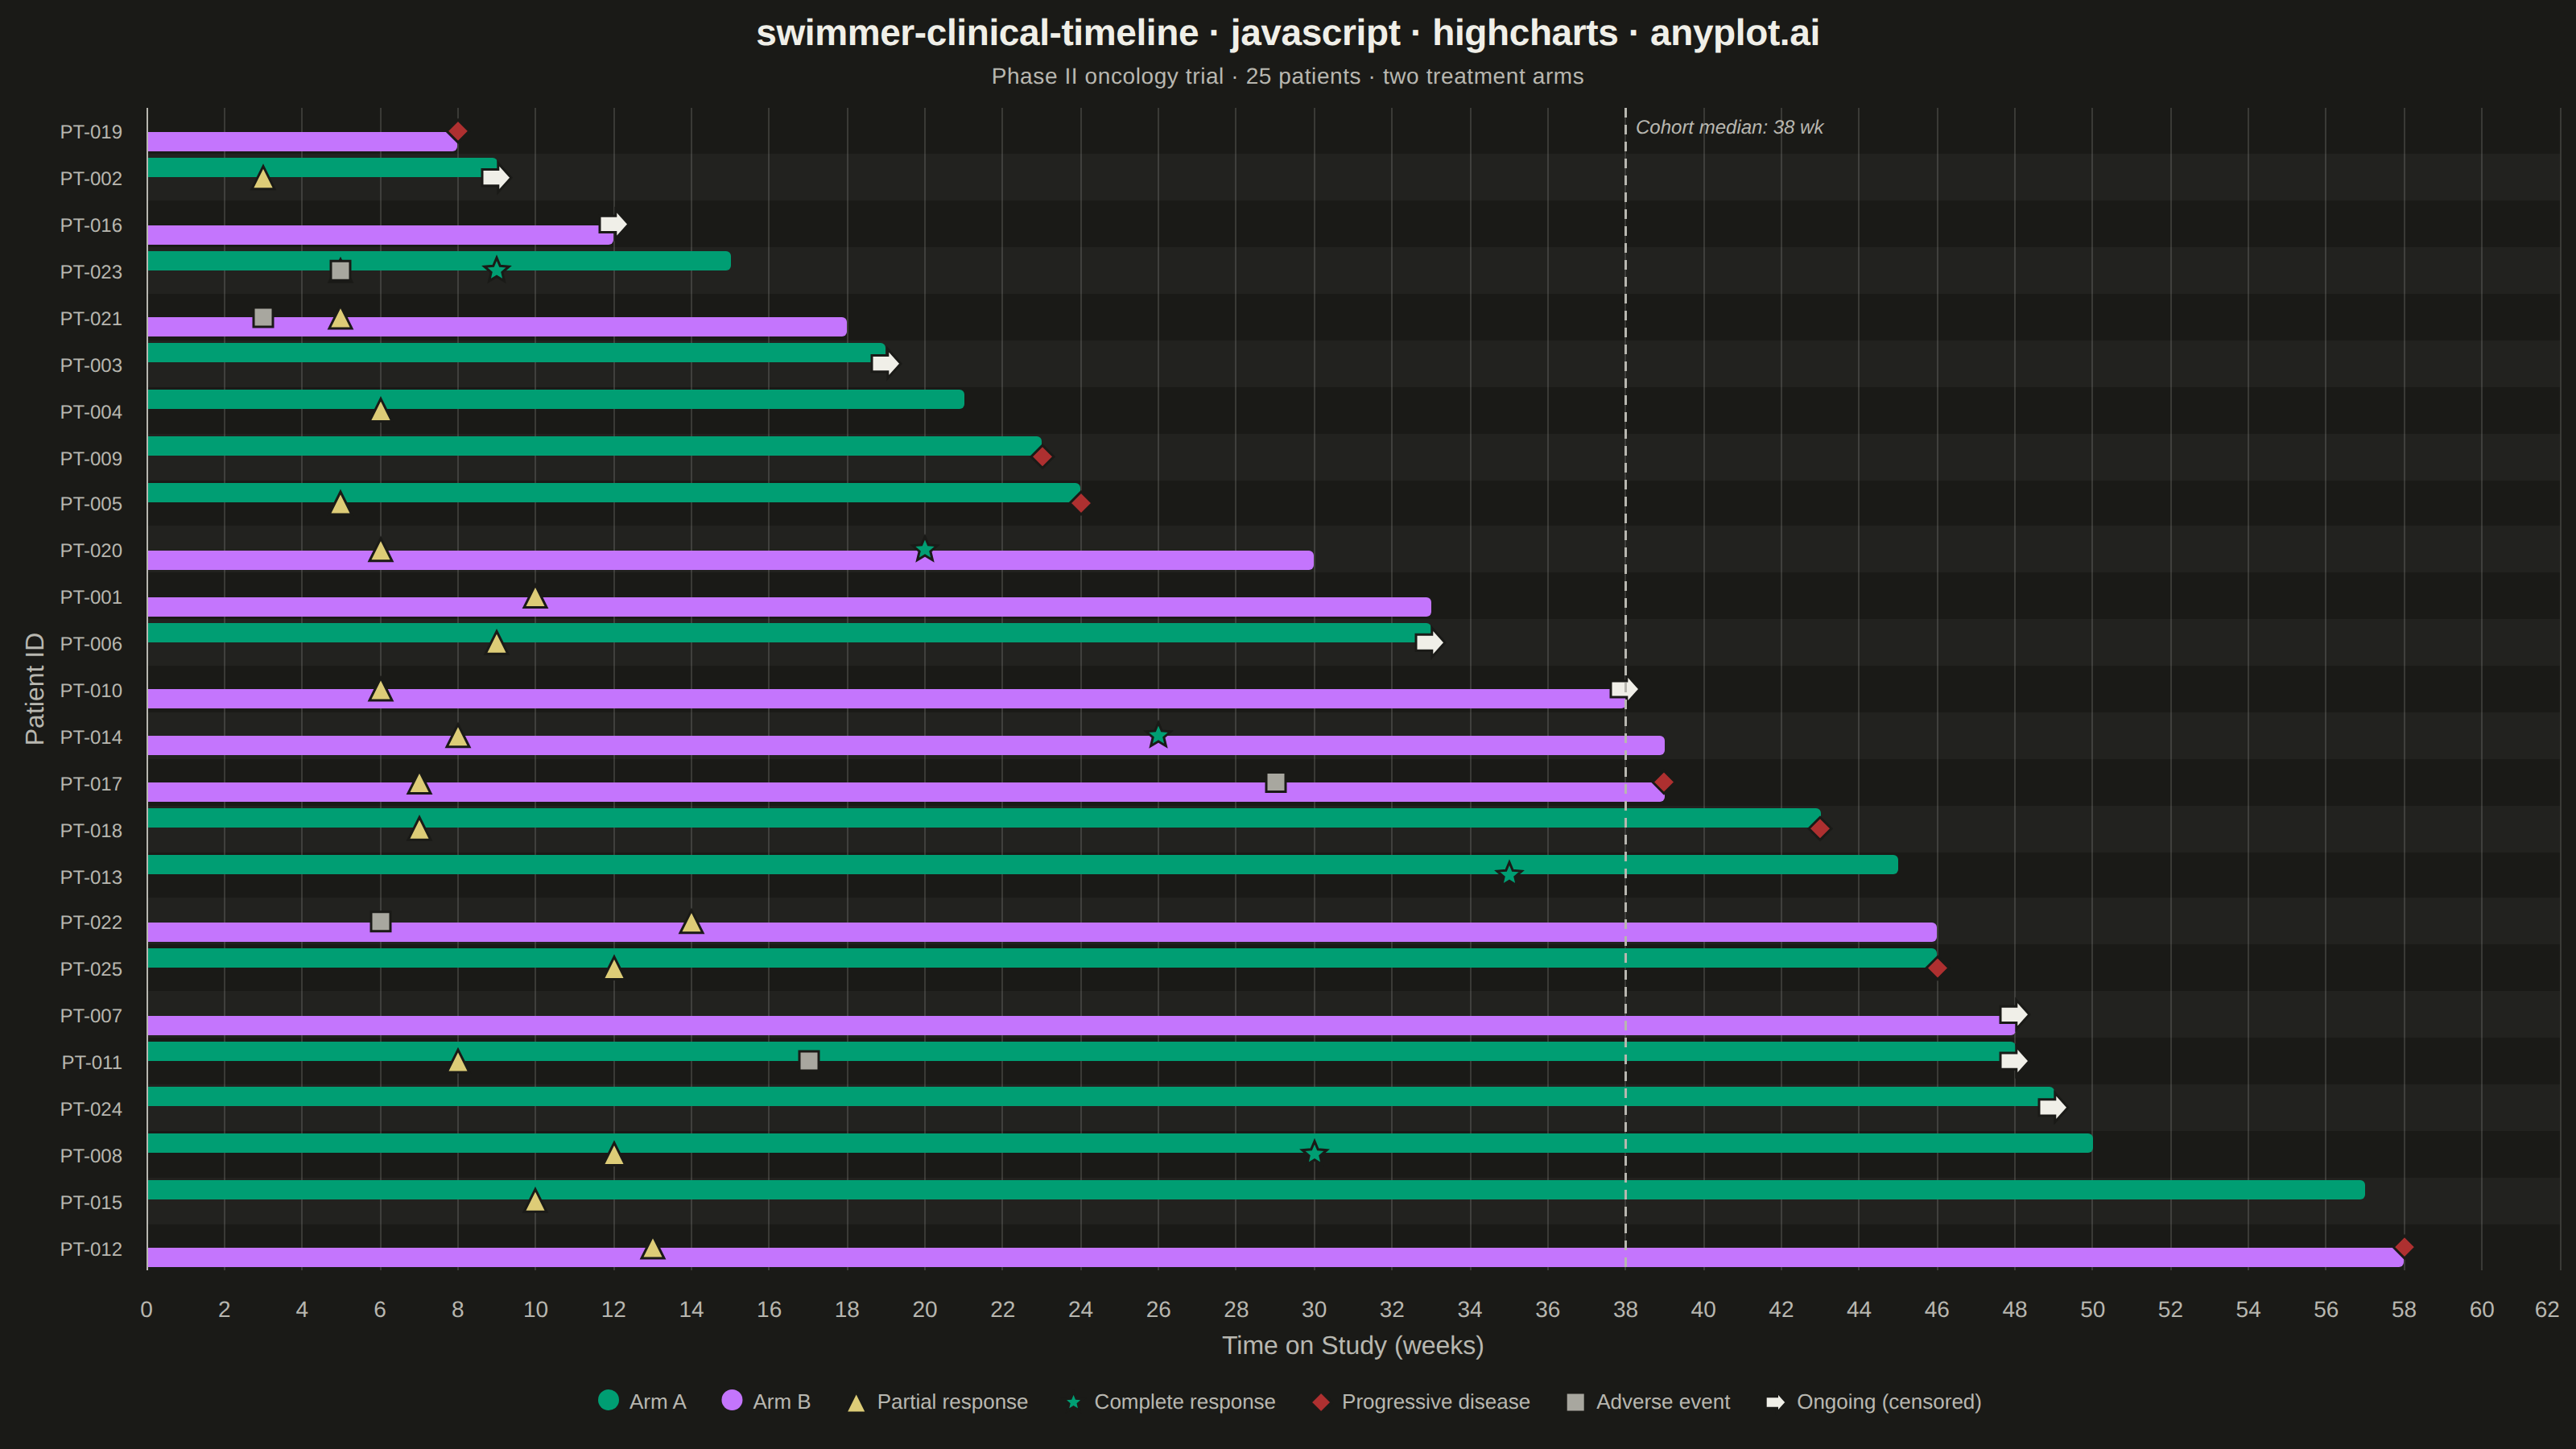
The same plot in 14 other libraries — JavaScript: Chart.js, D3.js, Apache ECharts, MUI X Charts; Python: Altair, Bokeh, lets-plot, Matplotlib, Plotly, plotnine, Pygal, Seaborn; R: ggplot2; Julia: Makie.jl. Compare all 15 side by side: Swimmer Plot for Clinical Trial Timelines in Python, R, Julia and JavaScript.
A swimmer plot displays individual patient timelines as horizontal bars, commonly used in clinical oncology to visualize treatment duration, response events, and disease progression across a study cohort. Each bar represents one patient, typically sorted by treatment duration, with symbols or color changes marking key clinical events such as partial response, complete response, or progressive disease. This plot is standard in clinical trial publications and regulatory submissions for conveying patient-level longitudinal outcomes at a glance.
// anyplot.ai
// swimmer-clinical-timeline: Swimmer Plot for Clinical Trial Timelines
// Library: highcharts 12.6.0 | JavaScript 22.23.2
// Quality: 93/100 | Created: 2026-08-24

const t = window.ANYPLOT_TOKENS;
// ANYPLOT_TOKENS has no "muted" anchor — derive it the same way the style
// guide's INK_MUTED reference snippet does (tertiary text / disabled tone).
const inkMuted = t.theme === "dark" ? "#A8A79F" : "#6B6A63";

// --- Custom markers (core Highcharts has no star/arrow symbol) -------------
Highcharts.SVGRenderer.prototype.symbols.star = function (x, y, w, h) {
  const cx = x + w / 2;
  const cy = y + h / 2;
  const outerR = w / 2;
  const innerR = outerR * 0.45;
  const path = [];
  for (let i = 0; i < 10; i += 1) {
    const r = i % 2 === 0 ? outerR : innerR;
    const angle = (Math.PI / 5) * i - Math.PI / 2;
    const px = cx + r * Math.cos(angle);
    const py = cy + r * Math.sin(angle);
    path.push(i === 0 ? ["M", px, py] : ["L", px, py]);
  }
  path.push(["Z"]);
  return path;
};

Highcharts.SVGRenderer.prototype.symbols.arrow = function (x, y, w, h) {
  const midY = y + h / 2;
  return [
    ["M", x, midY - h * 0.28],
    ["L", x + w * 0.55, midY - h * 0.28],
    ["L", x + w * 0.55, y],
    ["L", x + w, midY],
    ["L", x + w * 0.55, y + h],
    ["L", x + w * 0.55, midY + h * 0.28],
    ["L", x, midY + h * 0.28],
    ["Z"],
  ];
};

// --- Data (in-memory, deterministic, tiny fixed-seed LCG) -------------------
let seed = 42;
function nextRandom() {
  seed = (seed * 1103515245 + 12345) & 0x7fffffff;
  return seed / 0x7fffffff;
}

const patientCount = 25;
const patients = [];
for (let i = 0; i < patientCount; i += 1) {
  const group = nextRandom() < 0.52 ? "Arm A" : "Arm B";
  const durationWeeks = Math.round(6 + nextRandom() * 52);
  const ongoing = nextRandom() < 0.28;
  const events = [];

  if (nextRandom() < 0.7) {
    const time = Math.round(durationWeeks * (0.15 + nextRandom() * 0.2));
    events.push({ time, type: "partial_response" });
  }

  const outcomeRoll = nextRandom();
  if (!ongoing && outcomeRoll < 0.35) {
    const time = Math.round(durationWeeks * (0.55 + nextRandom() * 0.35));
    events.push({ time: Math.min(time, durationWeeks), type: "complete_response" });
  } else if (!ongoing && outcomeRoll < 0.65) {
    events.push({ time: durationWeeks, type: "progressive_disease" });
  }

  if (nextRandom() < 0.3) {
    const time = Math.round(durationWeeks * (0.1 + nextRandom() * 0.7));
    events.push({ time, type: "adverse_event" });
  }

  patients.push({
    id: `PT-${String(i + 1).padStart(3, "0")}`,
    group,
    durationWeeks,
    ongoing,
    events,
  });
}

// Sorted so the longest-running patient lands at the top of the inverted axis
patients.sort((a, b) => a.durationWeeks - b.durationWeeks);

// Cohort median duration — a data-derived focal point for the "story" of the
// cohort (patients array is already duration-sorted, so the middle entry is
// the median), not an arbitrary annotation.
const medianDurationWeeks = patients[Math.floor(patients.length / 2)].durationWeeks;

const categories = patients.map((p) => p.id);
const armAData = [];
const armBData = [];
const partialResponseData = [];
const completeResponseData = [];
const progressiveDiseaseData = [];
const adverseEventData = [];
const ongoingData = [];

patients.forEach((p, index) => {
  const bar = { x: index, y: p.durationWeeks };
  if (p.group === "Arm A") {
    armAData.push(bar);
  } else {
    armBData.push(bar);
  }
  if (p.ongoing) {
    ongoingData.push({ x: index, y: p.durationWeeks });
  }
  p.events.forEach((event) => {
    const point = { x: index, y: event.time };
    if (event.type === "partial_response") partialResponseData.push(point);
    if (event.type === "complete_response") completeResponseData.push(point);
    if (event.type === "progressive_disease") progressiveDiseaseData.push(point);
    if (event.type === "adverse_event") adverseEventData.push(point);
  });
});

// Subtle zebra banding across the 25 patient rows aids scanning without
// competing with the data (kept within the grid-opacity range).
const rowBandColor = t.theme === "dark" ? "rgba(255,255,255,0.035)" : "rgba(0,0,0,0.035)";
const rowBands = categories
  .map((_, i) => i)
  .filter((i) => i % 2 === 1)
  .map((i) => ({ from: i - 0.5, to: i + 0.5, color: rowBandColor }));

// --- Chart -------------------------------------------------------------------
Highcharts.chart("container", {
  chart: {
    type: "column",
    inverted: true,
    backgroundColor: "transparent",
    animation: false,
    style: { fontFamily: "inherit" },
  },
  credits: { enabled: false },
  colors: t.palette,
  title: {
    text: "swimmer-clinical-timeline · javascript · highcharts · anyplot.ai",
    style: { color: t.ink, fontSize: "23px", fontWeight: "700", letterSpacing: "-0.2px" },
  },
  subtitle: {
    text: "Phase II oncology trial · 25 patients · two treatment arms",
    style: { color: t.inkSoft, fontSize: "14px", fontWeight: "400", letterSpacing: "0.3px" },
  },
  xAxis: {
    categories,
    plotBands: rowBands,
    title: { text: "Patient ID", style: { color: t.inkSoft, fontSize: "16px" } },
    lineColor: t.inkSoft,
    tickColor: t.inkSoft,
    labels: { style: { color: t.inkSoft, fontSize: "12px", fontWeight: "500" } },
  },
  yAxis: {
    title: { text: "Time on Study (weeks)", style: { color: t.inkSoft, fontSize: "16px" } },
    gridLineColor: t.grid,
    lineColor: t.inkSoft,
    tickColor: t.inkSoft,
    labels: { style: { color: t.inkSoft, fontSize: "14px" } },
    min: 0,
    plotLines: [
      {
        value: medianDurationWeeks,
        color: t.inkSoft,
        width: 1.5,
        dashStyle: "Dash",
        zIndex: 5,
        label: {
          text: `Cohort median: ${medianDurationWeeks} wk`,
          rotation: 0,
          align: "left",
          verticalAlign: "top",
          x: 6,
          y: 16,
          style: { color: t.inkSoft, fontSize: "12px", fontStyle: "italic" },
        },
      },
    ],
  },
  legend: {
    itemStyle: { color: t.inkSoft, fontSize: "13px" },
    itemHoverStyle: { color: t.ink },
  },
  plotOptions: {
    series: { animation: false },
    column: { borderWidth: 0, pointWidth: 12, pointPadding: 0.15, groupPadding: 0.05 },
    scatter: { marker: { lineColor: t.pageBg, lineWidth: 1.5 } },
  },
  tooltip: {
    backgroundColor: t.elevatedBg,
    borderColor: t.grid,
    style: { color: t.ink, fontSize: "13px" },
    headerFormat: "<b>{point.key}</b><br/>",
    pointFormat: "{series.name}: {point.y} wk",
  },
  series: [
    { type: "column", name: "Arm A", data: armAData, color: t.palette[0] },
    { type: "column", name: "Arm B", data: armBData, color: t.palette[1] },
    {
      type: "scatter",
      name: "Partial response",
      data: partialResponseData,
      color: t.amber,
      marker: { symbol: "triangle", radius: 7 },
    },
    {
      type: "scatter",
      name: "Complete response",
      data: completeResponseData,
      color: t.palette[0],
      marker: { symbol: "star", radius: 8 },
    },
    {
      type: "scatter",
      name: "Progressive disease",
      data: progressiveDiseaseData,
      color: t.palette[4],
      marker: { symbol: "diamond", radius: 7 },
    },
    {
      type: "scatter",
      name: "Adverse event",
      data: adverseEventData,
      color: inkMuted,
      marker: { symbol: "square", radius: 6 },
    },
    {
      type: "scatter",
      name: "Ongoing (censored)",
      data: ongoingData,
      color: t.ink,
      marker: { symbol: "arrow", radius: 9 },
    },
  ],
});
Runnable source as JSON, for any HTTP client: https://api.anyplot.ai/specs/swimmer-clinical-timeline/highcharts/code. Any spec id and library id listed in llms-full.txt fit the same URL shape; every URL below is complete and callable.
{
  "spec_id": "swimmer-clinical-timeline",
  "language": "javascript",
  "library": "highcharts",
  "page": "https://anyplot.ai/swimmer-clinical-timeline/javascript/highcharts",
  "hub": "https://anyplot.ai/swimmer-clinical-timeline",
  "code_json": "https://api.anyplot.ai/specs/swimmer-clinical-timeline/highcharts/code",
  "spec_json": "https://api.anyplot.ai/specs/swimmer-clinical-timeline",
  "render_light_png": "https://storage.googleapis.com/anyplot-images/plots/swimmer-clinical-timeline/javascript/highcharts/plot-light.png",
  "render_dark_png": "https://storage.googleapis.com/anyplot-images/plots/swimmer-clinical-timeline/javascript/highcharts/plot-dark.png",
  "interactive_light_html": "https://storage.googleapis.com/anyplot-images/plots/swimmer-clinical-timeline/javascript/highcharts/plot-light.html",
  "interactive_dark_html": "https://storage.googleapis.com/anyplot-images/plots/swimmer-clinical-timeline/javascript/highcharts/plot-dark.html",
  "quality_score": 93.0,
  "license": "MIT",
  "guide": "https://anyplot.ai/llms.txt"
}
Part of Swimmer Plot for Clinical Trial Timelines on anyplot.ai.