The same plot in 14 other libraries — Python: Altair, Bokeh, lets-plot, Matplotlib, Plotly, plotnine, Pygal, Seaborn; Julia: Makie.jl; JavaScript: Chart.js, D3.js, Apache ECharts, Highcharts, MUI X Charts. Compare all 15 side by side: Swimmer Plot for Clinical Trial Timelines in Python, R, Julia and JavaScript.
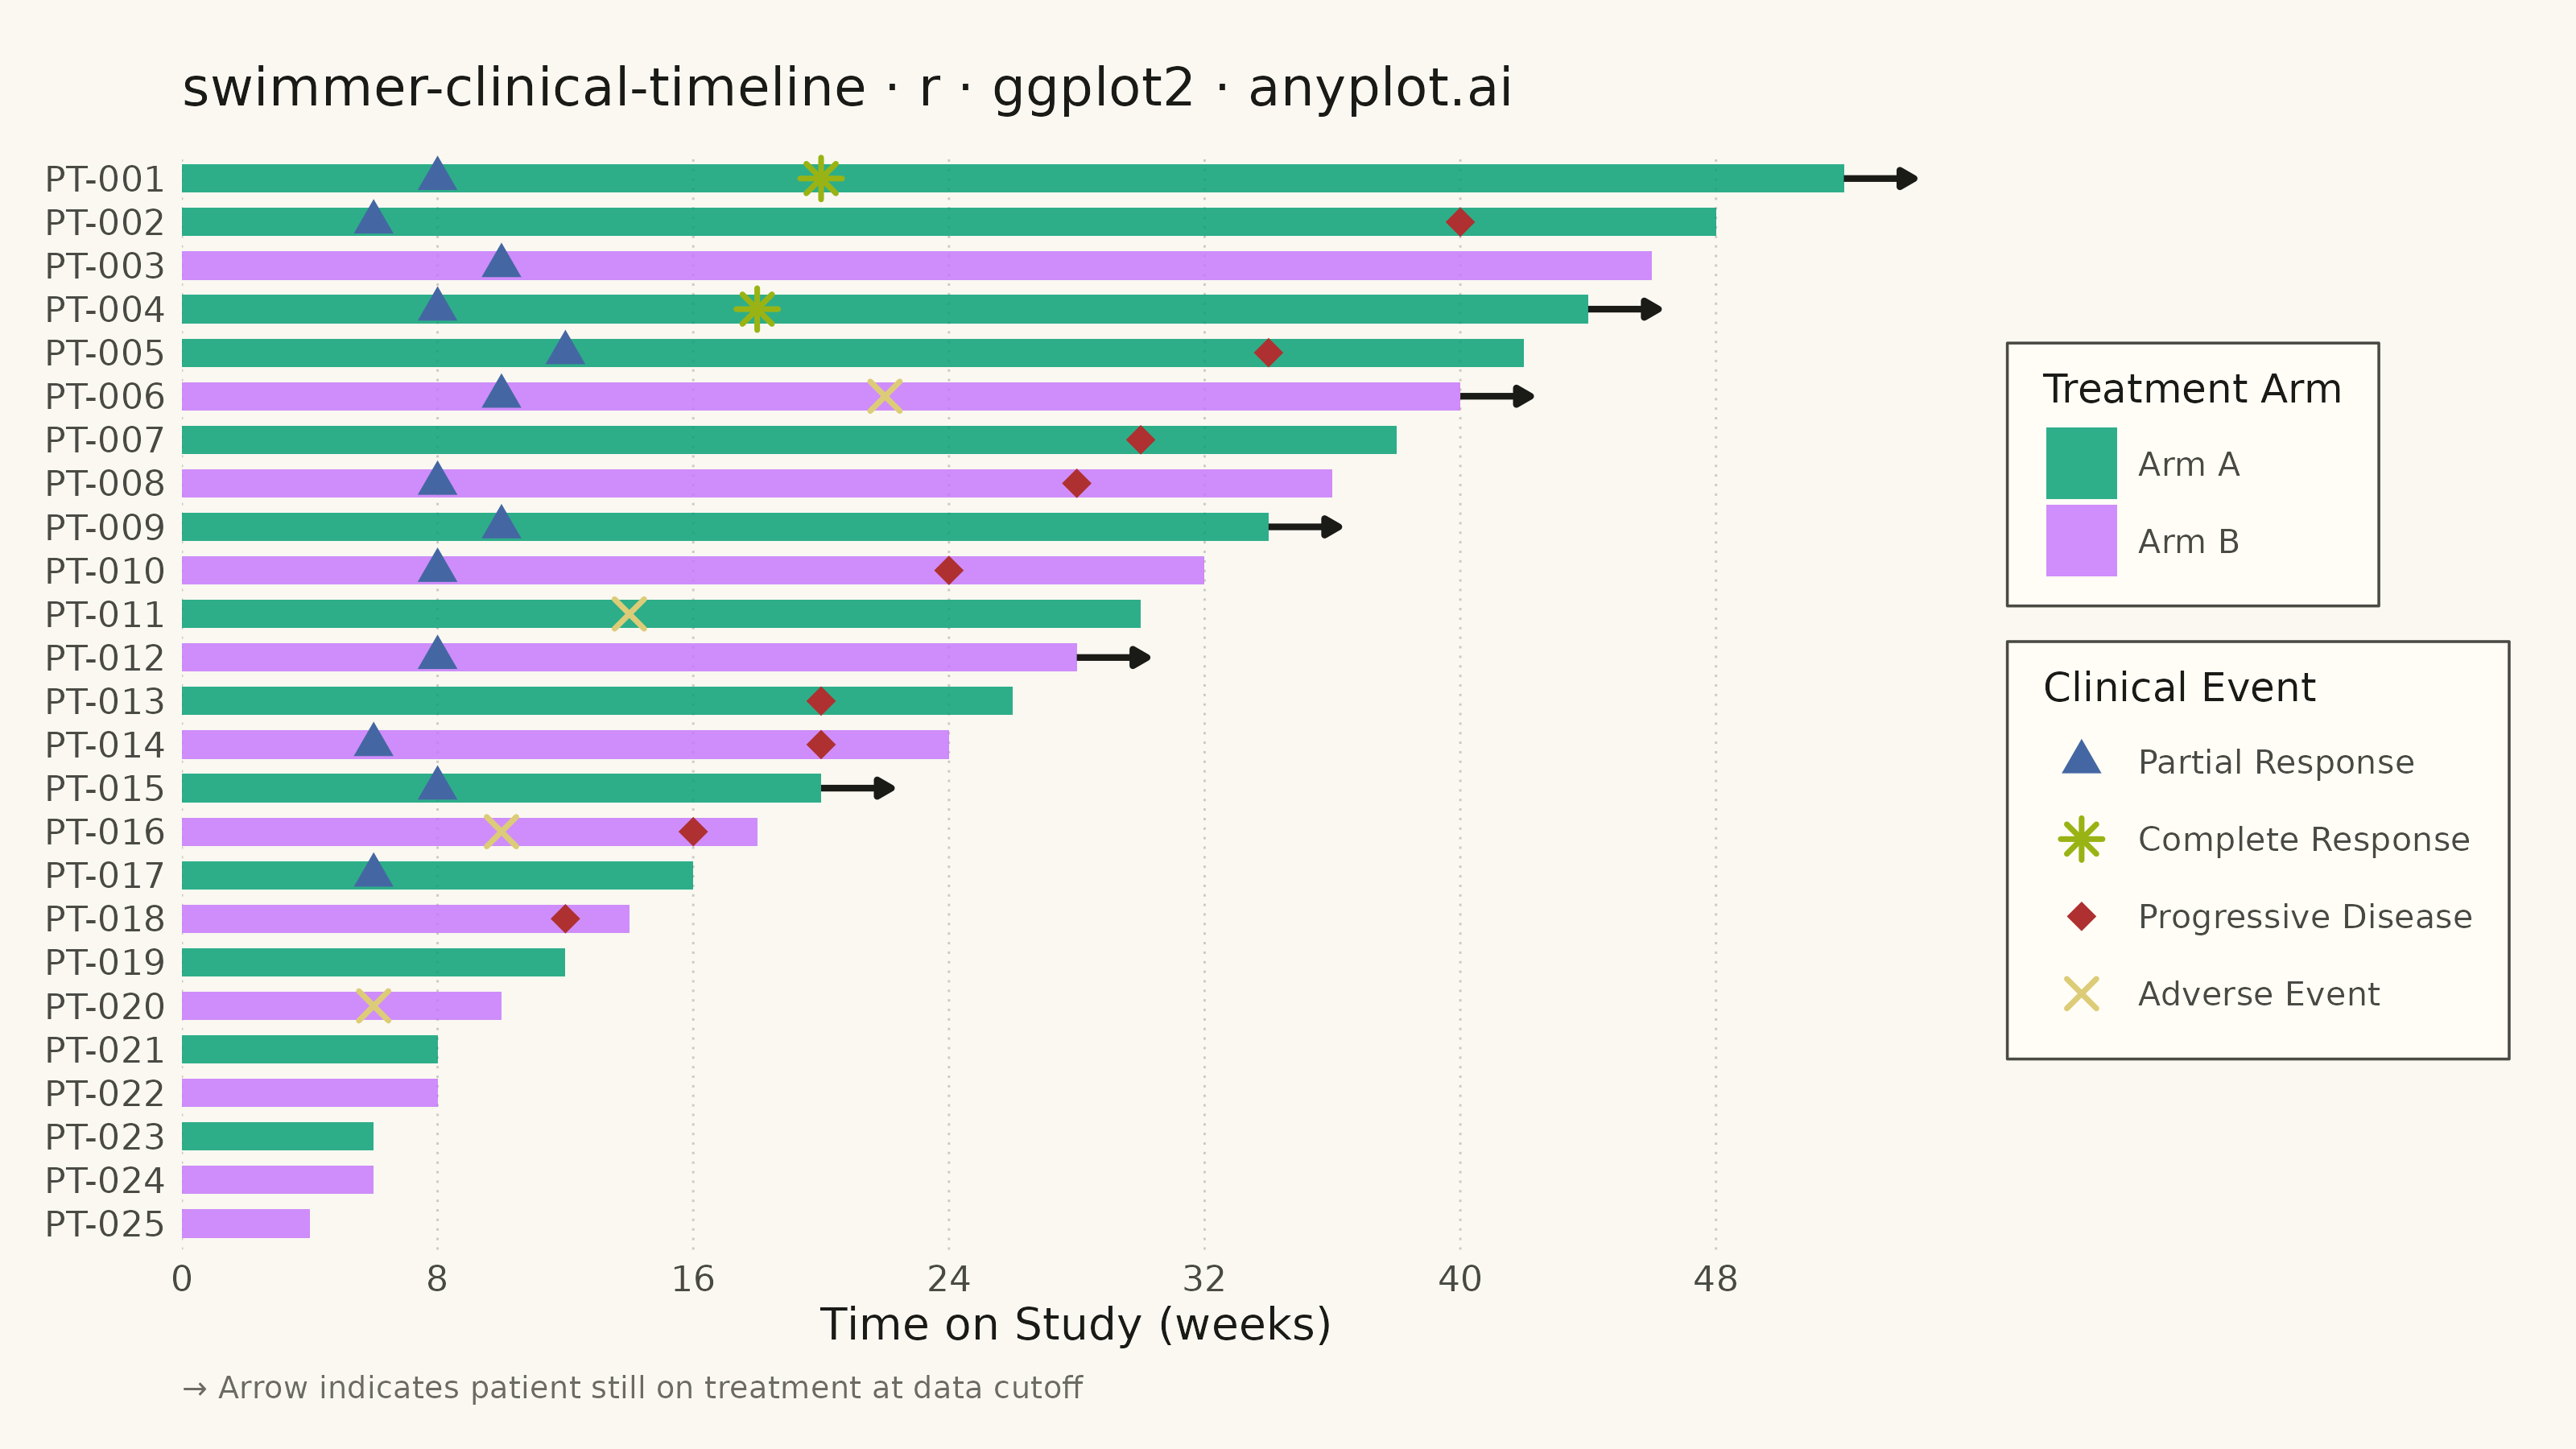
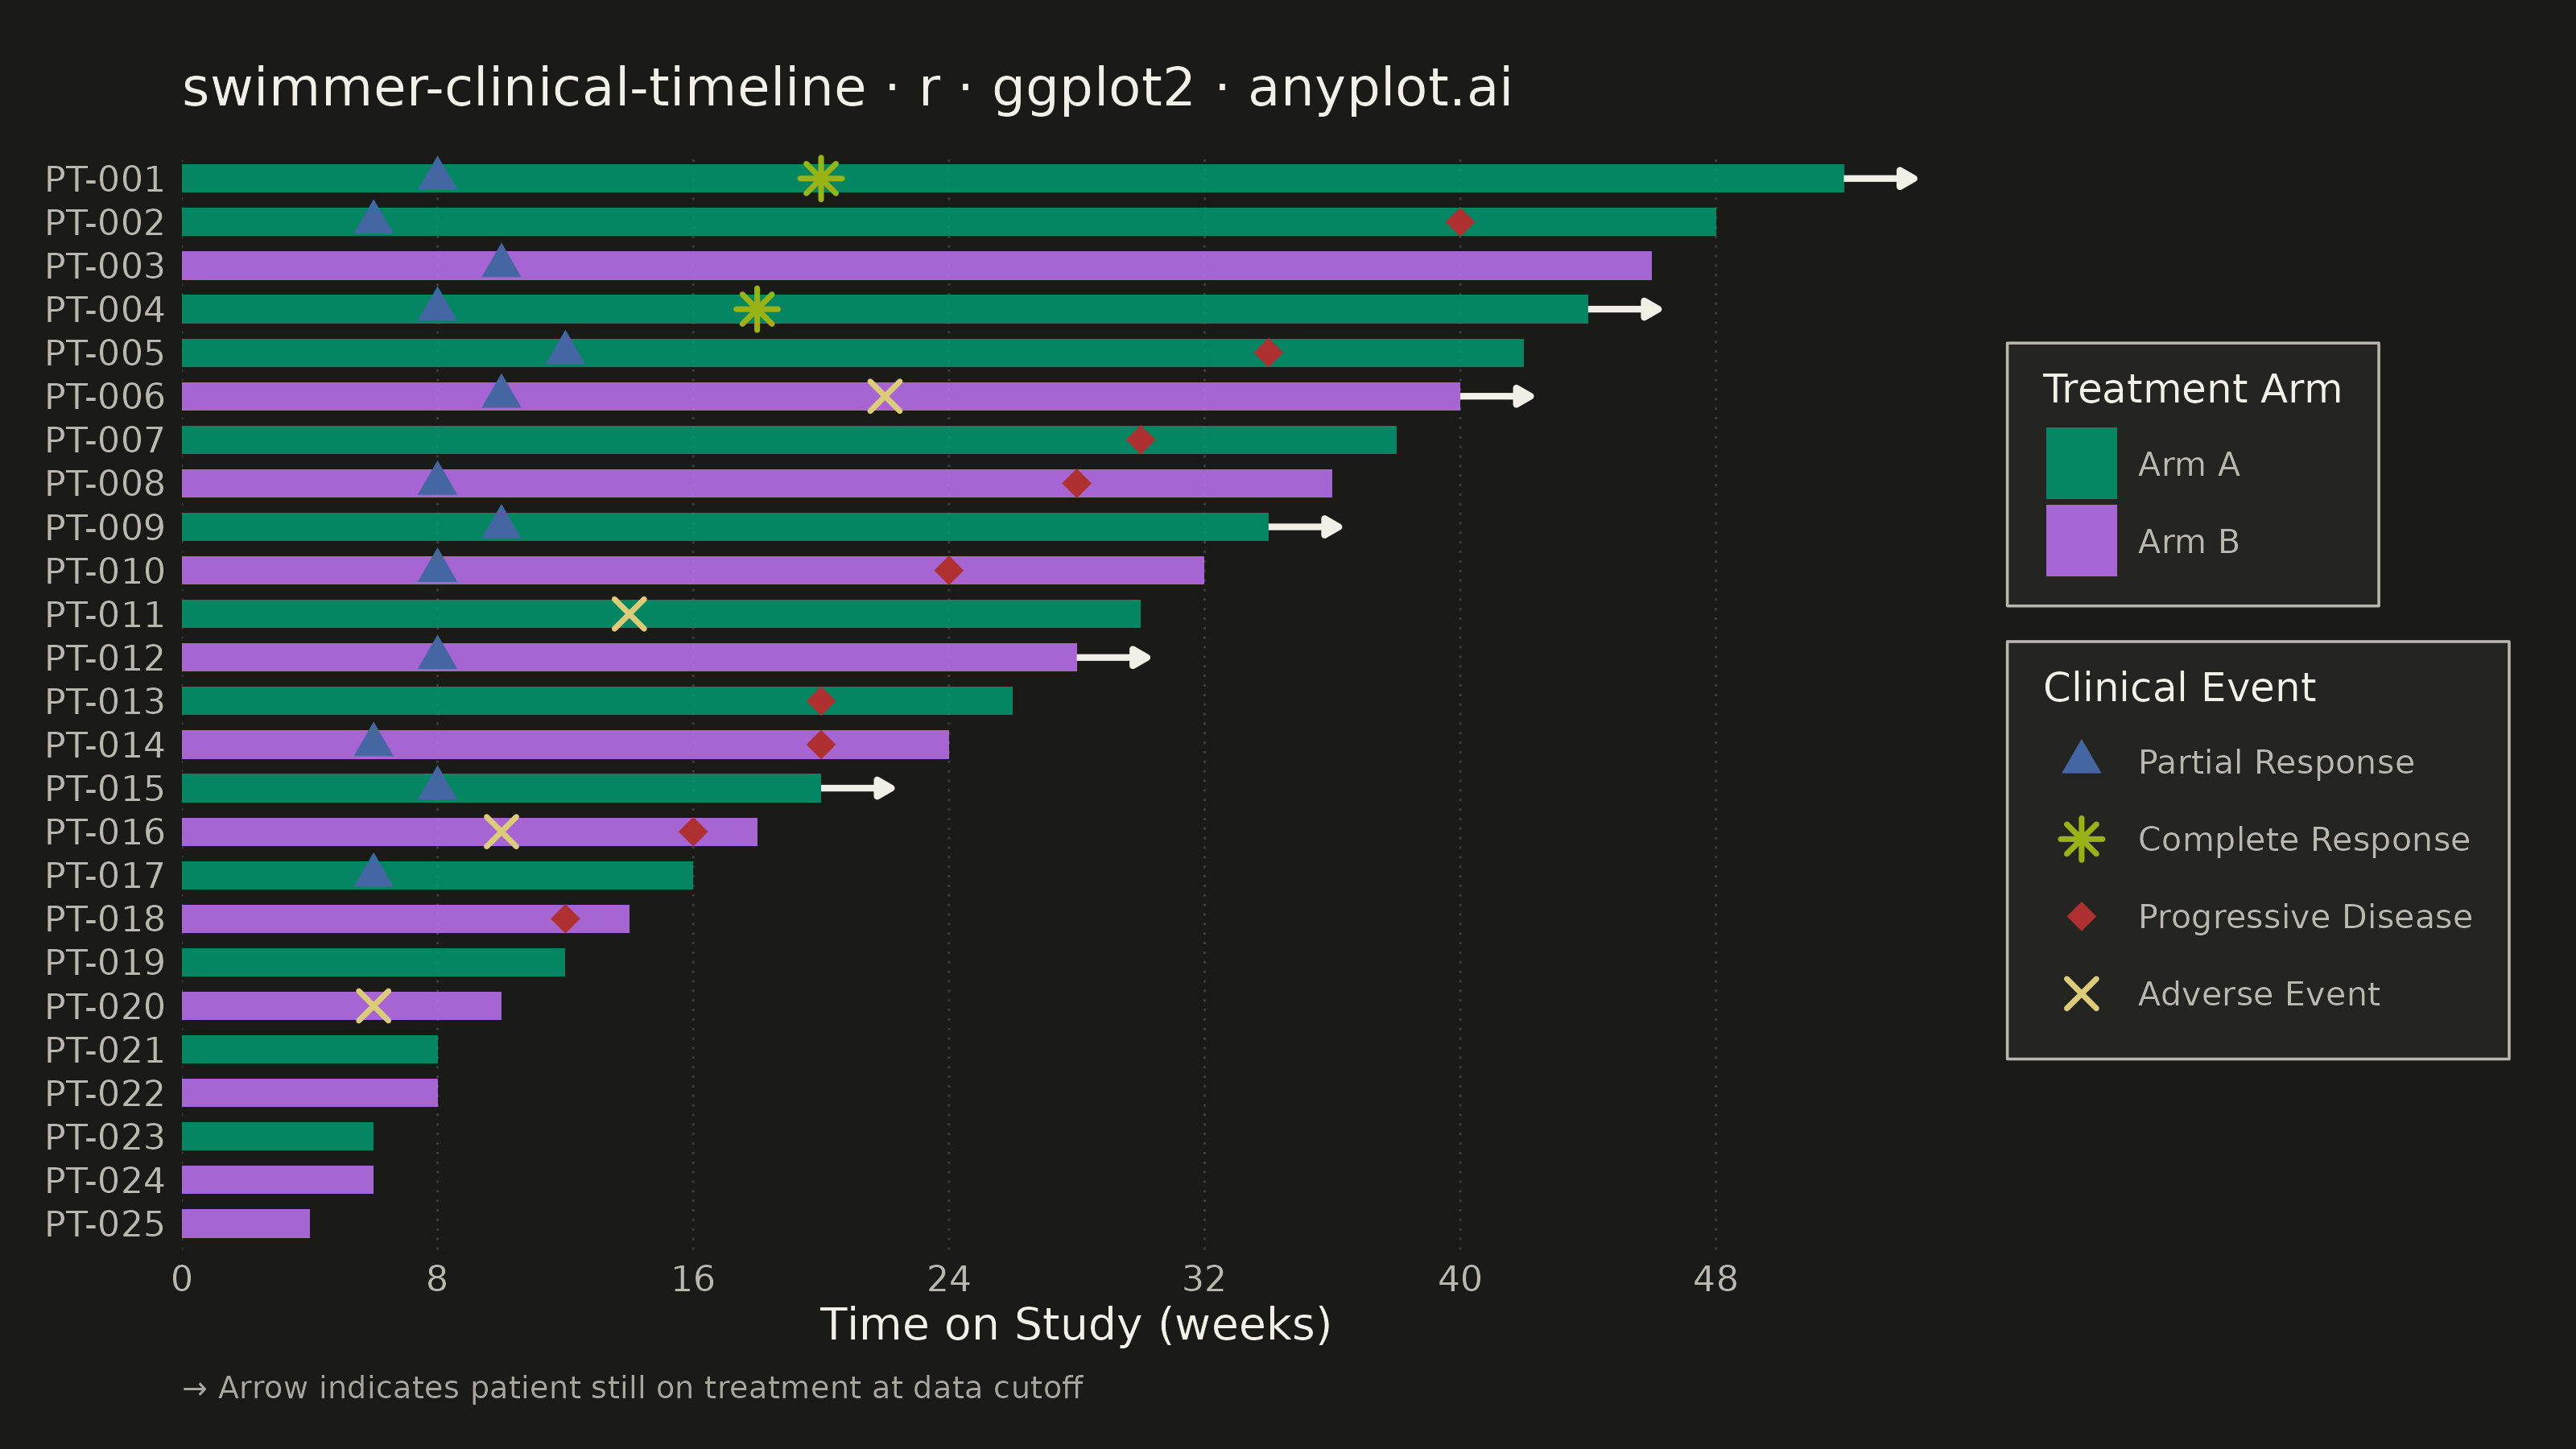
A swimmer plot displays individual patient timelines as horizontal bars, commonly used in clinical oncology to visualize treatment duration, response events, and disease progression across a study cohort. Each bar represents one patient, typically sorted by treatment duration, with symbols or color changes marking key clinical events such as partial response, complete response, or progressive disease. This plot is standard in clinical trial publications and regulatory submissions for conveying patient-level longitudinal outcomes at a glance.
#' anyplot.ai
#' swimmer-clinical-timeline: Swimmer Plot for Clinical Trial Timelines
#' Library: ggplot2 3.5.1 | R 4.4.1
#' Quality: 87/100 | Created: 2026-06-08

library(ggplot2)
library(dplyr)
library(tibble)
library(ragg)

# Theme tokens (Imprint palette — theme-adaptive chrome)
THEME       <- Sys.getenv("ANYPLOT_THEME", "light")
PAGE_BG     <- if (THEME == "light") "#FAF8F1" else "#1A1A17"
ELEVATED_BG <- if (THEME == "light") "#FFFDF6" else "#242420"
INK         <- if (THEME == "light") "#1A1A17" else "#F0EFE8"
INK_SOFT    <- if (THEME == "light") "#4A4A44" else "#B8B7B0"
INK_MUTED   <- if (THEME == "light") "#6B6A63" else "#A8A79F"
GRID_COLOR  <- if (THEME == "light") "#CCCAC2" else "#3D3D3A"

IMPRINT_PALETTE <- c(
  "#009E73", "#C475FD", "#4467A3", "#BD8233",
  "#AE3030", "#2ABCCD", "#954477", "#99B314"
)

# Data: Phase II oncology trial — 25 patients across two treatment arms
# Ordered by duration (descending) for the sorted swimmer layout
patients <- tibble(
  patient_id = sprintf("PT-%03d", 1:25),
  arm        = c(
    "Arm A", "Arm A", "Arm B", "Arm A", "Arm A",
    "Arm B", "Arm A", "Arm B", "Arm A", "Arm B",
    "Arm A", "Arm B", "Arm A", "Arm B", "Arm A",
    "Arm B", "Arm A", "Arm B", "Arm A", "Arm B",
    "Arm A", "Arm B", "Arm A", "Arm B", "Arm B"
  ),
  duration   = c(
    52, 48, 46, 44, 42,
    40, 38, 36, 34, 32,
    30, 28, 26, 24, 20,
    18, 16, 14, 12, 10,
     8,  8,  6,  6,  4
  ),
  ongoing    = c(
    TRUE,  FALSE, FALSE, TRUE,  FALSE,
    TRUE,  FALSE, FALSE, TRUE,  FALSE,
    FALSE, TRUE,  FALSE, FALSE, TRUE,
    FALSE, FALSE, FALSE, FALSE, FALSE,
    FALSE, FALSE, FALSE, FALSE, FALSE
  )
) %>%
  mutate(patient_id = factor(patient_id, levels = rev(patient_id)))

ongoing_pts <- patients %>% filter(ongoing)

# Clinical event annotations (event times are within each patient's duration)
events <- tibble(
  patient_id = c(
    "PT-001", "PT-001", "PT-002", "PT-002",
    "PT-003", "PT-004", "PT-004",
    "PT-005", "PT-005", "PT-006", "PT-006",
    "PT-007", "PT-008", "PT-008",
    "PT-009", "PT-010", "PT-010",
    "PT-011", "PT-012",
    "PT-013", "PT-014", "PT-014",
    "PT-015", "PT-016", "PT-016",
    "PT-017", "PT-018", "PT-020"
  ),
  time       = c(
     8, 20,  6, 40,
    10,  8, 18,
    12, 34, 10, 22,
    30,  8, 28,
    10,  8, 24,
    14,  8,
    20,  6, 20,
     8, 10, 16,
     6, 12,  6
  ),
  event_type = factor(c(
    "Partial Response",    "Complete Response",   "Partial Response",    "Progressive Disease",
    "Partial Response",    "Partial Response",    "Complete Response",
    "Partial Response",    "Progressive Disease", "Partial Response",    "Adverse Event",
    "Progressive Disease", "Partial Response",    "Progressive Disease",
    "Partial Response",    "Partial Response",    "Progressive Disease",
    "Adverse Event",       "Partial Response",
    "Progressive Disease", "Partial Response",    "Progressive Disease",
    "Partial Response",    "Adverse Event",       "Progressive Disease",
    "Partial Response",    "Progressive Disease", "Adverse Event"
  ), levels = c("Partial Response", "Complete Response", "Progressive Disease", "Adverse Event"))
) %>%
  mutate(patient_id = factor(patient_id, levels = levels(patients$patient_id)))

# Event visual encodings — Imprint palette positions (fixed, theme-independent)
event_colors <- c(
  "Partial Response"    = IMPRINT_PALETTE[3],  # blue
  "Complete Response"   = IMPRINT_PALETTE[8],  # lime
  "Progressive Disease" = IMPRINT_PALETTE[5],  # matte red
  "Adverse Event"       = "#DDCC77"             # amber warning anchor
)
event_shapes <- c(
  "Partial Response"    = 17L,  # solid triangle up
  "Complete Response"   =  8L,  # star / asterisk
  "Progressive Disease" = 18L,  # solid diamond
  "Adverse Event"       =  4L   # X / cross
)

# Plot
p <- ggplot() +
  # Treatment duration bars, colored by arm
  geom_col(
    data  = patients,
    aes(x = patient_id, y = duration, fill = arm),
    width = 0.65,
    alpha = 0.82
  ) +
  # Clinical event markers
  geom_point(
    data = events,
    aes(x = patient_id, y = time, shape = event_type, color = event_type),
    size   = 2.5,
    stroke = 0.9
  ) +
  # Arrows for patients still on treatment at data cutoff
  geom_segment(
    data        = ongoing_pts,
    aes(x = patient_id, xend = patient_id, y = duration, yend = duration + 2.2),
    arrow       = arrow(length = unit(0.13, "cm"), type = "closed"),
    color       = INK,
    linewidth   = 0.7,
    inherit.aes = FALSE
  ) +
  coord_flip() +
  scale_fill_manual(
    values = c("Arm A" = IMPRINT_PALETTE[1], "Arm B" = IMPRINT_PALETTE[2]),
    name   = "Treatment Arm"
  ) +
  scale_shape_manual(values = event_shapes, name = "Clinical Event") +
  scale_color_manual(values = event_colors, name = "Clinical Event") +
  scale_y_continuous(
    limits = c(0, 56),
    breaks = seq(0, 52, by = 8),
    expand = c(0, 0)
  ) +
  labs(
    title   = "swimmer-clinical-timeline · r · ggplot2 · anyplot.ai",
    x       = NULL,
    y       = "Time on Study (weeks)",
    caption = "→ Arrow indicates patient still on treatment at data cutoff"
  ) +
  theme_minimal(base_size = 8) +
  theme(
    plot.background    = element_rect(fill = PAGE_BG,     color = PAGE_BG),
    panel.background   = element_rect(fill = PAGE_BG,     color = NA),
    panel.grid.major.x = element_line(color = GRID_COLOR, linewidth = 0.25, linetype = "dotted"),
    panel.grid.major.y = element_blank(),
    panel.grid.minor   = element_blank(),
    axis.title.x       = element_text(color = INK,        size = 10),
    axis.text.x        = element_text(color = INK_SOFT,   size = 8),
    axis.text.y        = element_text(color = INK_SOFT,   size = 8),
    plot.title         = element_text(color = INK,        size = 12,
                                      margin = margin(b = 8)),
    plot.caption       = element_text(color = INK_MUTED,  size = 7,
                                      hjust = 0, margin = margin(t = 6)),
    legend.background  = element_rect(fill = ELEVATED_BG, color = INK_SOFT,
                                      linewidth = 0.3),
    legend.text        = element_text(color = INK_SOFT,   size = 7.5),
    legend.title       = element_text(color = INK,        size = 9),
    legend.key         = element_rect(fill = ELEVATED_BG, color = NA),
    legend.position    = "right",
    legend.margin      = margin(6, 8, 6, 8),
    plot.margin        = margin(15, 15, 10, 10)
  )

# Save (ragg device — no Cairo dependency)
ggsave(
  filename = sprintf("plot-%s.png", THEME),
  plot     = p,
  device   = ragg::agg_png,
  width    = 8,
  height   = 4.5,
  units    = "in",
  dpi      = 400
)
Runnable source as JSON, for any HTTP client: https://api.anyplot.ai/specs/swimmer-clinical-timeline/ggplot2/code. Any spec id and library id listed in llms-full.txt fit the same URL shape; every URL below is complete and callable.
{
  "spec_id": "swimmer-clinical-timeline",
  "language": "r",
  "library": "ggplot2",
  "page": "https://anyplot.ai/swimmer-clinical-timeline/r/ggplot2",
  "hub": "https://anyplot.ai/swimmer-clinical-timeline",
  "code_json": "https://api.anyplot.ai/specs/swimmer-clinical-timeline/ggplot2/code",
  "spec_json": "https://api.anyplot.ai/specs/swimmer-clinical-timeline",
  "render_light_png": "https://storage.googleapis.com/anyplot-images/plots/swimmer-clinical-timeline/r/ggplot2/plot-light.png",
  "render_dark_png": "https://storage.googleapis.com/anyplot-images/plots/swimmer-clinical-timeline/r/ggplot2/plot-dark.png",
  "quality_score": 87.0,
  "license": "MIT",
  "guide": "https://anyplot.ai/llms.txt"
}
Part of Swimmer Plot for Clinical Trial Timelines on anyplot.ai.