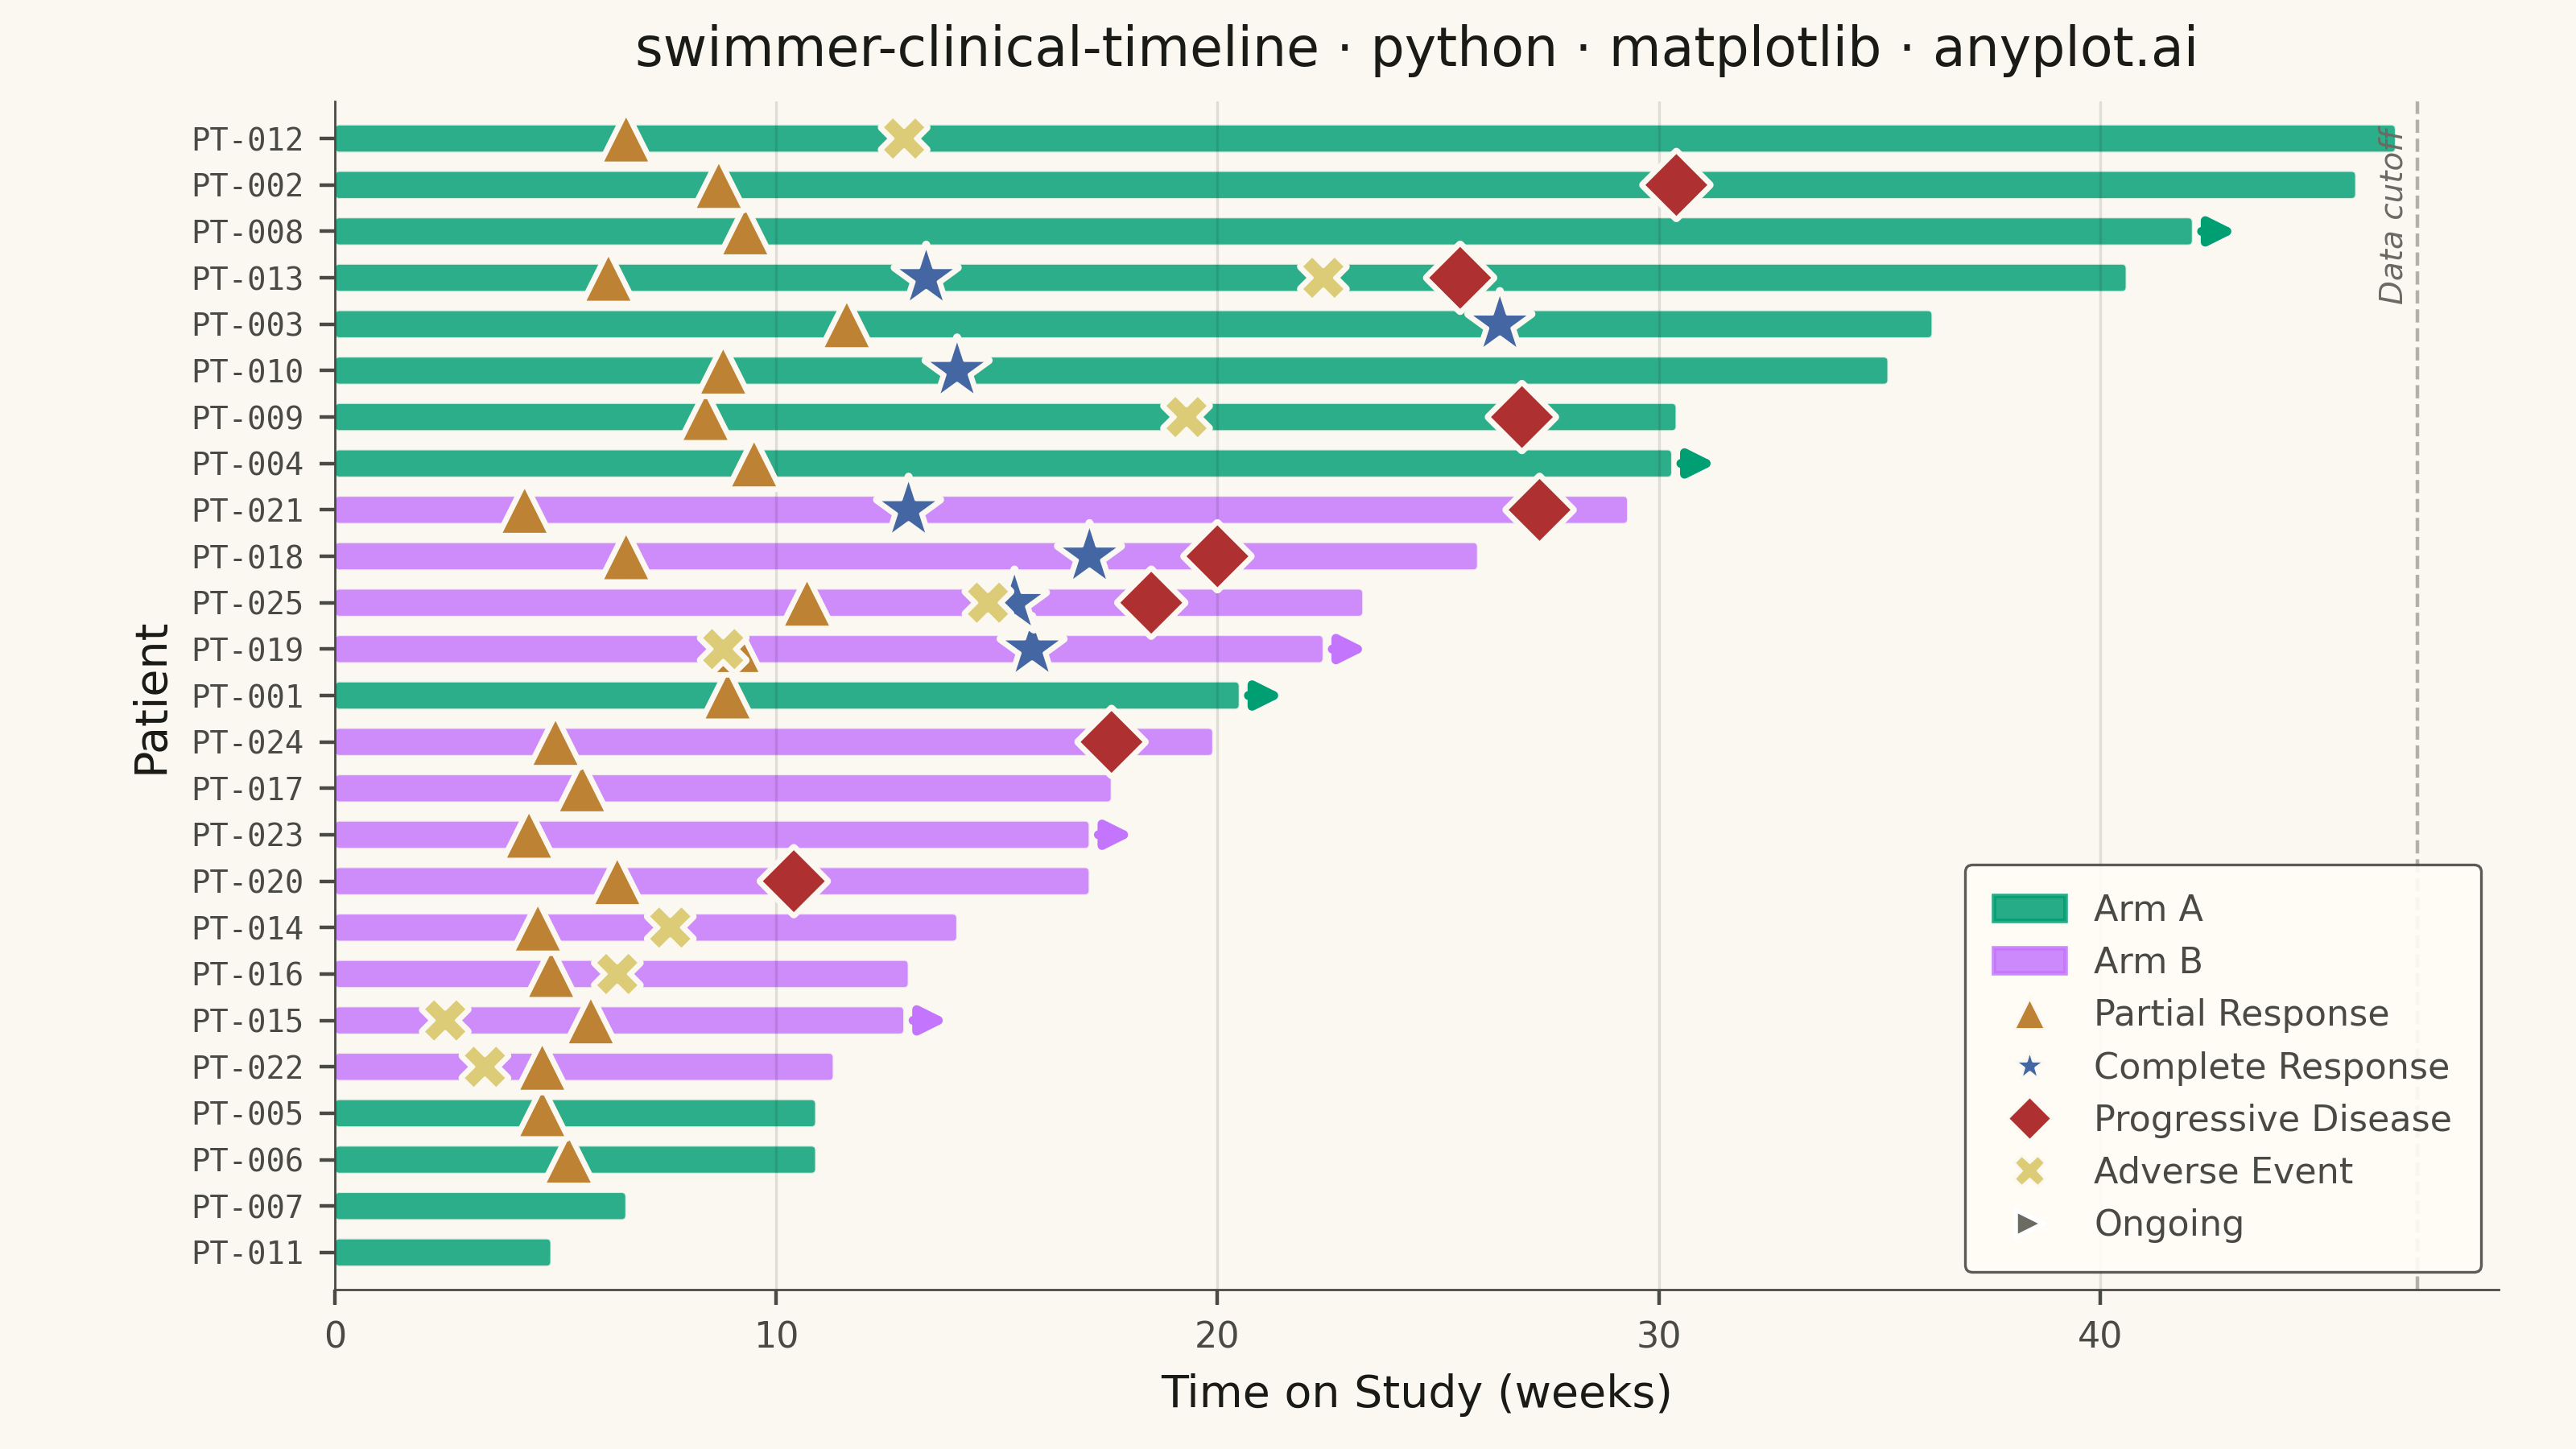
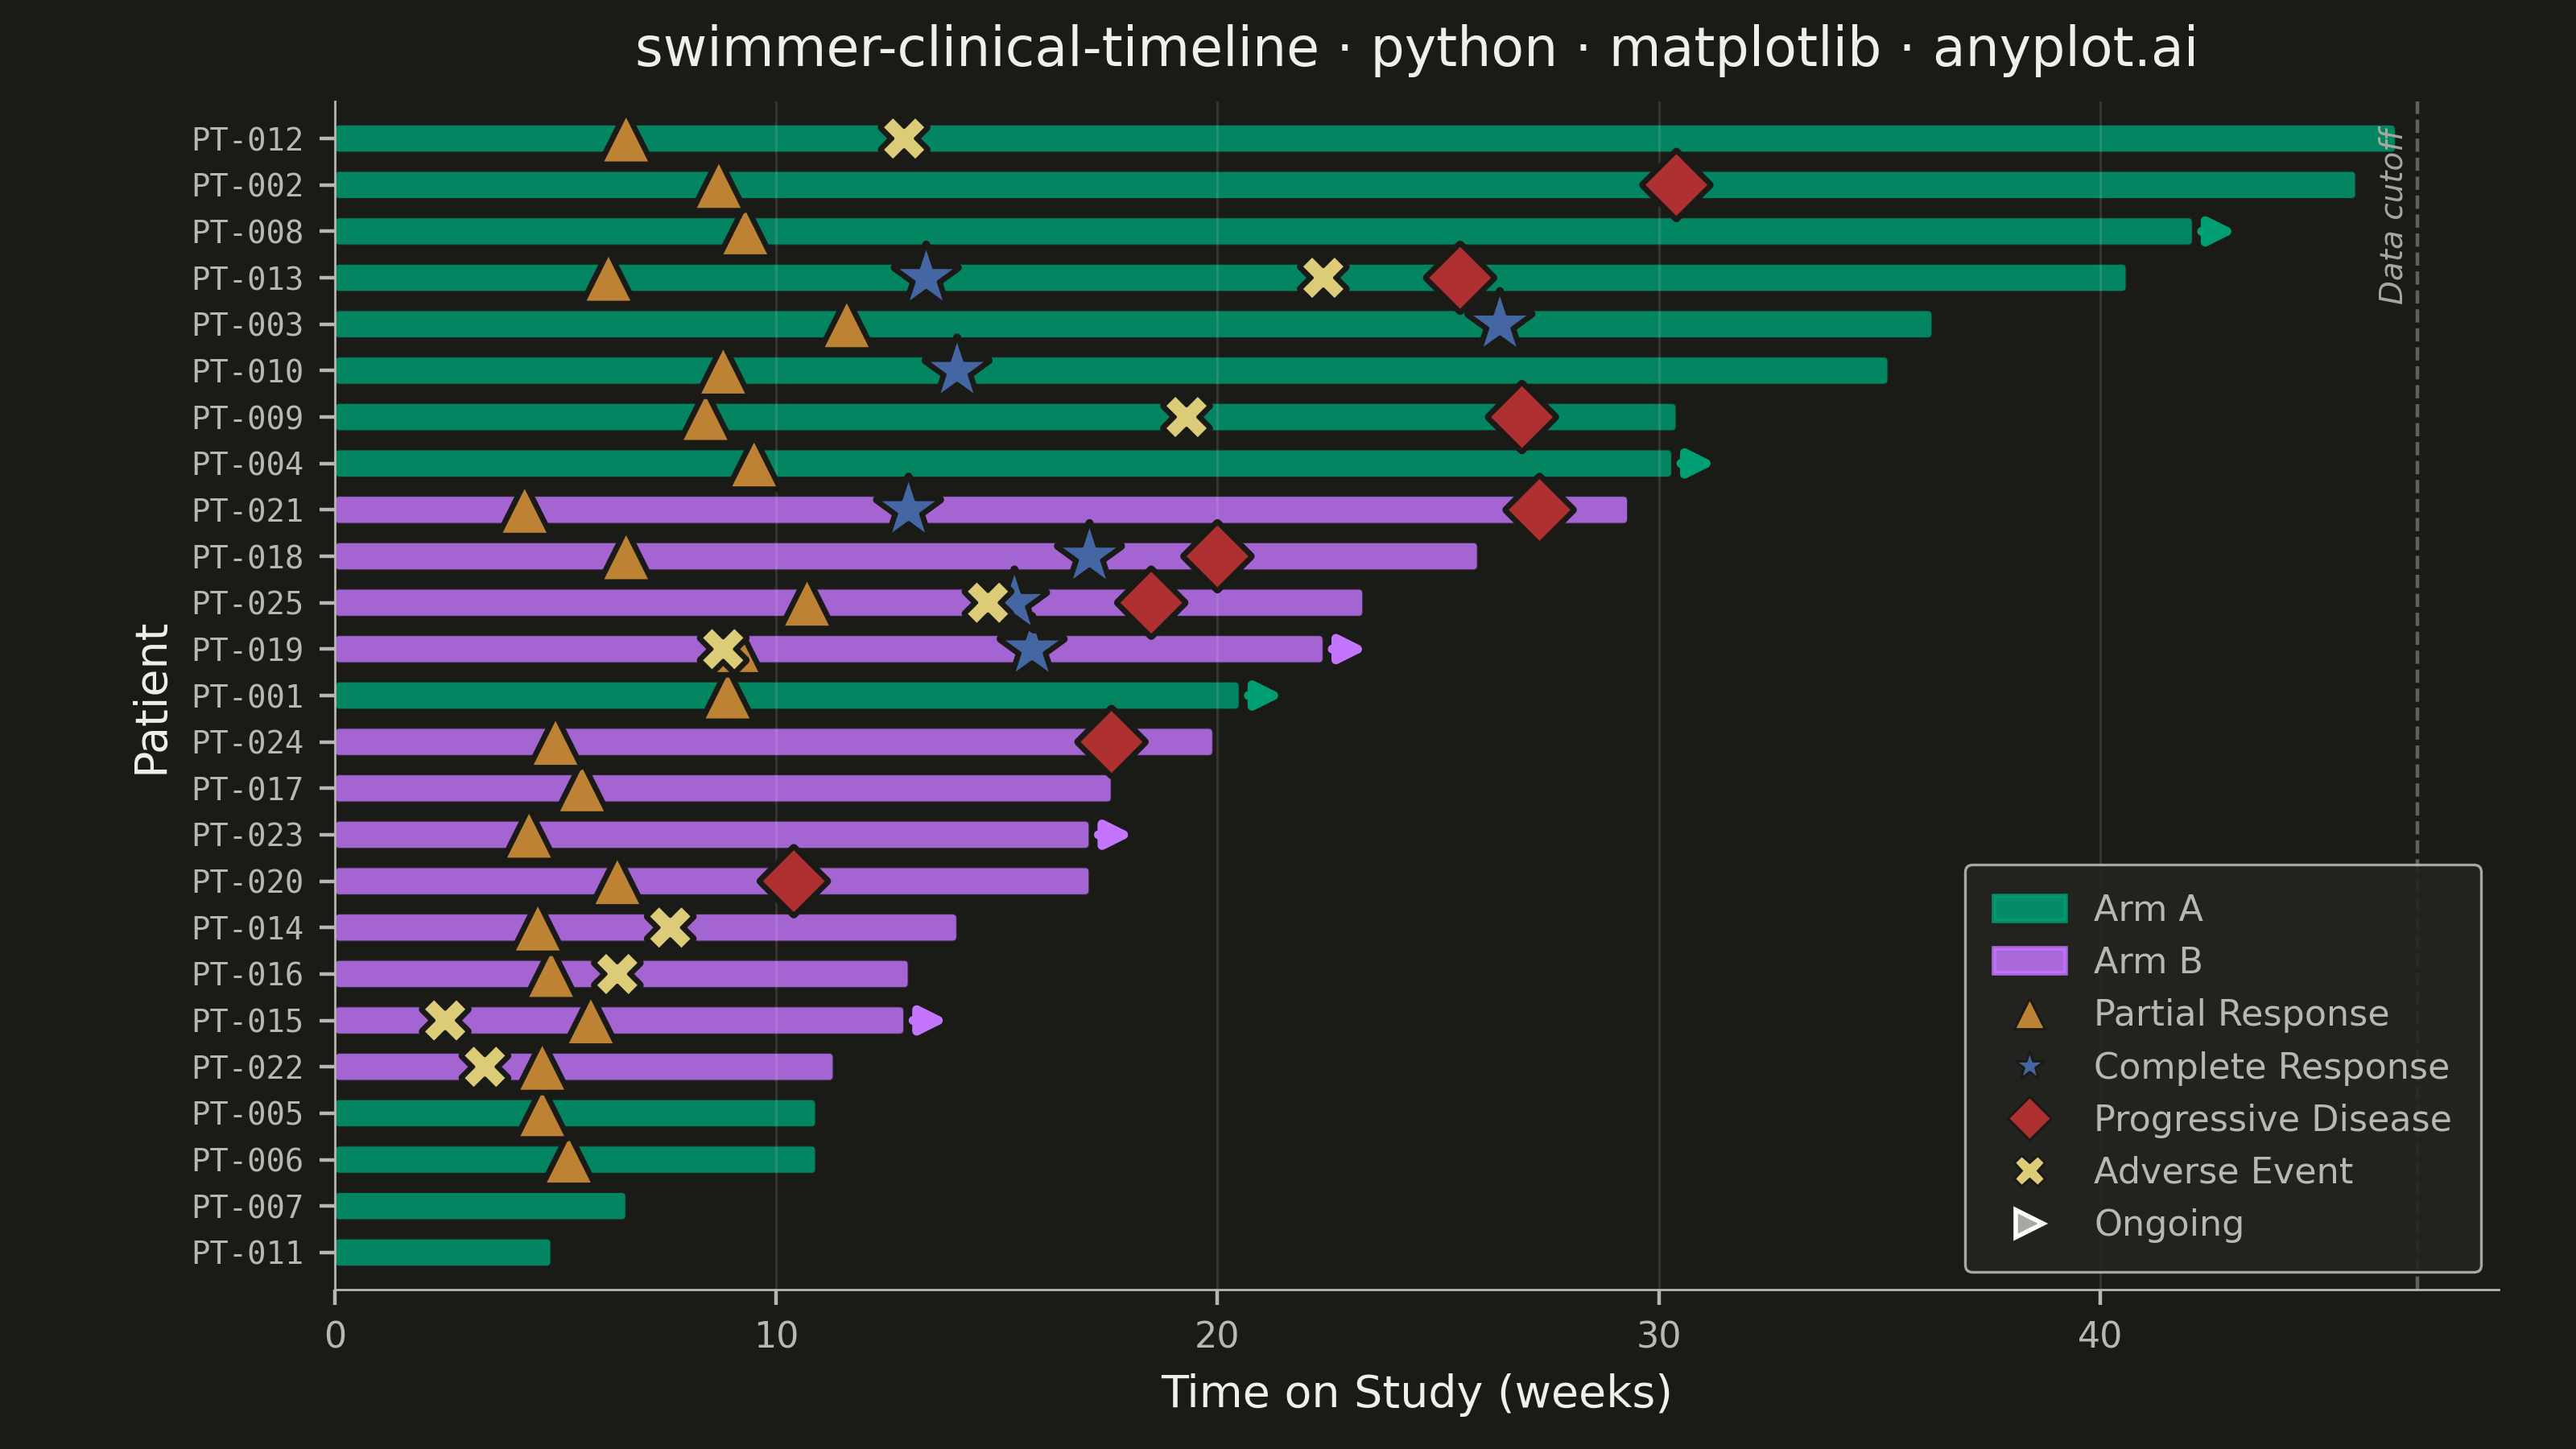
A swimmer plot displays individual patient timelines as horizontal bars, commonly used in clinical oncology to visualize treatment duration, response events, and disease progression across a study cohort. Each bar represents one patient, typically sorted by treatment duration, with symbols or color changes marking key clinical events such as partial response, complete response, or progressive disease. This plot is standard in clinical trial publications and regulatory submissions for conveying patient-level longitudinal outcomes at a glance.
""" anyplot.ai
swimmer-clinical-timeline: Swimmer Plot for Clinical Trial Timelines
Library: matplotlib 3.10.9 | Python 3.13.13
Quality: 90/100 | Updated: 2026-06-08
"""

import os

import matplotlib.patches as mpatches
import matplotlib.patheffects as pe
import matplotlib.pyplot as plt
import numpy as np


# Theme tokens — Imprint palette chrome mapping
THEME = os.getenv("ANYPLOT_THEME", "light")
PAGE_BG = "#FAF8F1" if THEME == "light" else "#1A1A17"
ELEVATED_BG = "#FFFDF6" if THEME == "light" else "#242420"
INK = "#1A1A17" if THEME == "light" else "#F0EFE8"
INK_SOFT = "#4A4A44" if THEME == "light" else "#B8B7B0"
INK_MUTED = "#6B6A63" if THEME == "light" else "#A8A79F"

# Imprint categorical palette — 8 hues, canonical order
IMPRINT_PALETTE = ["#009E73", "#C475FD", "#4467A3", "#BD8233", "#AE3030", "#2ABCCD", "#954477", "#99B314"]
ANYPLOT_AMBER = "#DDCC77"  # semantic anchor: warning / caution

# Data — Phase II oncology trial: 25 patients across Arm A (n=13) and Arm B (n=12)
np.random.seed(42)

n_patients = 25
patient_ids = [f"PT-{i + 1:03d}" for i in range(n_patients)]
arms = np.array(["Arm A"] * 13 + ["Arm B"] * 12)
durations = np.concatenate([np.random.uniform(4, 48, 13), np.random.uniform(6, 44, 12)])
durations = np.round(durations, 1)

ongoing = np.array([False] * n_patients)
for idx in [0, 3, 7, 14, 18, 22]:
    ongoing[idx] = True

event_markers = {
    "partial_response": ("^", IMPRINT_PALETTE[3], "Partial Response", 120),
    "complete_response": ("*", IMPRINT_PALETTE[2], "Complete Response", 220),
    "progressive_disease": ("D", IMPRINT_PALETTE[4], "Progressive Disease", 110),
    "adverse_event": ("X", ANYPLOT_AMBER, "Adverse Event", 100),
}

events = []
for i in range(n_patients):
    patient_events = []
    dur = durations[i]
    if dur > 8:
        pr_time = np.random.uniform(4, min(dur * 0.5, 12))
        patient_events.append(("partial_response", round(pr_time, 1)))
        if dur > 20 and np.random.random() > 0.5:
            cr_time = np.random.uniform(pr_time + 4, min(dur * 0.8, dur - 2))
            patient_events.append(("complete_response", round(cr_time, 1)))
    if not ongoing[i] and dur > 12 and np.random.random() > 0.4:
        pd_time = np.random.uniform(dur * 0.6, dur - 1)
        patient_events.append(("progressive_disease", round(pd_time, 1)))
    if dur > 10 and np.random.random() > 0.75:
        ae_time = np.random.uniform(2, min(dur * 0.7, dur - 1))
        patient_events.append(("adverse_event", round(ae_time, 1)))
    events.append(patient_events)

sort_idx = np.argsort(durations)
patient_ids = [patient_ids[i] for i in sort_idx]
durations = durations[sort_idx]
arms = arms[sort_idx]
ongoing = ongoing[sort_idx]
events = [events[i] for i in sort_idx]

# Arm colors — Imprint positions 1 (brand green) and 2 (lavender)
arm_colors = {"Arm A": IMPRINT_PALETTE[0], "Arm B": IMPRINT_PALETTE[1]}

# Plot — landscape 3200×1800 px (figsize=(8,4.5) × dpi=400)
fig, ax = plt.subplots(figsize=(8, 4.5), dpi=400, facecolor=PAGE_BG)
ax.set_facecolor(PAGE_BG)

for i in range(n_patients):
    color = arm_colors[arms[i]]
    rect = mpatches.FancyBboxPatch(
        (0, i - 0.3),
        durations[i],
        0.6,
        boxstyle=mpatches.BoxStyle.Round(pad=0, rounding_size=0.1),
        facecolor=color,
        alpha=0.82,
        edgecolor=PAGE_BG,
        linewidth=0.4,
    )
    ax.add_patch(rect)

    if ongoing[i]:
        ax.annotate(
            "",
            xy=(durations[i] + 1.2, i),
            xytext=(durations[i], i),
            arrowprops={"arrowstyle": "-|>", "color": color, "lw": 2.0, "mutation_scale": 12},
        )

    for event_type, event_time in events[i]:
        marker, mcolor, _, msize = event_markers[event_type]
        ax.scatter(
            event_time,
            i,
            marker=marker,
            color=mcolor,
            s=msize,
            zorder=5,
            edgecolors=PAGE_BG,
            linewidth=0.7,
            path_effects=[pe.withStroke(linewidth=1.8, foreground=PAGE_BG)],
        )

# Data cutoff line
max_dur = durations.max()
ax.axvline(x=max_dur + 0.5, color=INK_MUTED, linestyle="--", linewidth=0.8, alpha=0.5)
ax.text(
    max_dur + 0.3,
    n_patients - 0.8,
    "Data cutoff",
    fontsize=7,
    color=INK_MUTED,
    ha="right",
    va="top",
    fontstyle="italic",
    rotation=90,
)

# Style
title = "swimmer-clinical-timeline · python · matplotlib · anyplot.ai"
n_chars = len(title)
title_fontsize = max(8, round(12 * 67 / n_chars)) if n_chars > 67 else 12

ax.set_yticks(range(n_patients))
ax.set_yticklabels(patient_ids, fontsize=7, fontfamily="monospace")
ax.set_xlabel("Time on Study (weeks)", fontsize=10, color=INK)
ax.set_ylabel("Patient", fontsize=10, color=INK)
ax.set_title(title, fontsize=title_fontsize, fontweight="medium", color=INK, pad=8)
ax.tick_params(axis="x", labelsize=8, colors=INK_SOFT, labelcolor=INK_SOFT)
ax.tick_params(axis="y", labelsize=7, colors=INK_SOFT, labelcolor=INK_SOFT)
ax.spines["top"].set_visible(False)
ax.spines["right"].set_visible(False)
for s in ("left", "bottom"):
    ax.spines[s].set_color(INK_SOFT)
    ax.spines[s].set_linewidth(0.5)
ax.xaxis.grid(True, alpha=0.12, linewidth=0.6, color=INK)
ax.set_xlim(0, None)
ax.set_ylim(-0.8, n_patients - 0.2)

# Legend
arm_a_patch = mpatches.Patch(color=arm_colors["Arm A"], alpha=0.85, label="Arm A")
arm_b_patch = mpatches.Patch(color=arm_colors["Arm B"], alpha=0.85, label="Arm B")
legend_handles = [arm_a_patch, arm_b_patch]
for _etype, (marker, mcolor, label, _) in event_markers.items():
    legend_handles.append(
        plt.Line2D(
            [0],
            [0],
            marker=marker,
            color="w",
            markerfacecolor=mcolor,
            markersize=7,
            label=label,
            markeredgecolor=PAGE_BG,
            markeredgewidth=0.5,
            linestyle="None",
        )
    )
legend_handles.append(
    plt.Line2D(
        [0], [0], marker=">", color="w", markerfacecolor=INK_MUTED, markersize=6, label="Ongoing", linestyle="None"
    )
)

leg = ax.legend(handles=legend_handles, fontsize=8, loc="lower right", framealpha=0.9, borderpad=0.8)
leg.get_frame().set_facecolor(ELEVATED_BG)
leg.get_frame().set_edgecolor(INK_SOFT)
leg.get_frame().set_linewidth(0.6)
plt.setp(leg.get_texts(), color=INK_SOFT)

fig.subplots_adjust(left=0.13, right=0.97, top=0.93, bottom=0.11)
plt.savefig(f"plot-{THEME}.png", dpi=400, facecolor=PAGE_BG)
Runnable source as JSON, for any HTTP client: https://api.anyplot.ai/specs/swimmer-clinical-timeline/matplotlib/code. Any spec id and library id listed in llms-full.txt fit the same URL shape; every URL below is complete and callable.
{
  "spec_id": "swimmer-clinical-timeline",
  "language": "python",
  "library": "matplotlib",
  "page": "https://anyplot.ai/swimmer-clinical-timeline/python/matplotlib",
  "hub": "https://anyplot.ai/swimmer-clinical-timeline",
  "code_json": "https://api.anyplot.ai/specs/swimmer-clinical-timeline/matplotlib/code",
  "spec_json": "https://api.anyplot.ai/specs/swimmer-clinical-timeline",
  "render_light_png": "https://storage.googleapis.com/anyplot-images/plots/swimmer-clinical-timeline/python/matplotlib/plot-light.png",
  "render_dark_png": "https://storage.googleapis.com/anyplot-images/plots/swimmer-clinical-timeline/python/matplotlib/plot-dark.png",
  "quality_score": 90.0,
  "license": "MIT",
  "guide": "https://anyplot.ai/llms.txt"
}
Part of Swimmer Plot for Clinical Trial Timelines on anyplot.ai.