The same plot in 14 other libraries — JavaScript: Chart.js, Apache ECharts, Highcharts, MUI X Charts; Python: Altair, Bokeh, lets-plot, Matplotlib, Plotly, plotnine, Pygal, Seaborn; R: ggplot2; Julia: Makie.jl. Compare all 15 side by side: Swimmer Plot for Clinical Trial Timelines in Python, R, Julia and JavaScript.
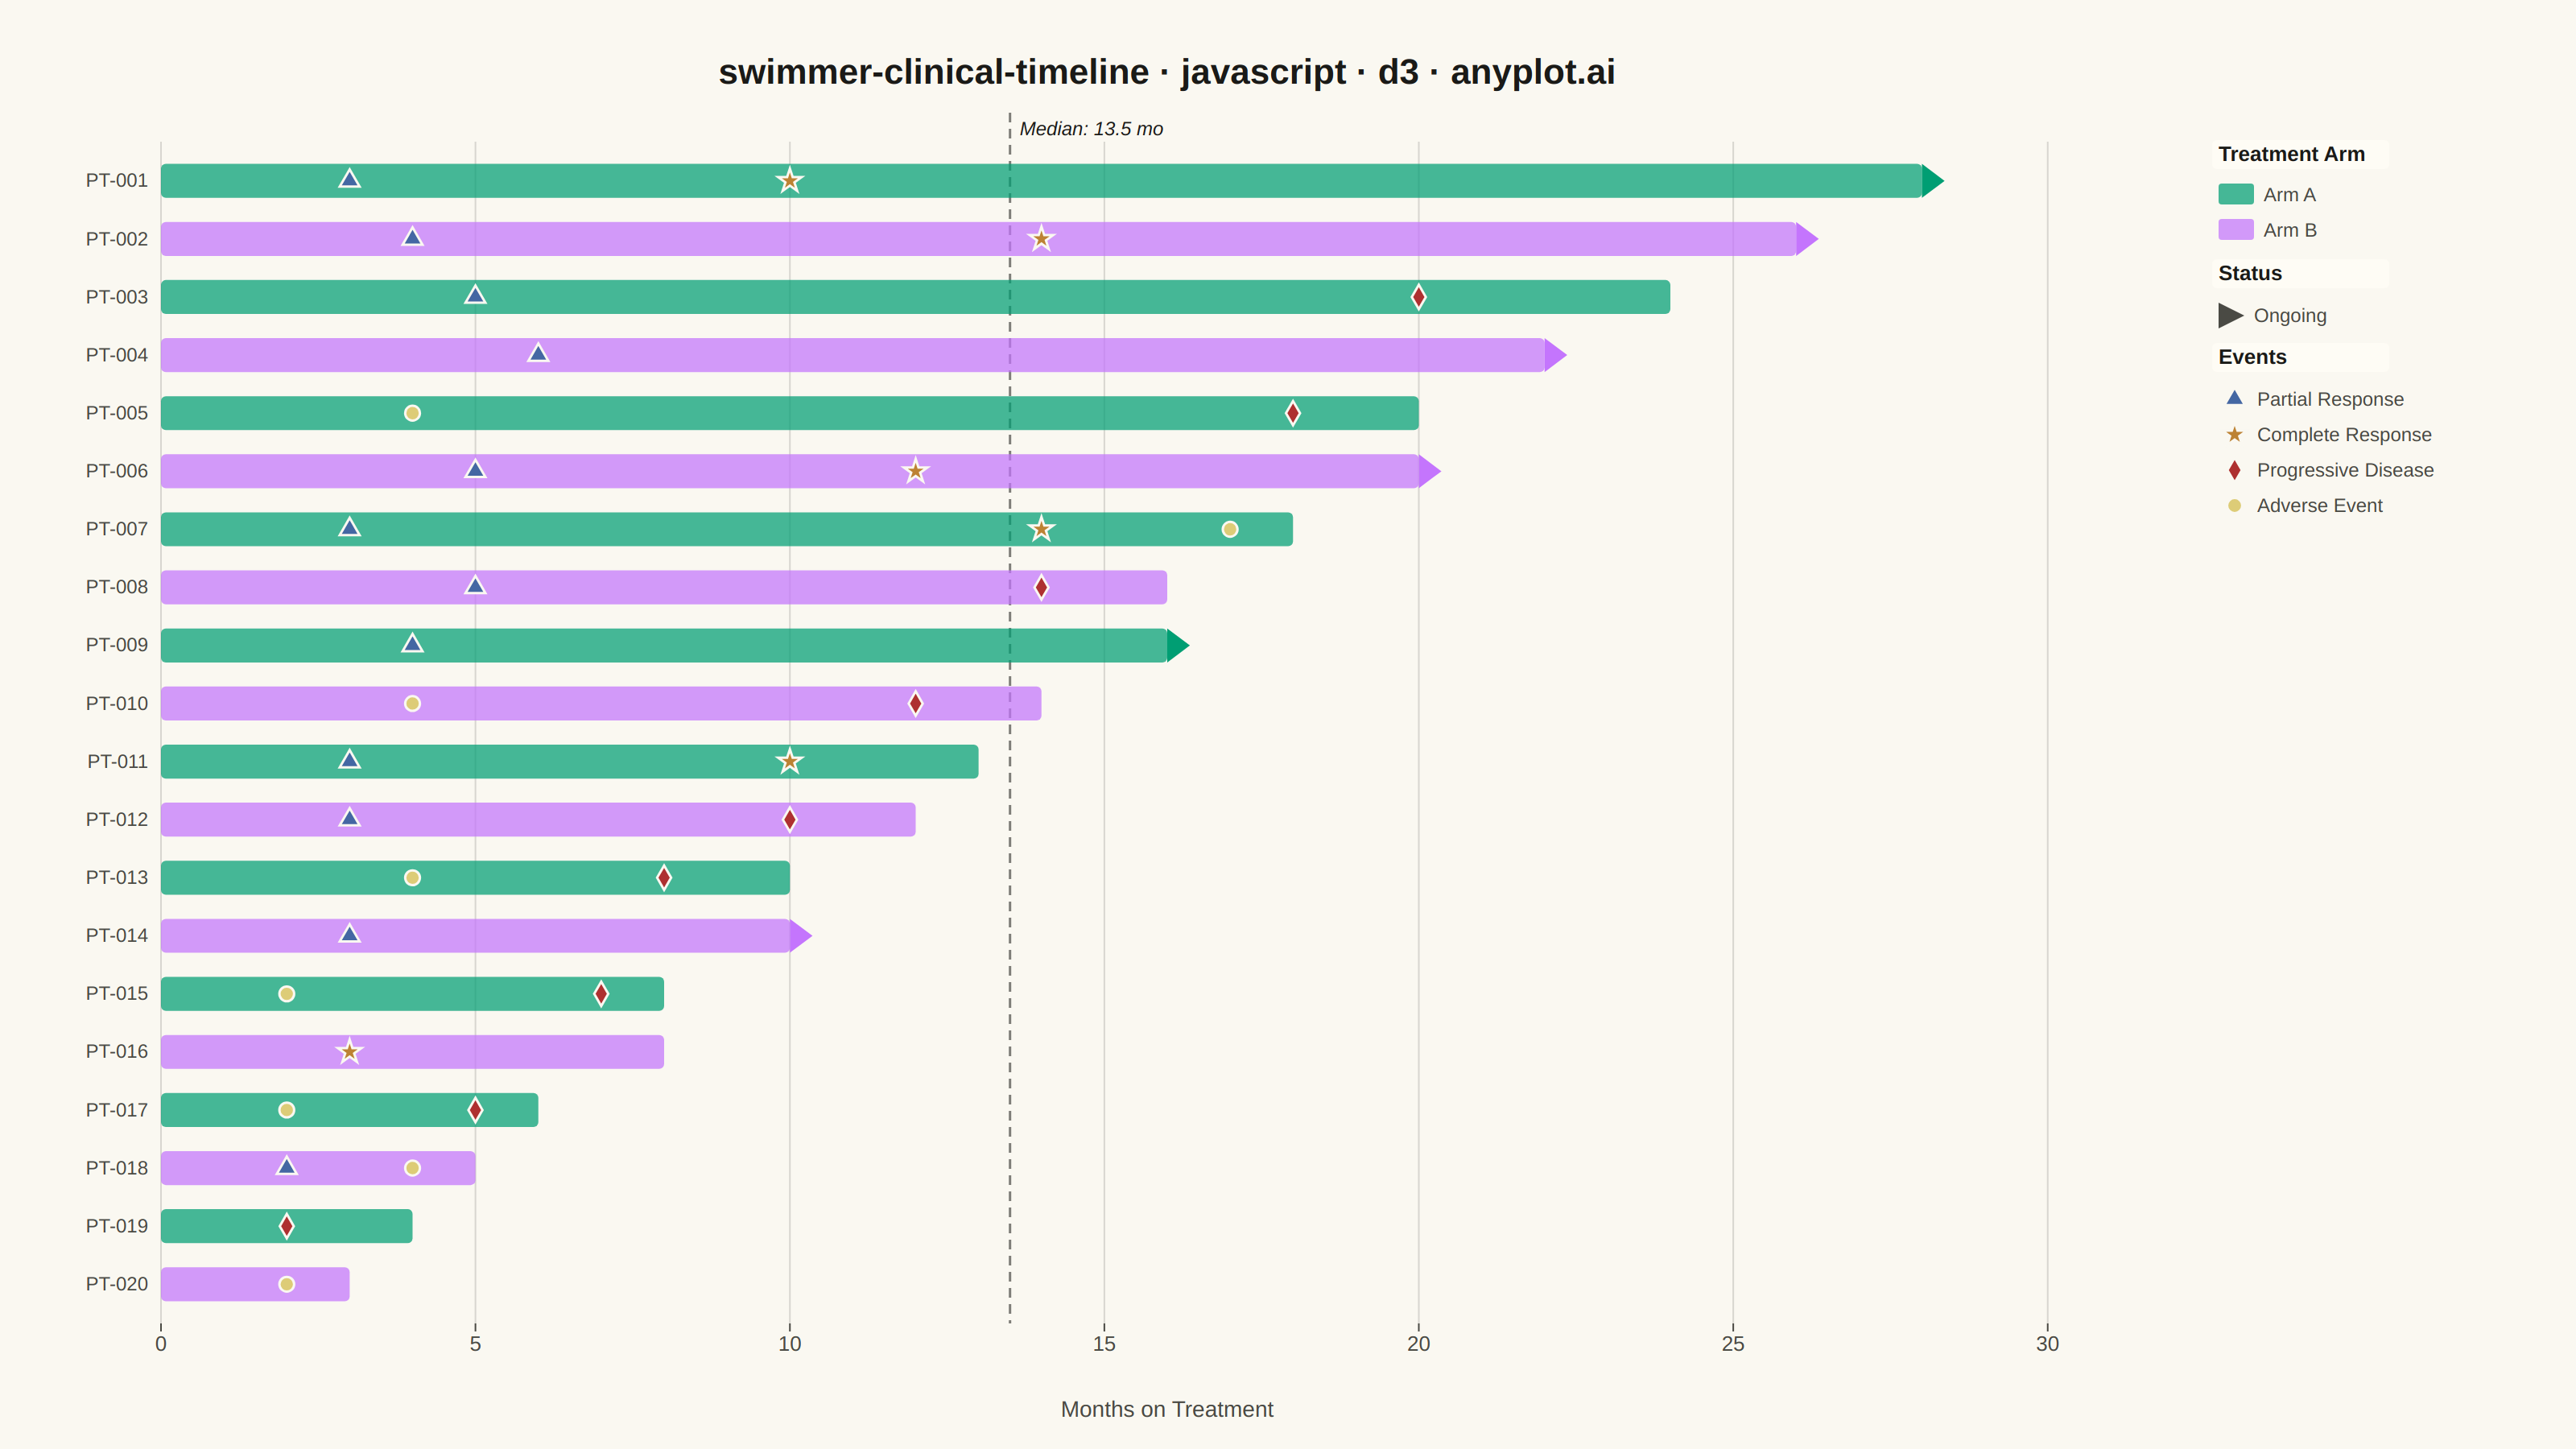
A swimmer plot displays individual patient timelines as horizontal bars, commonly used in clinical oncology to visualize treatment duration, response events, and disease progression across a study cohort. Each bar represents one patient, typically sorted by treatment duration, with symbols or color changes marking key clinical events such as partial response, complete response, or progressive disease. This plot is standard in clinical trial publications and regulatory submissions for conveying patient-level longitudinal outcomes at a glance.
// anyplot.ai
// swimmer-clinical-timeline: Swimmer Plot for Clinical Trial Timelines
// Library: d3 7.9.0 | JavaScript 22.22.3
// Quality: 89/100 | Created: 2026-06-08

const t = window.ANYPLOT_TOKENS;
const { width, height } = window.ANYPLOT_SIZE;

// --- Data: 20 patients, Phase II oncology trial, 2 treatment arms ---
const patients = [
  { id: "PT-001", arm: "Arm A", duration: 28, ongoing: true,  events: [{ t: 3, type: "pr" }, { t: 10, type: "cr" }] },
  { id: "PT-002", arm: "Arm B", duration: 26, ongoing: true,  events: [{ t: 4, type: "pr" }, { t: 14, type: "cr" }] },
  { id: "PT-003", arm: "Arm A", duration: 24, ongoing: false, events: [{ t: 5, type: "pr" }, { t: 20, type: "pd" }] },
  { id: "PT-004", arm: "Arm B", duration: 22, ongoing: true,  events: [{ t: 6, type: "pr" }] },
  { id: "PT-005", arm: "Arm A", duration: 20, ongoing: false, events: [{ t: 4, type: "ae" }, { t: 18, type: "pd" }] },
  { id: "PT-006", arm: "Arm B", duration: 20, ongoing: true,  events: [{ t: 5, type: "pr" }, { t: 12, type: "cr" }] },
  { id: "PT-007", arm: "Arm A", duration: 18, ongoing: false, events: [{ t: 3, type: "pr" }, { t: 14, type: "cr" }, { t: 17, type: "ae" }] },
  { id: "PT-008", arm: "Arm B", duration: 16, ongoing: false, events: [{ t: 5, type: "pr" }, { t: 14, type: "pd" }] },
  { id: "PT-009", arm: "Arm A", duration: 16, ongoing: true,  events: [{ t: 4, type: "pr" }] },
  { id: "PT-010", arm: "Arm B", duration: 14, ongoing: false, events: [{ t: 4, type: "ae" }, { t: 12, type: "pd" }] },
  { id: "PT-011", arm: "Arm A", duration: 13, ongoing: false, events: [{ t: 3, type: "pr" }, { t: 10, type: "cr" }] },
  { id: "PT-012", arm: "Arm B", duration: 12, ongoing: false, events: [{ t: 3, type: "pr" }, { t: 10, type: "pd" }] },
  { id: "PT-013", arm: "Arm A", duration: 10, ongoing: false, events: [{ t: 4, type: "ae" }, { t: 8,  type: "pd" }] },
  { id: "PT-014", arm: "Arm B", duration: 10, ongoing: true,  events: [{ t: 3, type: "pr" }] },
  { id: "PT-015", arm: "Arm A", duration: 8,  ongoing: false, events: [{ t: 2, type: "ae" }, { t: 7,  type: "pd" }] },
  { id: "PT-016", arm: "Arm B", duration: 8,  ongoing: false, events: [{ t: 3, type: "cr" }] },
  { id: "PT-017", arm: "Arm A", duration: 6,  ongoing: false, events: [{ t: 2, type: "ae" }, { t: 5,  type: "pd" }] },
  { id: "PT-018", arm: "Arm B", duration: 5,  ongoing: false, events: [{ t: 2, type: "pr" }, { t: 4,  type: "ae" }] },
  { id: "PT-019", arm: "Arm A", duration: 4,  ongoing: false, events: [{ t: 2, type: "pd" }] },
  { id: "PT-020", arm: "Arm B", duration: 3,  ongoing: false, events: [{ t: 2, type: "ae" }] },
];

// Sorted longest-bar-first (top of chart)
patients.sort((a, b) => b.duration - a.duration);

// Event display config — Imprint palette positions + amber semantic anchor
const eventColors = {
  pr: t.palette[2],  // #4467A3 blue   — Partial Response
  cr: t.palette[3],  // #BD8233 ochre  — Complete Response (next ordinal after PR)
  pd: t.palette[4],  // #AE3030 red    — Progressive Disease (semantic: bad)
  ae: t.amber,       // #DDCC77 amber  — Adverse Event (semantic: warning)
};
const eventLabels = {
  pr: "Partial Response",
  cr: "Complete Response",
  pd: "Progressive Disease",
  ae: "Adverse Event",
};
const eventSymbolTypes = {
  pr: d3.symbolTriangle,  // up-triangle = improvement
  cr: d3.symbolStar,      // star = best outcome
  pd: d3.symbolDiamond,   // diamond = deterioration marker
  ae: d3.symbolCircle,    // circle = safety event
};

// --- Layout ---
const margin = { top: 88, right: 250, bottom: 78, left: 100 };
const iw = width  - margin.left - margin.right;
const ih = height - margin.top  - margin.bottom;

// --- SVG mount ---
const svg = d3.select("#container").append("svg")
  .attr("width", width)
  .attr("height", height);

const g = svg.append("g")
  .attr("transform", `translate(${margin.left},${margin.top})`);

// --- Scales ---
const x = d3.scaleLinear().domain([0, 32]).range([0, iw]);

const y = d3.scaleBand()
  .domain(patients.map(d => d.id))
  .range([0, ih])
  .padding(0.35);

const barH = y.bandwidth();
const symSize = Math.max(60, barH * barH * 0.12); // scale symbols with bar height

// --- Vertical gridlines (behind bars) ---
x.ticks(8).forEach(v => {
  g.append("line")
    .attr("x1", x(v)).attr("x2", x(v))
    .attr("y1", 0).attr("y2", ih)
    .attr("stroke", t.grid)
    .attr("stroke-width", 1);
});

// --- Median reference line ---
// Durations sorted: 28,26,24,22,20,20,18,16,16,14,13,12,10,10,8,8,6,5,4,3 → median=(14+13)/2=13.5
const medianDuration = 13.5;
g.append("line")
  .attr("x1", x(medianDuration)).attr("x2", x(medianDuration))
  .attr("y1", -18).attr("y2", ih)
  .attr("stroke", t.ink)
  .attr("stroke-width", 1.5)
  .attr("stroke-dasharray", "6,4")
  .attr("opacity", 0.55);
g.append("text")
  .attr("x", x(medianDuration) + 6)
  .attr("y", -4)
  .attr("fill", t.ink)
  .style("font-size", "12px")
  .style("font-style", "italic")
  .text("Median: 13.5 mo");

// --- Horizontal bars (treatment duration) ---
g.selectAll(".bar")
  .data(patients)
  .join("rect")
  .attr("x", 0)
  .attr("y", d => y(d.id) + barH * 0.05)
  .attr("width", d => Math.max(x(d.duration), 3))
  .attr("height", barH * 0.9)
  .attr("fill", d => d.arm === "Arm A" ? t.palette[0] : t.palette[1])
  .attr("fill-opacity", 0.72)
  .attr("rx", 3);

// --- Ongoing arrows (right-pointing triangle at bar end) ---
patients.filter(d => d.ongoing).forEach(d => {
  const cx = x(d.duration);
  const cy = y(d.id) + barH / 2;
  const ah = barH * 0.45;
  const aw = barH * 0.60;
  g.append("path")
    .attr("d", `M ${cx} ${cy - ah} L ${cx + aw} ${cy} L ${cx} ${cy + ah} Z`)
    .attr("fill", d.arm === "Arm A" ? t.palette[0] : t.palette[1]);
});

// --- Event markers (on top of bars) ---
patients.forEach(p => {
  p.events.forEach(ev => {
    g.append("path")
      .attr("transform", `translate(${x(ev.t)},${y(p.id) + barH / 2})`)
      .attr("d", d3.symbol().type(eventSymbolTypes[ev.type]).size(symSize)())
      .attr("fill", eventColors[ev.type])
      .attr("stroke", t.pageBg)
      .attr("stroke-width", 1.5);
  });
});

// --- X-axis ---
const xAxis = g.append("g")
  .attr("transform", `translate(0,${ih})`)
  .call(d3.axisBottom(x).ticks(8).tickSize(5));

xAxis.selectAll("text").attr("fill", t.inkSoft).style("font-size", "13px");
xAxis.selectAll(".tick line").attr("stroke", t.inkSoft);
xAxis.select(".domain").attr("stroke", "none");

// --- Y-axis (patient IDs) ---
const yAxis = g.append("g")
  .call(d3.axisLeft(y).tickSize(0));

yAxis.selectAll("text")
  .attr("fill", t.inkSoft)
  .style("font-size", "12px")
  .attr("dx", "-5px");
yAxis.select(".domain").attr("stroke", "none");

// --- Axis label ---
svg.append("text")
  .attr("x", margin.left + iw / 2)
  .attr("y", height - 20)
  .attr("text-anchor", "middle")
  .attr("fill", t.inkSoft)
  .style("font-size", "14px")
  .text("Months on Treatment");

// --- Legend (right side) ---
const lx = margin.left + iw + 28;
let ly = margin.top + 12;

// helper: draw a filled callout pill behind a legend section header
function legendHeader(svgEl, x, y, label) {
  svgEl.append("rect")
    .attr("x", x - 4).attr("y", y - 13)
    .attr("width", 110).attr("height", 18).attr("rx", 3)
    .attr("fill", t.elevatedBg || (window.ANYPLOT_THEME === "dark" ? "#242420" : "#FFFDF6"))
    .attr("opacity", 0.9);
  svgEl.append("text").attr("x", x).attr("y", y)
    .attr("fill", t.ink).style("font-size", "13px").style("font-weight", "600")
    .text(label);
}

// Treatment arms
legendHeader(svg, lx, ly, "Treatment Arm");

[{ label: "Arm A", c: t.palette[0] }, { label: "Arm B", c: t.palette[1] }].forEach(arm => {
  ly += 22;
  svg.append("rect")
    .attr("x", lx).attr("y", ly - 8)
    .attr("width", 22).attr("height", 13).attr("rx", 2)
    .attr("fill", arm.c).attr("fill-opacity", 0.72);
  svg.append("text").attr("x", lx + 28).attr("y", ly + 3)
    .attr("fill", t.inkSoft).style("font-size", "12px").text(arm.label);
});

// Status (ongoing indicator)
ly += 30;
legendHeader(svg, lx, ly, "Status");

ly += 22;
const arH = 8;
svg.append("path")
  .attr("d", `M ${lx} ${ly - arH} L ${lx + 16} ${ly} L ${lx} ${ly + arH} Z`)
  .attr("fill", t.inkSoft);
svg.append("text").attr("x", lx + 22).attr("y", ly + 4)
  .attr("fill", t.inkSoft).style("font-size", "12px").text("Ongoing");

// Events
ly += 30;
legendHeader(svg, lx, ly, "Events");

["pr", "cr", "pd", "ae"].forEach(type => {
  ly += 22;
  svg.append("path")
    .attr("transform", `translate(${lx + 10},${ly})`)
    .attr("d", d3.symbol().type(eventSymbolTypes[type]).size(70)())
    .attr("fill", eventColors[type])
    .attr("stroke", t.pageBg)
    .attr("stroke-width", 1.5);
  svg.append("text").attr("x", lx + 24).attr("y", ly + 4)
    .attr("fill", t.inkSoft).style("font-size", "12px").text(eventLabels[type]);
});

// --- Title ---
const title = "swimmer-clinical-timeline · javascript · d3 · anyplot.ai";
svg.append("text")
  .attr("x", margin.left + iw / 2)
  .attr("y", 52)
  .attr("text-anchor", "middle")
  .attr("fill", t.ink)
  .style("font-size", "22px")
  .style("font-weight", "600")
  .text(title);
Runnable source as JSON, for any HTTP client: https://api.anyplot.ai/specs/swimmer-clinical-timeline/d3/code. Any spec id and library id listed in llms-full.txt fit the same URL shape; every URL below is complete and callable.
{
  "spec_id": "swimmer-clinical-timeline",
  "language": "javascript",
  "library": "d3",
  "page": "https://anyplot.ai/swimmer-clinical-timeline/javascript/d3",
  "hub": "https://anyplot.ai/swimmer-clinical-timeline",
  "code_json": "https://api.anyplot.ai/specs/swimmer-clinical-timeline/d3/code",
  "spec_json": "https://api.anyplot.ai/specs/swimmer-clinical-timeline",
  "render_light_png": "https://storage.googleapis.com/anyplot-images/plots/swimmer-clinical-timeline/javascript/d3/plot-light.png",
  "render_dark_png": "https://storage.googleapis.com/anyplot-images/plots/swimmer-clinical-timeline/javascript/d3/plot-dark.png",
  "interactive_light_html": "https://storage.googleapis.com/anyplot-images/plots/swimmer-clinical-timeline/javascript/d3/plot-light.html",
  "interactive_dark_html": "https://storage.googleapis.com/anyplot-images/plots/swimmer-clinical-timeline/javascript/d3/plot-dark.html",
  "quality_score": 89.0,
  "license": "MIT",
  "guide": "https://anyplot.ai/llms.txt"
}
Part of Swimmer Plot for Clinical Trial Timelines on anyplot.ai.