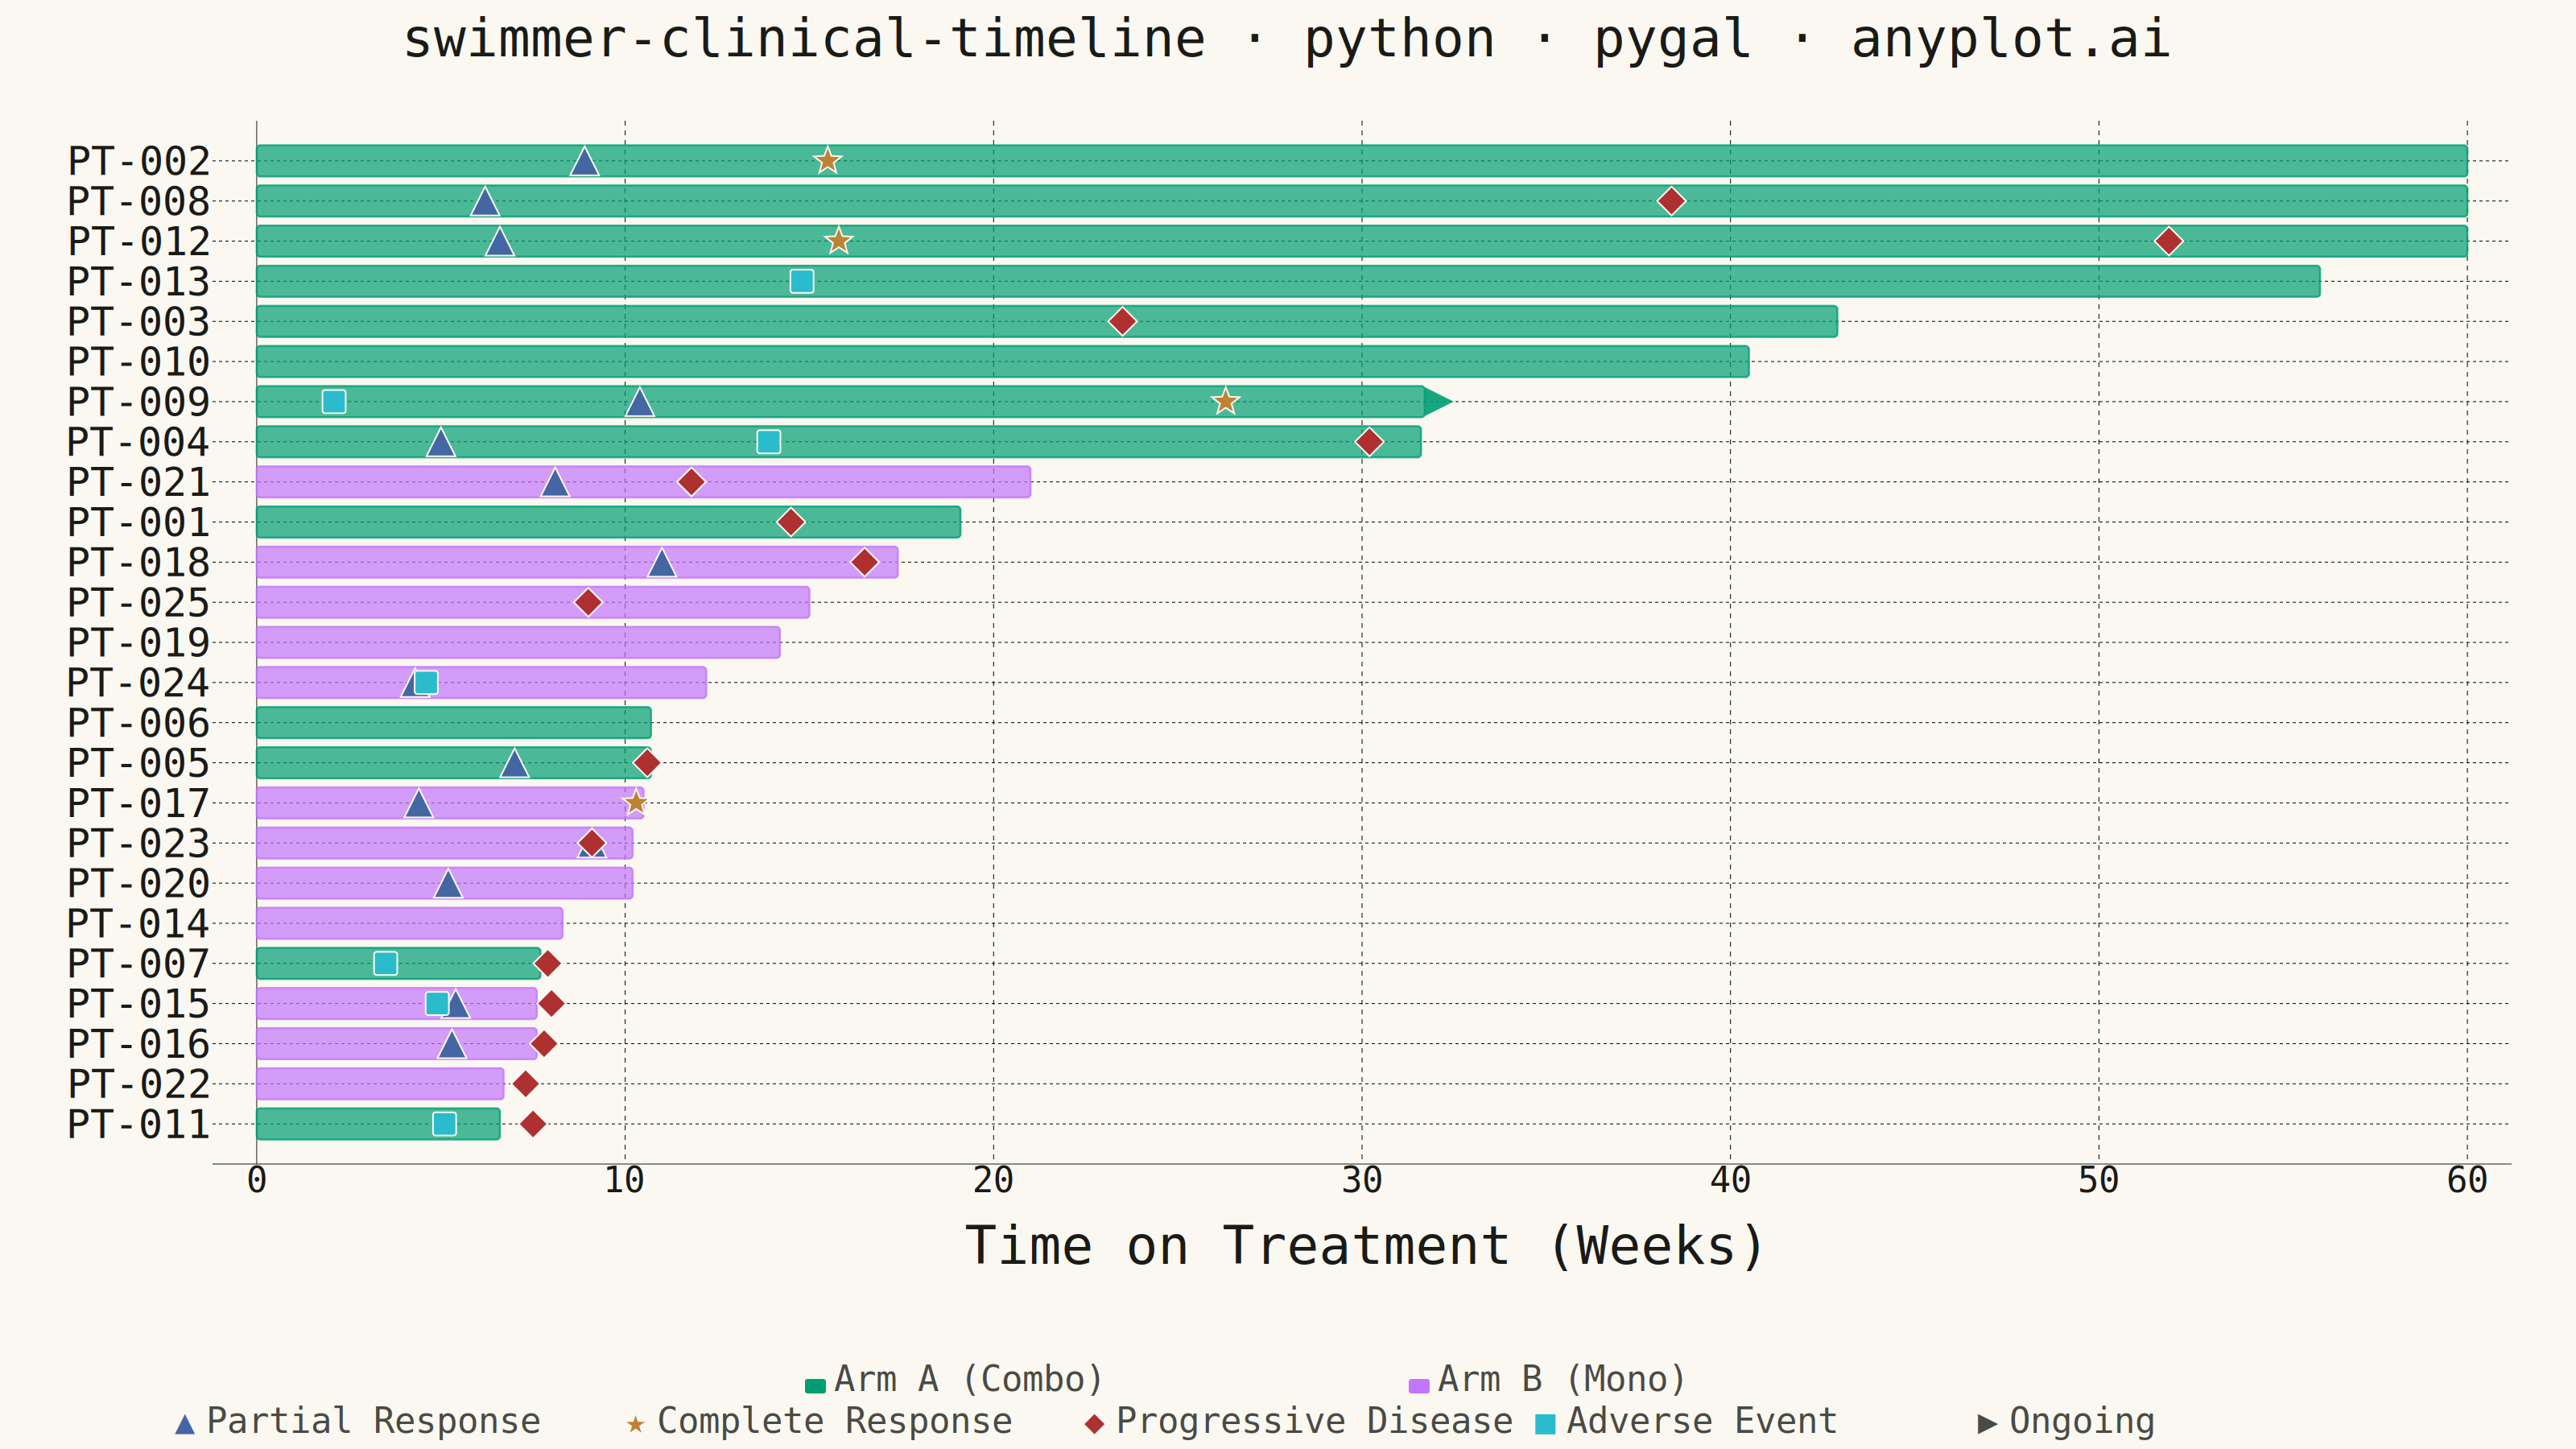
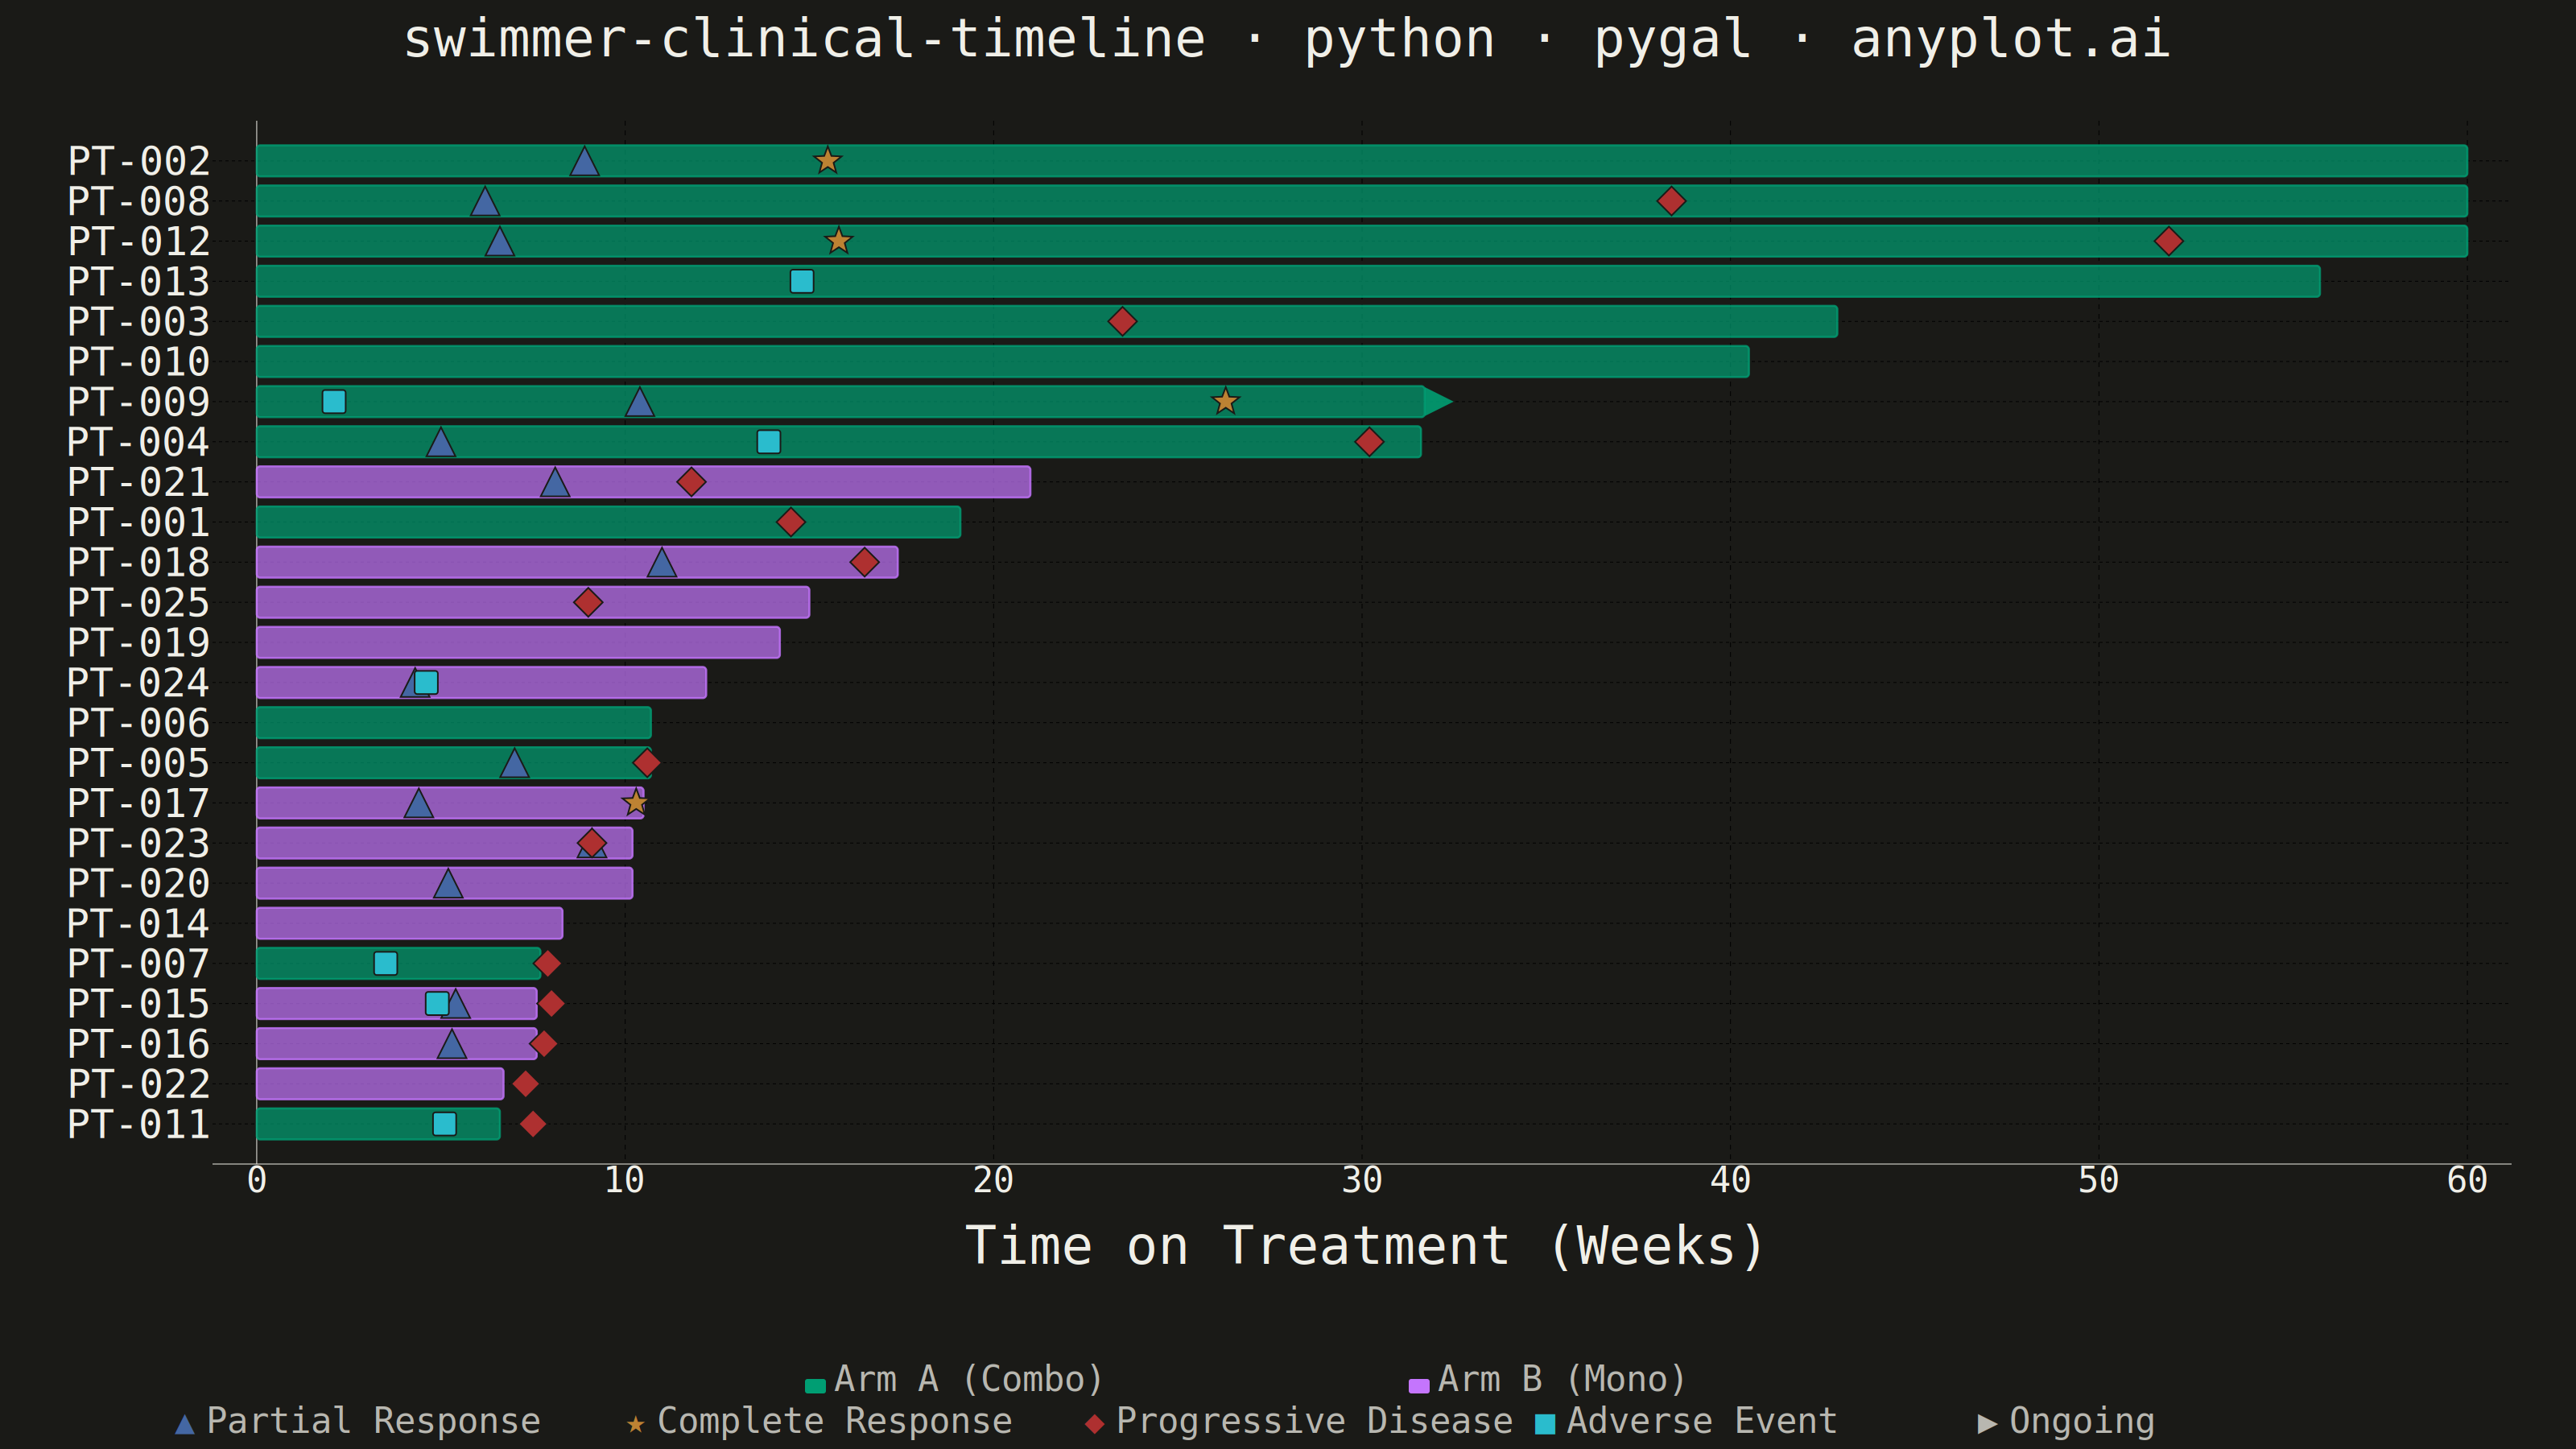
A swimmer plot displays individual patient timelines as horizontal bars, commonly used in clinical oncology to visualize treatment duration, response events, and disease progression across a study cohort. Each bar represents one patient, typically sorted by treatment duration, with symbols or color changes marking key clinical events such as partial response, complete response, or progressive disease. This plot is standard in clinical trial publications and regulatory submissions for conveying patient-level longitudinal outcomes at a glance.
""" anyplot.ai
swimmer-clinical-timeline: Swimmer Plot for Clinical Trial Timelines
Library: pygal 3.1.0 | Python 3.13.13
Quality: 84/100 | Updated: 2026-06-08
"""

import os
import re
import sys
import xml.etree.ElementTree as ET


# Remove this file's directory from sys.path to prevent importing itself
# instead of the installed pygal package (file and package share the same name).
_here = os.path.abspath(os.path.dirname(__file__) or ".")
sys.path = [p for p in sys.path if os.path.abspath(p or ".") != _here]

import cairosvg
import numpy as np
import pygal
from pygal.style import Style


# Theme tokens — Imprint palette, theme-adaptive chrome
THEME = os.getenv("ANYPLOT_THEME", "light")
PAGE_BG = "#FAF8F1" if THEME == "light" else "#1A1A17"
INK = "#1A1A17" if THEME == "light" else "#F0EFE8"
INK_SOFT = "#4A4A44" if THEME == "light" else "#B8B7B0"
INK_MUTED = "#6B6A63" if THEME == "light" else "#A8A79F"

IMPRINT_PALETTE = ("#009E73", "#C475FD", "#4467A3", "#BD8233", "#AE3030", "#2ABCCD", "#954477", "#99B314")

# Treatment arm colors: Imprint positions 1 (green) and 2 (lavender)
ARM_COLORS = {"Arm A (Combo)": "#009E73", "Arm B (Mono)": "#C475FD"}

# Event marker colors: Imprint positions 3–6, visually distinct from both arm colors
EVENT_CONFIG = {
    "partial_response": {"color": "#4467A3", "label": "Partial Response"},
    "complete_response": {"color": "#BD8233", "label": "Complete Response"},
    "progressive_disease": {"color": "#AE3030", "label": "Progressive Disease"},
    "adverse_event": {"color": "#2ABCCD", "label": "Adverse Event"},
}

# Data — simulated Phase II oncology trial, 25 patients across two treatment arms
np.random.seed(42)
patient_ids = [f"PT-{i:03d}" for i in range(1, 26)]
arms = ["Arm A (Combo)"] * 13 + ["Arm B (Mono)"] * 12

durations_a = np.random.exponential(scale=28, size=13) + 6
durations_b = np.random.exponential(scale=18, size=12) + 4
durations = np.clip(np.concatenate([durations_a, durations_b]), 4, 60).round(1)

events = []
for i in range(25):
    dur = durations[i]
    pat_events = []
    if np.random.random() < 0.75:
        pr_time = np.random.uniform(4, min(12, dur - 1))
        pat_events.append(("partial_response", round(pr_time, 1)))
        if np.random.random() < 0.35 and dur > pr_time + 6:
            cr_time = pr_time + np.random.uniform(6, min(16, dur - pr_time - 1))
            pat_events.append(("complete_response", round(cr_time, 1)))
    if np.random.random() < 0.4:
        pd_time = np.random.uniform(max(8, dur * 0.5), dur)
        pat_events.append(("progressive_disease", round(pd_time, 1)))
    if np.random.random() < 0.3:
        ae_time = np.random.uniform(2, min(dur - 1, 20))
        pat_events.append(("adverse_event", round(ae_time, 1)))
    events.append(pat_events)

ongoing = [
    not any(e[0] == "progressive_disease" for e in events[i]) and durations[i] > 30 and np.random.random() < 0.6
    for i in range(25)
]

# Sort by duration, longest first (creates clear visual hierarchy)
sort_idx = np.argsort(-durations)
patient_ids = [patient_ids[i] for i in sort_idx]
arms = [arms[i] for i in sort_idx]
durations = durations[sort_idx]
events = [events[i] for i in sort_idx]
ongoing = [ongoing[i] for i in sort_idx]
num_patients = len(patient_ids)
max_duration = float(np.ceil(max(durations) / 10) * 10)

# pygal HorizontalBar renders bottom-to-top; reverse for longest-at-top display
rev_ids = list(reversed(patient_ids))
rev_arms = list(reversed(arms))
rev_durs = list(reversed(durations))
rev_events = list(reversed(events))
rev_ongoing = list(reversed(ongoing))

# Plot — canvas 3200×1800 (landscape, hard rule)
title = "swimmer-clinical-timeline · python · pygal · anyplot.ai"

custom_style = Style(
    background=PAGE_BG,
    plot_background=PAGE_BG,
    foreground=INK,
    foreground_strong=INK,
    foreground_subtle=INK_MUTED,
    colors=IMPRINT_PALETTE,
    title_font_size=66,
    label_font_size=50,
    major_label_font_size=44,
    legend_font_size=40,
    value_font_size=30,
    stroke_width=2.5,
)

chart = pygal.HorizontalBar(
    width=3200,
    height=1800,
    style=custom_style,
    title=title,
    x_title="Time on Treatment (Weeks)",
    show_legend=False,
    print_values=False,
    show_y_guides=True,
    show_x_guides=True,
    margin=80,
    margin_bottom=230,
    spacing=4,
    range=(0, max_duration),
    rounded_bars=4,
    y_labels_major_every=1,
    truncate_label=8,
)

chart.x_labels = rev_ids

chart.add(
    "Duration",
    [
        {
            "value": float(rev_durs[i]),
            "color": ARM_COLORS[rev_arms[i]],
            "label": f"{rev_ids[i]}: {rev_durs[i]:.1f} wk ({rev_arms[i]})",
        }
        for i in range(num_patients)
    ],
)

# Render SVG and extract bar positions for event marker injection
svg_str = chart.render().decode("utf-8")
root = ET.fromstring(svg_str)

# Find plot group translation offset
tx, ty = 0.0, 0.0
for g in root.iter("{http://www.w3.org/2000/svg}g"):
    if g.get("class", "") == "plot":
        m = re.search(r"translate\(([^,]+),\s*([^)]+)\)", g.get("transform", ""))
        if m:
            tx, ty = float(m.group(1)), float(m.group(2))
        break

# Extract bar rects (translated to global SVG coordinates)
bar_rects = sorted(
    [
        {
            "x": float(r.get("x", 0)) + tx,
            "y": float(r.get("y", 0)) + ty,
            "width": float(r.get("width", 0)),
            "height": float(r.get("height", 0)),
        }
        for r in root.iter("{http://www.w3.org/2000/svg}rect")
        if "rect reactive tooltip-trigger" in r.get("class", "")
    ],
    key=lambda b: b["y"],
    reverse=True,
)

# Build SVG marker elements for events and ongoing arrows
STROKE = PAGE_BG  # outline matches page bg for clean contrast on both themes
marker_svgs = []
ms = 18  # marker half-size in SVG user units

if len(bar_rects) == num_patients:
    for i, bar in enumerate(bar_rects):
        bx, bw = bar["x"], bar["width"]
        cy = bar["y"] + bar["height"] / 2
        dur = rev_durs[i]

        if rev_ongoing[i]:
            ax = bx + bw
            marker_svgs.append(
                f'<polygon points="{ax:.1f},{cy - ms:.1f} '
                f'{ax + ms * 2:.1f},{cy:.1f} {ax:.1f},{cy + ms:.1f}" '
                f'fill="{ARM_COLORS[rev_arms[i]]}" opacity="0.9"/>'
            )

        for etype, etime in rev_events[i]:
            col = EVENT_CONFIG[etype]["color"]
            ex = bx + (etime / dur) * bw

            if etype == "partial_response":
                marker_svgs.append(
                    f'<polygon points="{ex:.1f},{cy - ms:.1f} '
                    f'{ex - ms:.1f},{cy + ms:.1f} {ex + ms:.1f},{cy + ms:.1f}" '
                    f'fill="{col}" stroke="{STROKE}" stroke-width="2"/>'
                )
            elif etype == "complete_response":
                pts = " ".join(
                    f"{ex + (ms if j % 2 == 0 else ms * 0.42) * np.cos(-np.pi / 2 + j * np.pi / 5):.1f},"
                    f"{cy + (ms if j % 2 == 0 else ms * 0.42) * np.sin(-np.pi / 2 + j * np.pi / 5):.1f}"
                    for j in range(10)
                )
                marker_svgs.append(f'<polygon points="{pts}" fill="{col}" stroke="{STROKE}" stroke-width="2"/>')
            elif etype == "progressive_disease":
                marker_svgs.append(
                    f'<polygon points="{ex:.1f},{cy - ms:.1f} {ex + ms:.1f},{cy:.1f} '
                    f'{ex:.1f},{cy + ms:.1f} {ex - ms:.1f},{cy:.1f}" '
                    f'fill="{col}" stroke="{STROKE}" stroke-width="2"/>'
                )
            elif etype == "adverse_event":
                h = ms * 0.8
                marker_svgs.append(
                    f'<rect x="{ex - h:.1f}" y="{cy - h:.1f}" '
                    f'width="{h * 2:.1f}" height="{h * 2:.1f}" '
                    f'fill="{col}" stroke="{STROKE}" stroke-width="2" rx="3"/>'
                )

# Two-row legend: row 1 = treatment arms, row 2 = event types
leg_y1, leg_y2 = 1725, 1778
font_lg = 44

arm_legend_x = [1000, 1750]
for idx, (arm_name, arm_col) in enumerate(ARM_COLORS.items()):
    x = arm_legend_x[idx]
    marker_svgs += [
        f'<rect x="{x}" y="{leg_y1 - 12}" width="26" height="18" fill="{arm_col}" rx="3"/>',
        f'<text x="{x + 36}" y="{leg_y1 + 3}" font-size="{font_lg}" fill="{INK_SOFT}">{arm_name}</text>',
    ]

event_legend = [
    ("▲", "#4467A3", "Partial Response"),
    ("★", "#BD8233", "Complete Response"),
    ("◆", "#AE3030", "Progressive Disease"),
    ("■", "#2ABCCD", "Adverse Event"),
    ("▶", INK_SOFT, "Ongoing"),
]
evt_legend_x = [230, 790, 1360, 1920, 2470]
for idx, (sym, col, lbl) in enumerate(event_legend):
    x = evt_legend_x[idx]
    marker_svgs += [
        f'<text x="{x}" y="{leg_y2 + 2}" font-size="42" fill="{col}" text-anchor="middle">{sym}</text>',
        f'<text x="{x + 26}" y="{leg_y2 + 2}" font-size="{font_lg}" fill="{INK_SOFT}">{lbl}</text>',
    ]

svg_output = svg_str.replace("</svg>", "\n".join(marker_svgs) + "\n</svg>")
svg_output = svg_output.replace(">No data<", "><")

# Save
with open(f"plot-{THEME}.html", "w") as f:
    f.write(svg_output)

cairosvg.svg2png(bytestring=svg_output.encode(), write_to=f"plot-{THEME}.png")
Runnable source as JSON, for any HTTP client: https://api.anyplot.ai/specs/swimmer-clinical-timeline/pygal/code. Any spec id and library id listed in llms-full.txt fit the same URL shape; every URL below is complete and callable.
{
  "spec_id": "swimmer-clinical-timeline",
  "language": "python",
  "library": "pygal",
  "page": "https://anyplot.ai/swimmer-clinical-timeline/python/pygal",
  "hub": "https://anyplot.ai/swimmer-clinical-timeline",
  "code_json": "https://api.anyplot.ai/specs/swimmer-clinical-timeline/pygal/code",
  "spec_json": "https://api.anyplot.ai/specs/swimmer-clinical-timeline",
  "render_light_png": "https://storage.googleapis.com/anyplot-images/plots/swimmer-clinical-timeline/python/pygal/plot-light.png",
  "render_dark_png": "https://storage.googleapis.com/anyplot-images/plots/swimmer-clinical-timeline/python/pygal/plot-dark.png",
  "interactive_light_html": "https://storage.googleapis.com/anyplot-images/plots/swimmer-clinical-timeline/python/pygal/plot-light.html",
  "interactive_dark_html": "https://storage.googleapis.com/anyplot-images/plots/swimmer-clinical-timeline/python/pygal/plot-dark.html",
  "quality_score": 84.0,
  "license": "MIT",
  "guide": "https://anyplot.ai/llms.txt"
}
Part of Swimmer Plot for Clinical Trial Timelines on anyplot.ai.