The same plot in 14 other libraries — JavaScript: Chart.js, D3.js, Apache ECharts, Highcharts; Python: Altair, Bokeh, lets-plot, Matplotlib, Plotly, plotnine, Pygal, Seaborn; R: ggplot2; Julia: Makie.jl. Compare all 15 side by side: Swimmer Plot for Clinical Trial Timelines in Python, R, Julia and JavaScript.
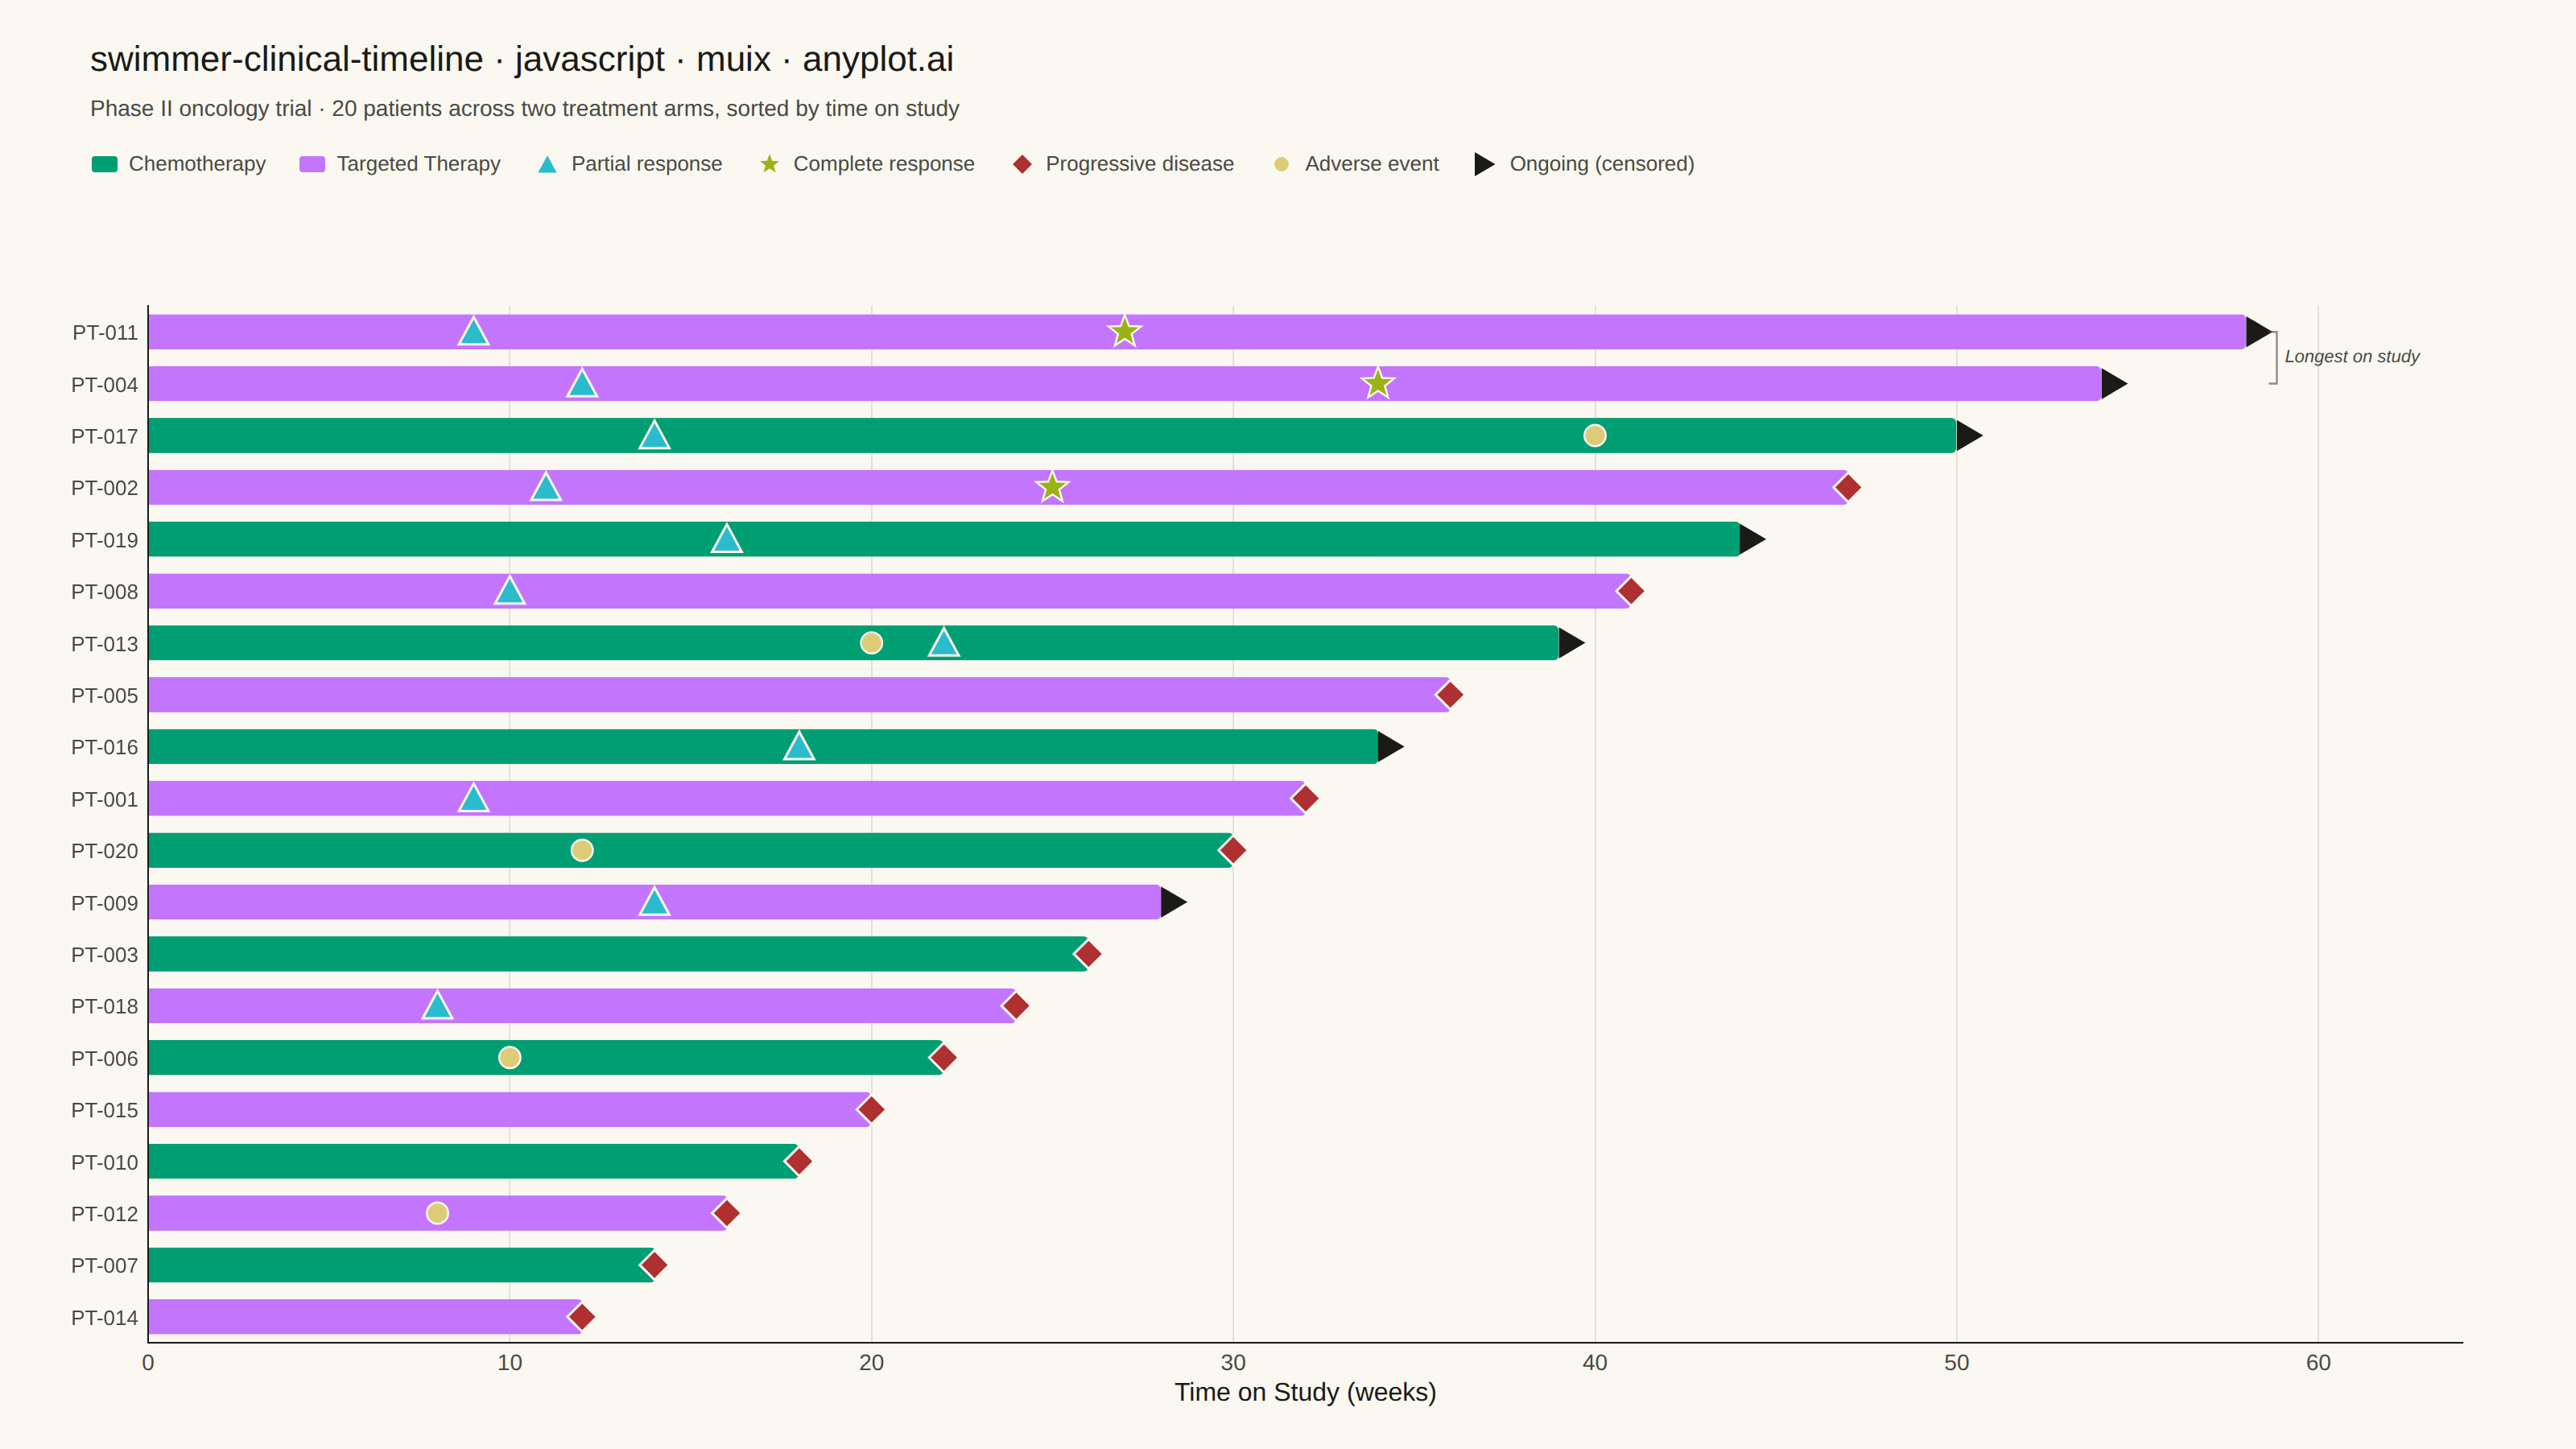
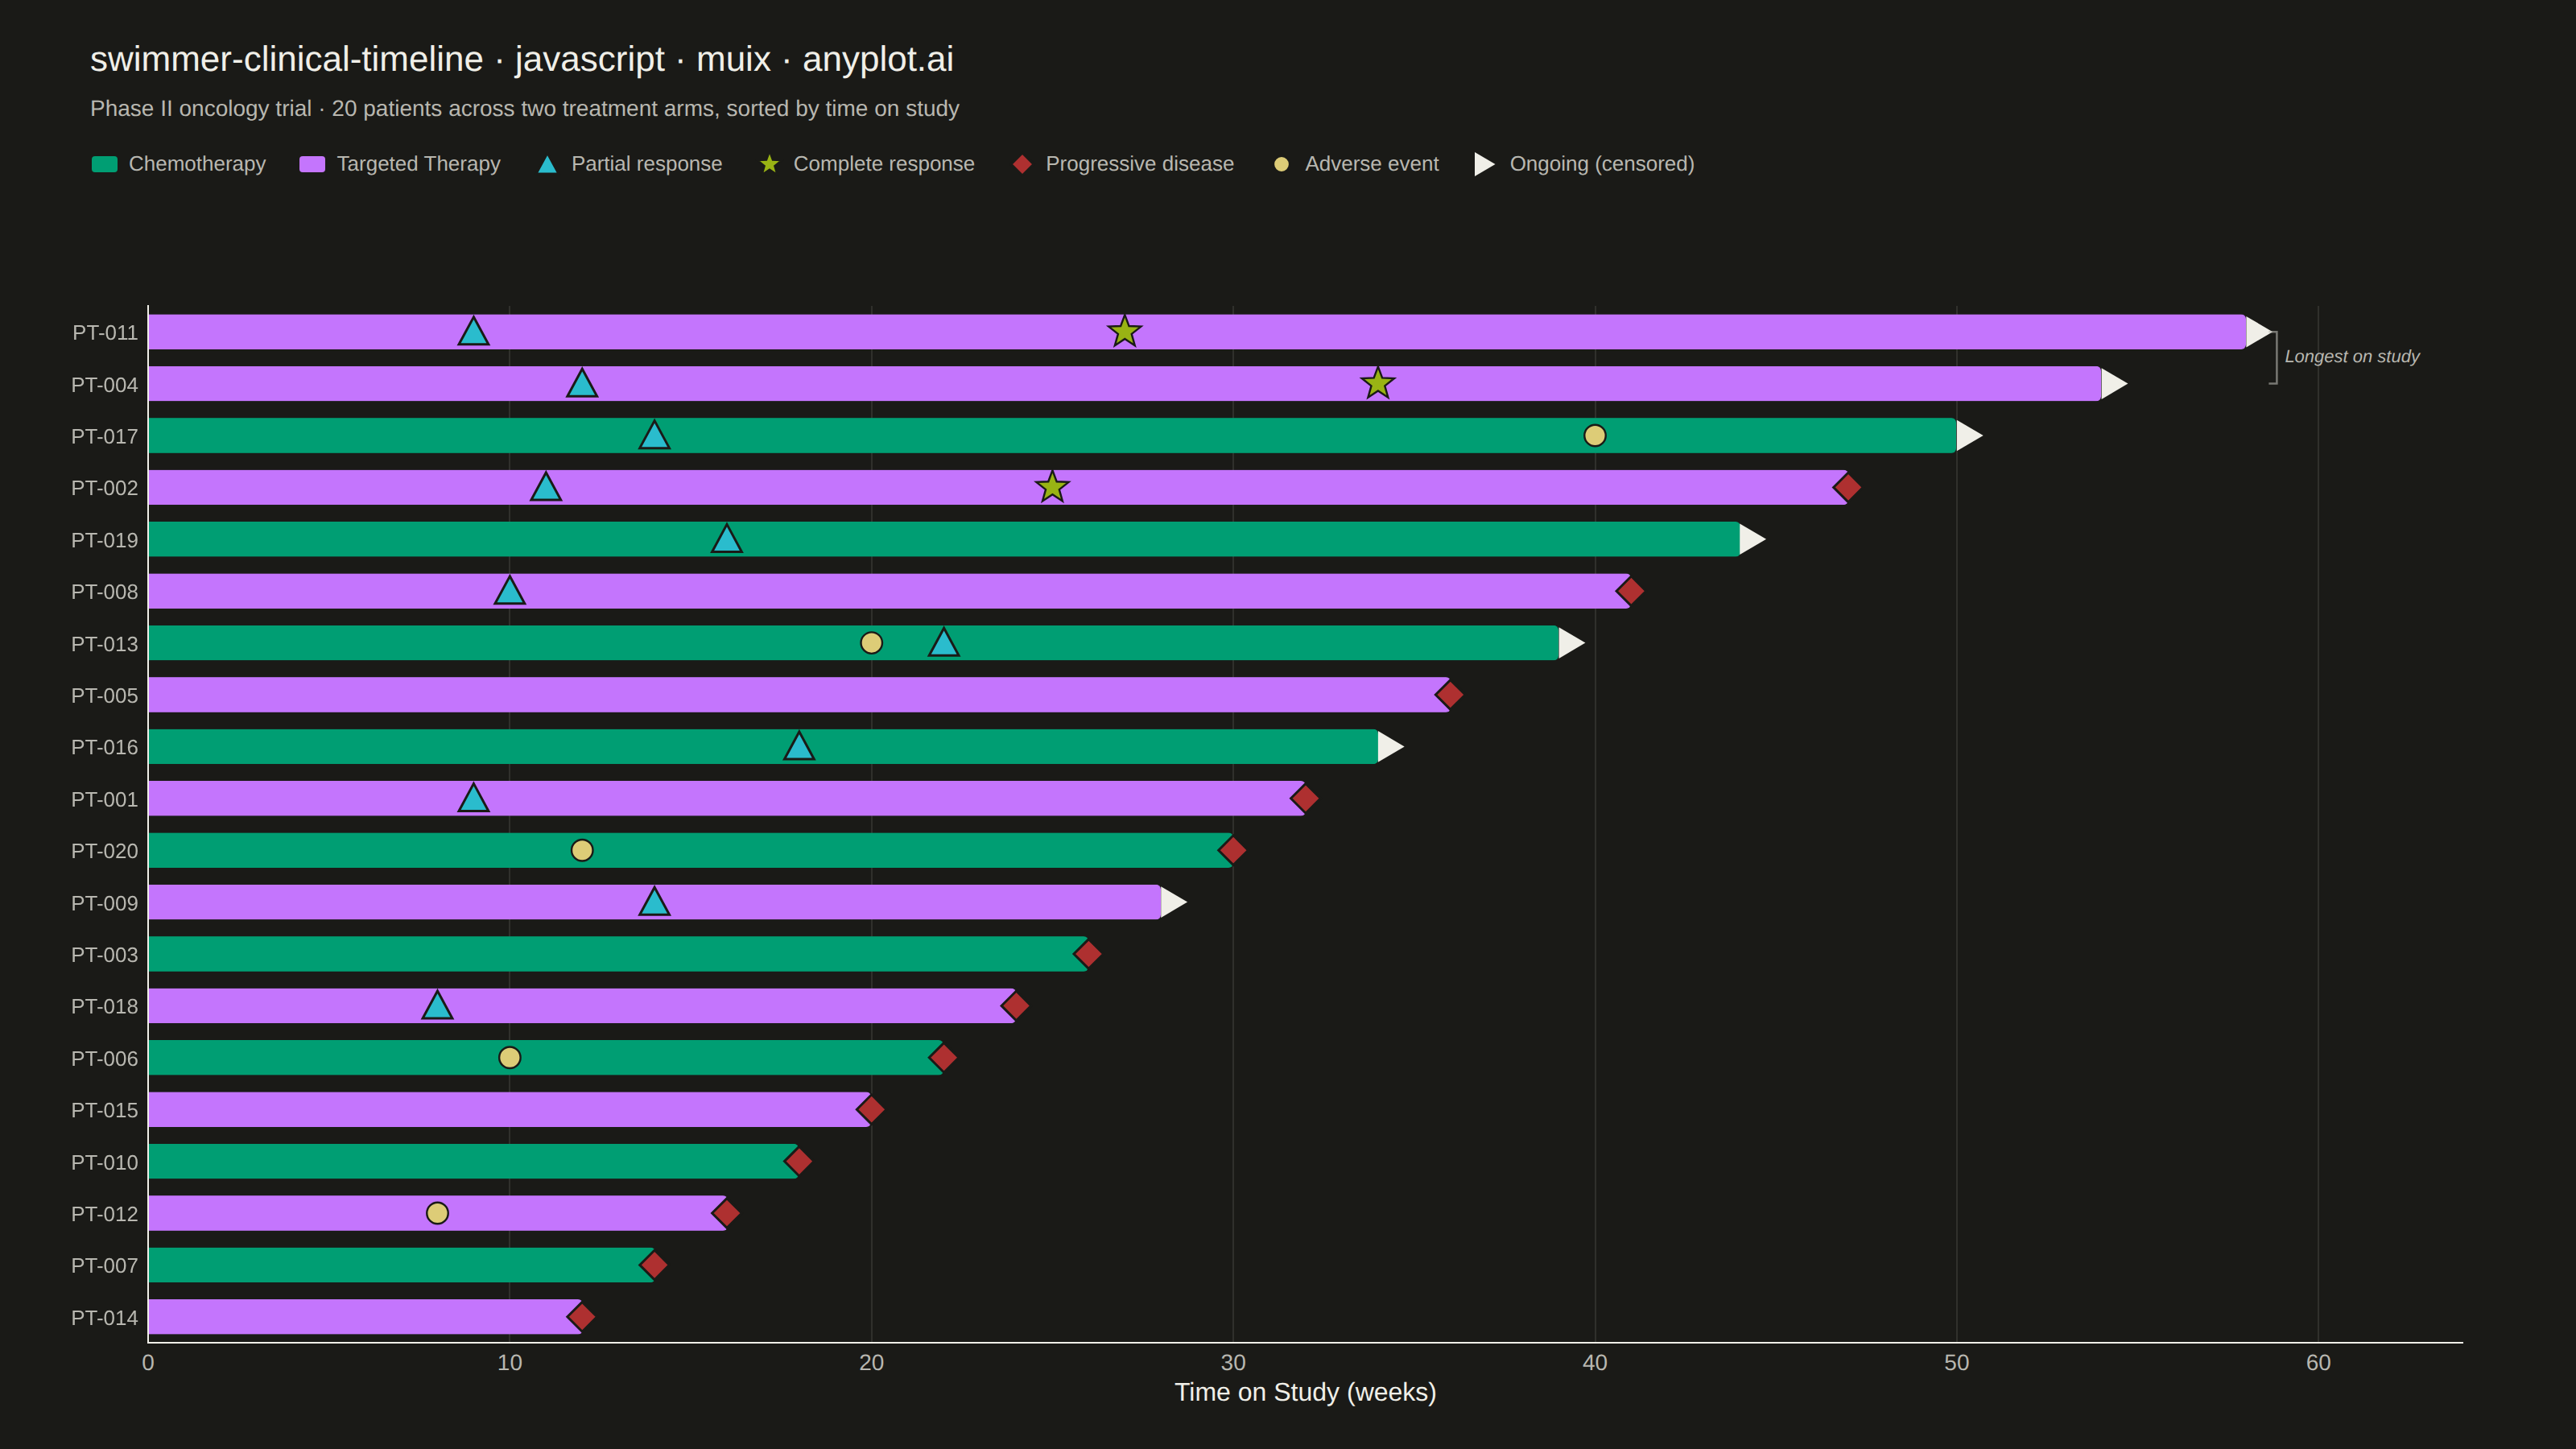
A swimmer plot displays individual patient timelines as horizontal bars, commonly used in clinical oncology to visualize treatment duration, response events, and disease progression across a study cohort. Each bar represents one patient, typically sorted by treatment duration, with symbols or color changes marking key clinical events such as partial response, complete response, or progressive disease. This plot is standard in clinical trial publications and regulatory submissions for conveying patient-level longitudinal outcomes at a glance.
// anyplot.ai
// swimmer-clinical-timeline: Swimmer Plot for Clinical Trial Timelines
// Library: muix 7.29.1 | JavaScript 22.23.2
// Quality: 94/100 | Created: 2026-08-24
import { BarChart } from "@mui/x-charts/BarChart";
import { useXScale, useYScale } from "@mui/x-charts/hooks";
import Box from "@mui/material/Box";
import Typography from "@mui/material/Typography";

const t = window.ANYPLOT_TOKENS;

// --- Data (in-memory, deterministic): simulated Phase II oncology trial -----
// 20 patients across two treatment arms, ordered longest-duration-first so
// the plot reads top-to-bottom like a published clinical swimmer plot.
const ARM_A = "Chemotherapy";
const ARM_B = "Targeted Therapy";

const patients = [
  { id: "PT-011", group: ARM_B, duration: 58, ongoing: true, events: [{ time: 9, type: "partial_response" }, { time: 27, type: "complete_response" }] },
  { id: "PT-004", group: ARM_B, duration: 54, ongoing: true, events: [{ time: 12, type: "partial_response" }, { time: 34, type: "complete_response" }] },
  { id: "PT-017", group: ARM_A, duration: 50, ongoing: true, events: [{ time: 14, type: "partial_response" }, { time: 40, type: "adverse_event" }] },
  { id: "PT-002", group: ARM_B, duration: 47, ongoing: false, events: [{ time: 11, type: "partial_response" }, { time: 25, type: "complete_response" }, { time: 47, type: "progressive_disease" }] },
  { id: "PT-019", group: ARM_A, duration: 44, ongoing: true, events: [{ time: 16, type: "partial_response" }] },
  { id: "PT-008", group: ARM_B, duration: 41, ongoing: false, events: [{ time: 10, type: "partial_response" }, { time: 41, type: "progressive_disease" }] },
  { id: "PT-013", group: ARM_A, duration: 39, ongoing: true, events: [{ time: 20, type: "adverse_event" }, { time: 22, type: "partial_response" }] },
  { id: "PT-005", group: ARM_B, duration: 36, ongoing: false, events: [{ time: 36, type: "progressive_disease" }] },
  { id: "PT-016", group: ARM_A, duration: 34, ongoing: true, events: [{ time: 18, type: "partial_response" }] },
  { id: "PT-001", group: ARM_B, duration: 32, ongoing: false, events: [{ time: 9, type: "partial_response" }, { time: 32, type: "progressive_disease" }] },
  { id: "PT-020", group: ARM_A, duration: 30, ongoing: false, events: [{ time: 12, type: "adverse_event" }, { time: 30, type: "progressive_disease" }] },
  { id: "PT-009", group: ARM_B, duration: 28, ongoing: true, events: [{ time: 14, type: "partial_response" }] },
  { id: "PT-003", group: ARM_A, duration: 26, ongoing: false, events: [{ time: 26, type: "progressive_disease" }] },
  { id: "PT-018", group: ARM_B, duration: 24, ongoing: false, events: [{ time: 8, type: "partial_response" }, { time: 24, type: "progressive_disease" }] },
  { id: "PT-006", group: ARM_A, duration: 22, ongoing: false, events: [{ time: 10, type: "adverse_event" }, { time: 22, type: "progressive_disease" }] },
  { id: "PT-015", group: ARM_B, duration: 20, ongoing: false, events: [{ time: 20, type: "progressive_disease" }] },
  { id: "PT-010", group: ARM_A, duration: 18, ongoing: false, events: [{ time: 18, type: "progressive_disease" }] },
  { id: "PT-012", group: ARM_B, duration: 16, ongoing: false, events: [{ time: 8, type: "adverse_event" }, { time: 16, type: "progressive_disease" }] },
  { id: "PT-007", group: ARM_A, duration: 14, ongoing: false, events: [{ time: 14, type: "progressive_disease" }] },
  { id: "PT-014", group: ARM_B, duration: 12, ongoing: false, events: [{ time: 12, type: "progressive_disease" }] },
];

const ids = patients.map((p) => p.id);
const durations = patients.map((p) => p.duration);
const barColors = patients.map((p) => (p.group === ARM_A ? t.palette[0] : t.palette[1]));

// Event-type encoding: shape carries the primary meaning (colorblind-safe,
// works even if two hues get confused); color reinforces clinical semantics
// — progression uses the matte-red "bad" anchor, adverse event uses the
// amber "warning" anchor, response events use two cool, uncommitted hues.
const EVENT_COLOR = {
  partial_response: t.palette[5],
  complete_response: t.palette[7],
  progressive_disease: t.palette[4],
  adverse_event: t.amber,
};
const EVENT_LABEL = {
  partial_response: "Partial response",
  complete_response: "Complete response",
  progressive_disease: "Progressive disease",
  adverse_event: "Adverse event",
};

function trianglePath(cx, cy, r) {
  return `M ${cx} ${cy - r} L ${cx + r} ${cy + r * 0.85} L ${cx - r} ${cy + r * 0.85} Z`;
}
function diamondPath(cx, cy, r) {
  return `M ${cx} ${cy - r} L ${cx + r} ${cy} L ${cx} ${cy + r} L ${cx - r} ${cy} Z`;
}
function starPath(cx, cy, rOuter, rInner) {
  const pts = [];
  for (let i = 0; i < 10; i++) {
    const r = i % 2 === 0 ? rOuter : rInner;
    const angle = (Math.PI / 5) * i - Math.PI / 2;
    pts.push(`${cx + r * Math.cos(angle)},${cy + r * Math.sin(angle)}`);
  }
  return `M ${pts.join(" L ")} Z`;
}
function arrowPath(x, y, r) {
  return `M ${x} ${y - r} L ${x + r * 1.7} ${y} L ${x} ${y + r} Z`;
}

function EventMarker({ type, cx, cy, size }) {
  const color = EVENT_COLOR[type];
  switch (type) {
    case "partial_response":
      return <path d={trianglePath(cx, cy, size)} fill={color} stroke={t.pageBg} strokeWidth={1.5} />;
    case "complete_response":
      return <path d={starPath(cx, cy, size * 1.15, size * 0.48)} fill={color} stroke={t.pageBg} strokeWidth={1.2} />;
    case "progressive_disease":
      return <path d={diamondPath(cx, cy, size)} fill={color} stroke={t.pageBg} strokeWidth={1.5} />;
    case "adverse_event":
      return <circle cx={cx} cy={cy} r={size * 0.72} fill={color} stroke={t.pageBg} strokeWidth={1.2} />;
    default:
      return null;
  }
}

// The two longest-surviving patients (both Targeted Therapy) are the chart's
// clearest insight; called out with a bracket + caption rather than a heavier
// annotation so sorting/color still do most of the storytelling work.
const LONGEST_IDS = new Set([...patients].sort((a, b) => b.duration - a.duration).slice(0, 2).map((p) => p.id));

// Must render inside BarChart's ChartContainer to read its live scales.
function SwimmerOverlay() {
  const xScale = useXScale();
  const yScale = useYScale();
  if (!xScale || !yScale || typeof yScale.bandwidth !== "function") return null;
  const bw = yScale.bandwidth();
  const markerSize = Math.min(bw * 0.42, 13);

  const longestRows = patients
    .filter((p) => LONGEST_IDS.has(p.id))
    .map((p) => ({ cy: +yScale(p.id) + bw / 2, xEnd: xScale(p.duration) }))
    .sort((a, b) => a.cy - b.cy);

  return (
    <g>
      {patients.map((p) => {
        const bandTop = yScale(p.id);
        if (bandTop == null) return null;
        const cy = +bandTop + bw / 2;
        return (
          <g key={p.id}>
            {p.events.map((e, i) => (
              <EventMarker key={i} type={e.type} cx={xScale(e.time)} cy={cy} size={markerSize} />
            ))}
            {p.ongoing && <path d={arrowPath(xScale(p.duration), cy, markerSize * 1.05)} fill={t.ink} />}
          </g>
        );
      })}
      {longestRows.length === 2 && (
        <g>
          <path
            d={`M ${Math.max(longestRows[0].xEnd, longestRows[1].xEnd) + 14} ${longestRows[0].cy} h 5 V ${longestRows[1].cy} h -5`}
            fill="none"
            stroke={t.inkSoft}
            strokeWidth={1.25}
            opacity={0.6}
          />
          <text
            x={Math.max(longestRows[0].xEnd, longestRows[1].xEnd) + 24}
            y={(longestRows[0].cy + longestRows[1].cy) / 2}
            fontSize={11}
            fontStyle="italic"
            fill={t.inkSoft}
            dominantBaseline="middle"
          >
            Longest on study
          </text>
        </g>
      )}
    </g>
  );
}

function LegendSwatch({ color }) {
  return (
    <svg width={18} height={18}>
      <rect x={1} y={4} width={16} height={10} rx={2} fill={color} />
    </svg>
  );
}
function LegendMarker({ type }) {
  return (
    <svg width={18} height={18}>
      <EventMarker type={type} cx={9} cy={9} size={7} />
    </svg>
  );
}
function LegendArrow() {
  return (
    <svg width={18} height={18}>
      <path d={arrowPath(2, 9, 7.5)} fill={t.ink} />
    </svg>
  );
}

const LEGEND_ITEMS = [
  { key: "arm-a", render: <LegendSwatch color={t.palette[0]} />, label: ARM_A },
  { key: "arm-b", render: <LegendSwatch color={t.palette[1]} />, label: ARM_B },
  { key: "pr", render: <LegendMarker type="partial_response" />, label: EVENT_LABEL.partial_response },
  { key: "cr", render: <LegendMarker type="complete_response" />, label: EVENT_LABEL.complete_response },
  { key: "pd", render: <LegendMarker type="progressive_disease" />, label: EVENT_LABEL.progressive_disease },
  { key: "ae", render: <LegendMarker type="adverse_event" />, label: EVENT_LABEL.adverse_event },
  { key: "ongoing", render: <LegendArrow />, label: "Ongoing (censored)" },
];

const TITLE = "swimmer-clinical-timeline · javascript · muix · anyplot.ai";
const HEADER_HEIGHT = 160;

export default function Chart() {
  const { width: W, height: H } = window.ANYPLOT_SIZE;
  const chartHeight = H - HEADER_HEIGHT;

  return (
    <Box sx={{ width: W, height: H, bgcolor: t.pageBg }}>
      <Box sx={{ height: HEADER_HEIGHT, pt: "20px", pl: "56px", pr: "56px", boxSizing: "border-box" }}>
        <Typography sx={{ color: t.ink, fontSize: 22, fontWeight: 500 }}>{TITLE}</Typography>
        <Typography sx={{ color: t.inkSoft, fontSize: 14, mt: "4px" }}>
          Phase II oncology trial · 20 patients across two treatment arms, sorted by time on study
        </Typography>
        <Box sx={{ display: "flex", flexWrap: "wrap", gap: "20px", mt: "14px", alignItems: "center" }}>
          {LEGEND_ITEMS.map((item) => (
            <Box key={item.key} sx={{ display: "flex", alignItems: "center", gap: "6px" }}>
              {item.render}
              <Typography sx={{ color: t.inkSoft, fontSize: 13 }}>{item.label}</Typography>
            </Box>
          ))}
        </Box>
      </Box>

      <BarChart
        width={W}
        height={chartHeight}
        layout="horizontal"
        skipAnimation
        borderRadius={3}
        series={[
          {
            id: "duration",
            label: "Time on study",
            data: durations,
            valueFormatter: (v) => `${v} wk`,
          },
        ]}
        xAxis={[
          {
            scaleType: "linear",
            min: 0,
            max: 64,
            label: "Time on Study (weeks)",
            labelStyle: { fontSize: 16, fill: t.ink },
            tickLabelStyle: { fontSize: 14, fill: t.inkSoft },
            disableTicks: true,
            tickNumber: 5,
          },
        ]}
        yAxis={[
          {
            scaleType: "band",
            data: ids,
            colorMap: { type: "ordinal", values: ids, colors: barColors },
            tickLabelStyle: { fontSize: 13, fill: t.inkSoft },
            disableTicks: true,
            categoryGapRatio: 0.32,
          },
        ]}
        grid={{ vertical: true }}
        margin={{ top: 30, right: 70, bottom: 66, left: 92 }}
        slotProps={{ legend: { hidden: true } }}
        sx={{
          "& .MuiChartsAxis-line": { stroke: t.inkSoft },
          "& .MuiChartsGrid-line": { stroke: t.grid, opacity: 0.7 },
        }}
      >
        <SwimmerOverlay />
      </BarChart>
    </Box>
  );
}
Runnable source as JSON, for any HTTP client: https://api.anyplot.ai/specs/swimmer-clinical-timeline/muix/code. Any spec id and library id listed in llms-full.txt fit the same URL shape; every URL below is complete and callable.
{
  "spec_id": "swimmer-clinical-timeline",
  "language": "javascript",
  "library": "muix",
  "page": "https://anyplot.ai/swimmer-clinical-timeline/javascript/muix",
  "hub": "https://anyplot.ai/swimmer-clinical-timeline",
  "code_json": "https://api.anyplot.ai/specs/swimmer-clinical-timeline/muix/code",
  "spec_json": "https://api.anyplot.ai/specs/swimmer-clinical-timeline",
  "render_light_png": "https://storage.googleapis.com/anyplot-images/plots/swimmer-clinical-timeline/javascript/muix/plot-light.png",
  "render_dark_png": "https://storage.googleapis.com/anyplot-images/plots/swimmer-clinical-timeline/javascript/muix/plot-dark.png",
  "interactive_light_html": "https://storage.googleapis.com/anyplot-images/plots/swimmer-clinical-timeline/javascript/muix/plot-light.html",
  "interactive_dark_html": "https://storage.googleapis.com/anyplot-images/plots/swimmer-clinical-timeline/javascript/muix/plot-dark.html",
  "quality_score": 94.0,
  "license": "MIT",
  "guide": "https://anyplot.ai/llms.txt"
}
Part of Swimmer Plot for Clinical Trial Timelines on anyplot.ai.