The same plot in 14 other libraries — JavaScript: D3.js, Apache ECharts, Highcharts, MUI X Charts; Python: Altair, Bokeh, lets-plot, Matplotlib, Plotly, plotnine, Pygal, Seaborn; R: ggplot2; Julia: Makie.jl. Compare all 15 side by side: Basic Alluvial Diagram in Python, R, Julia and JavaScript.
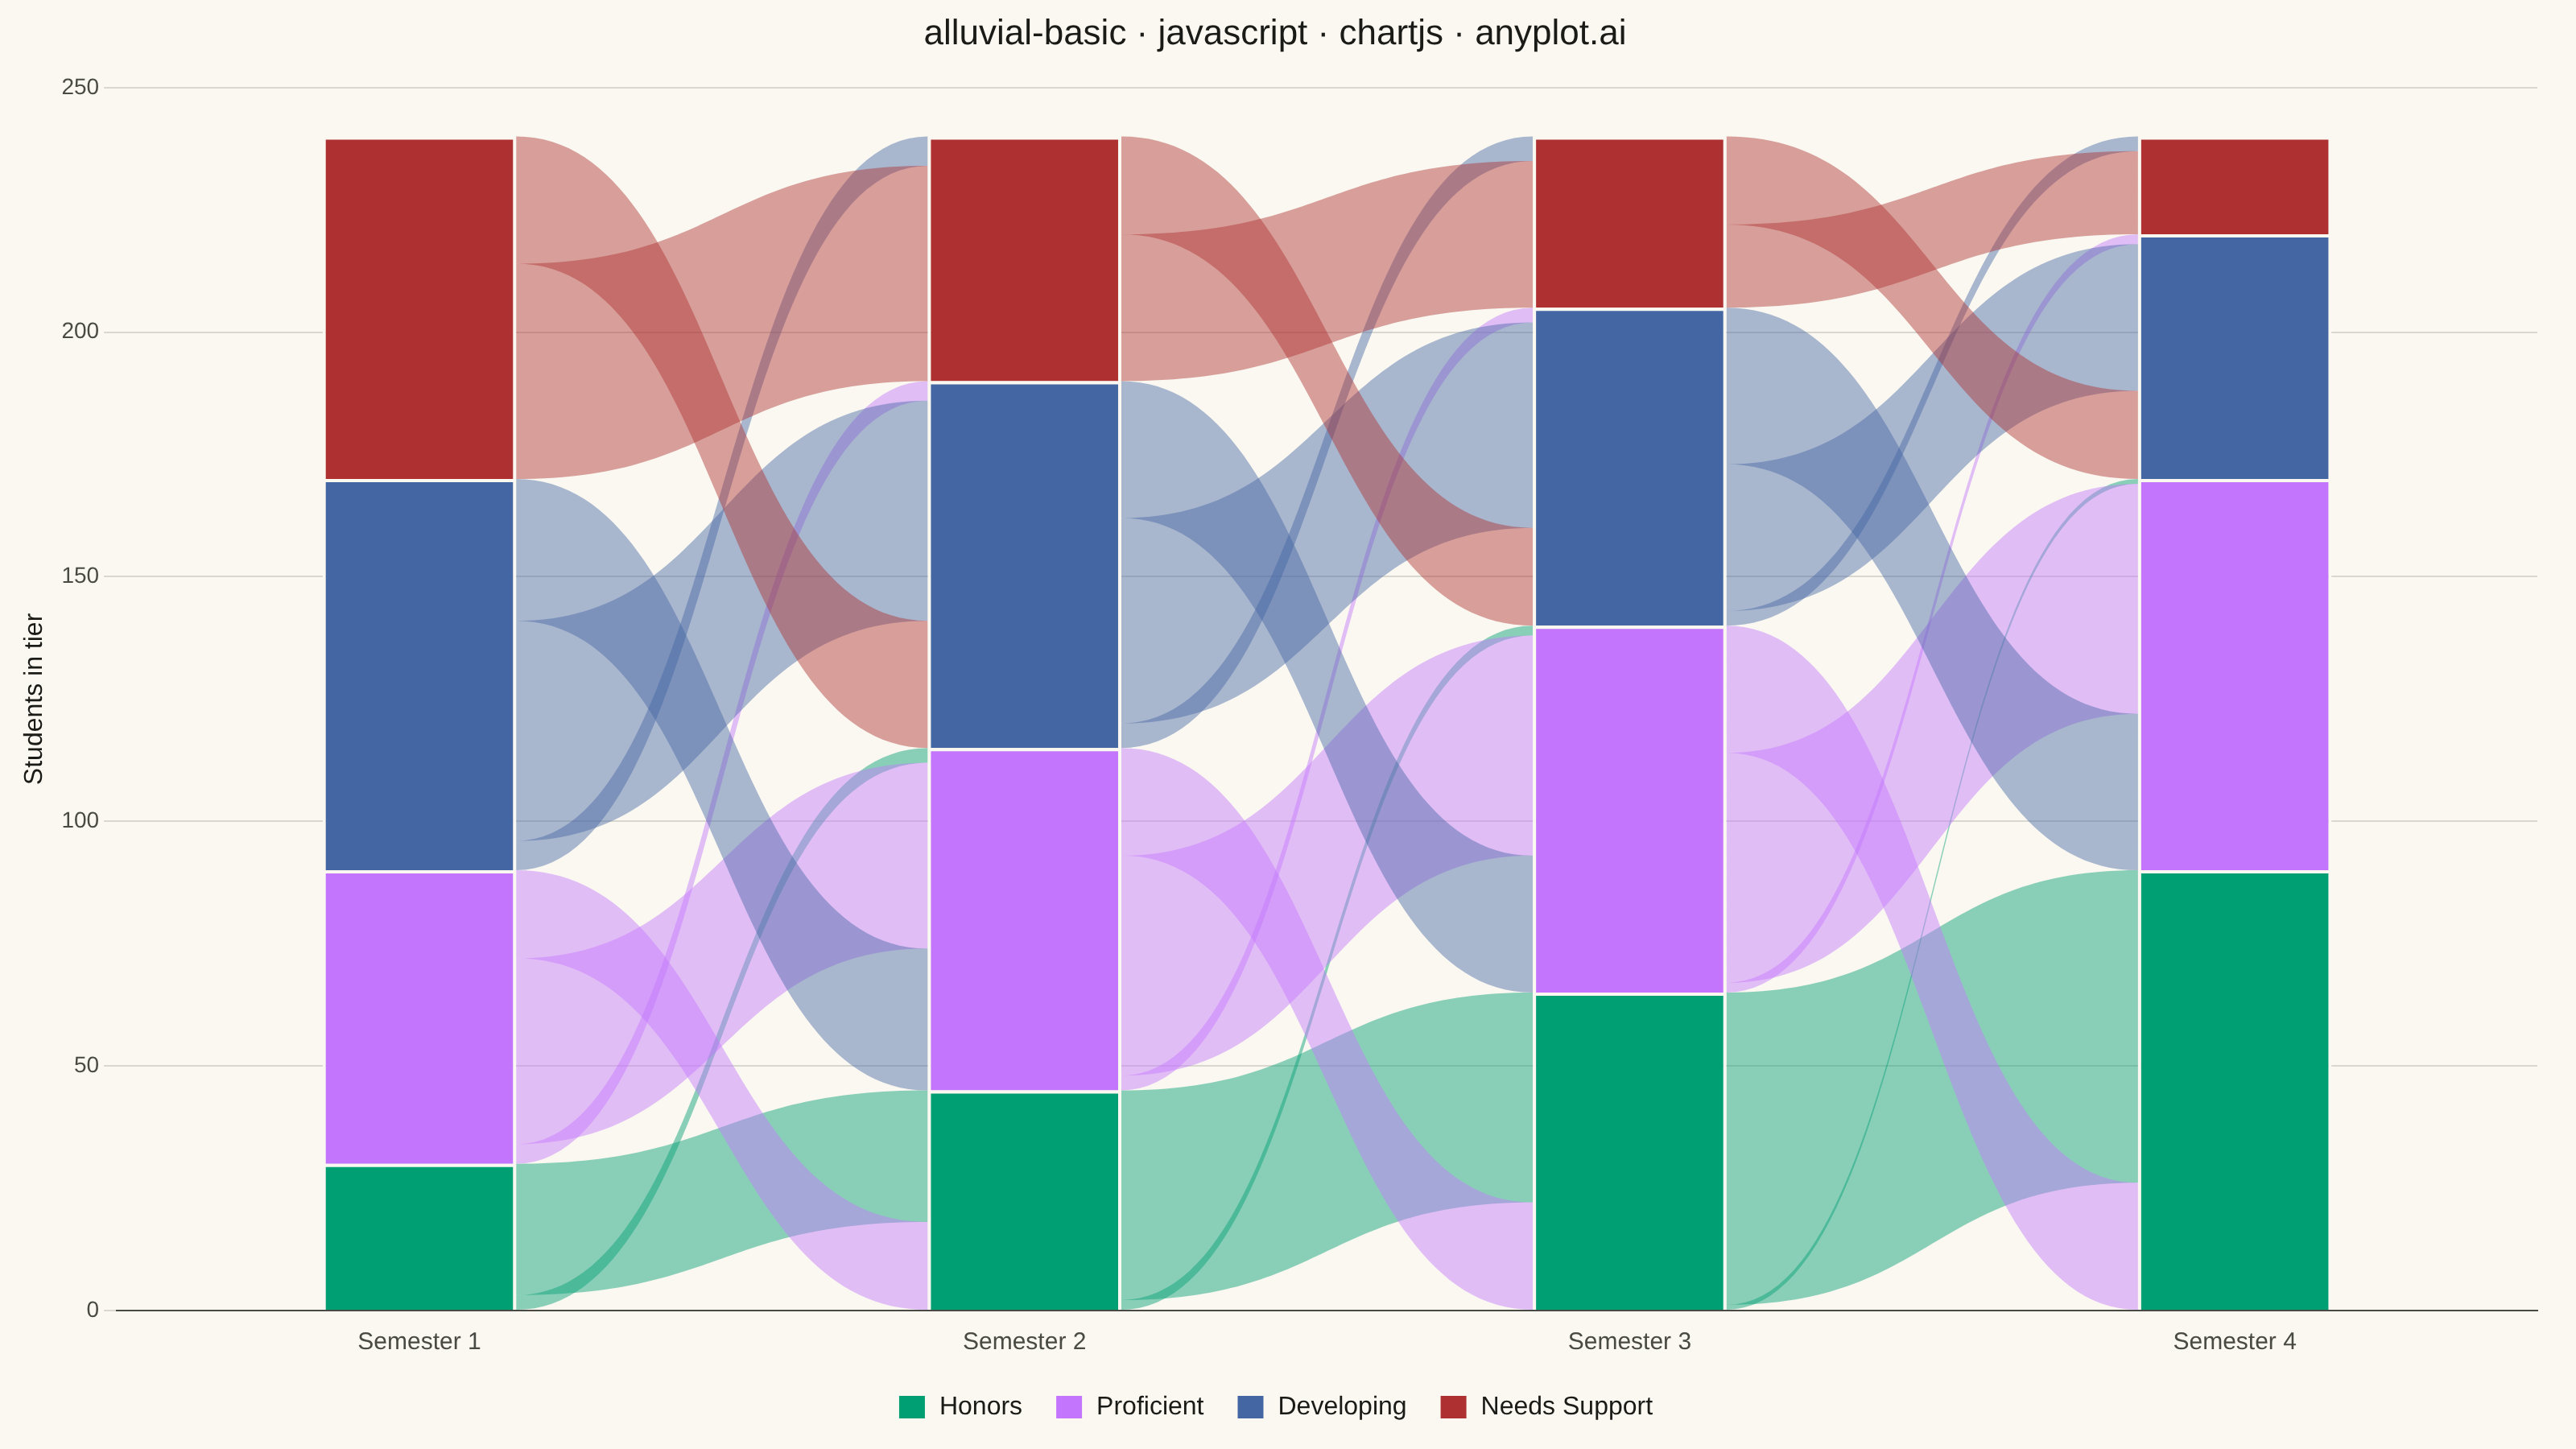
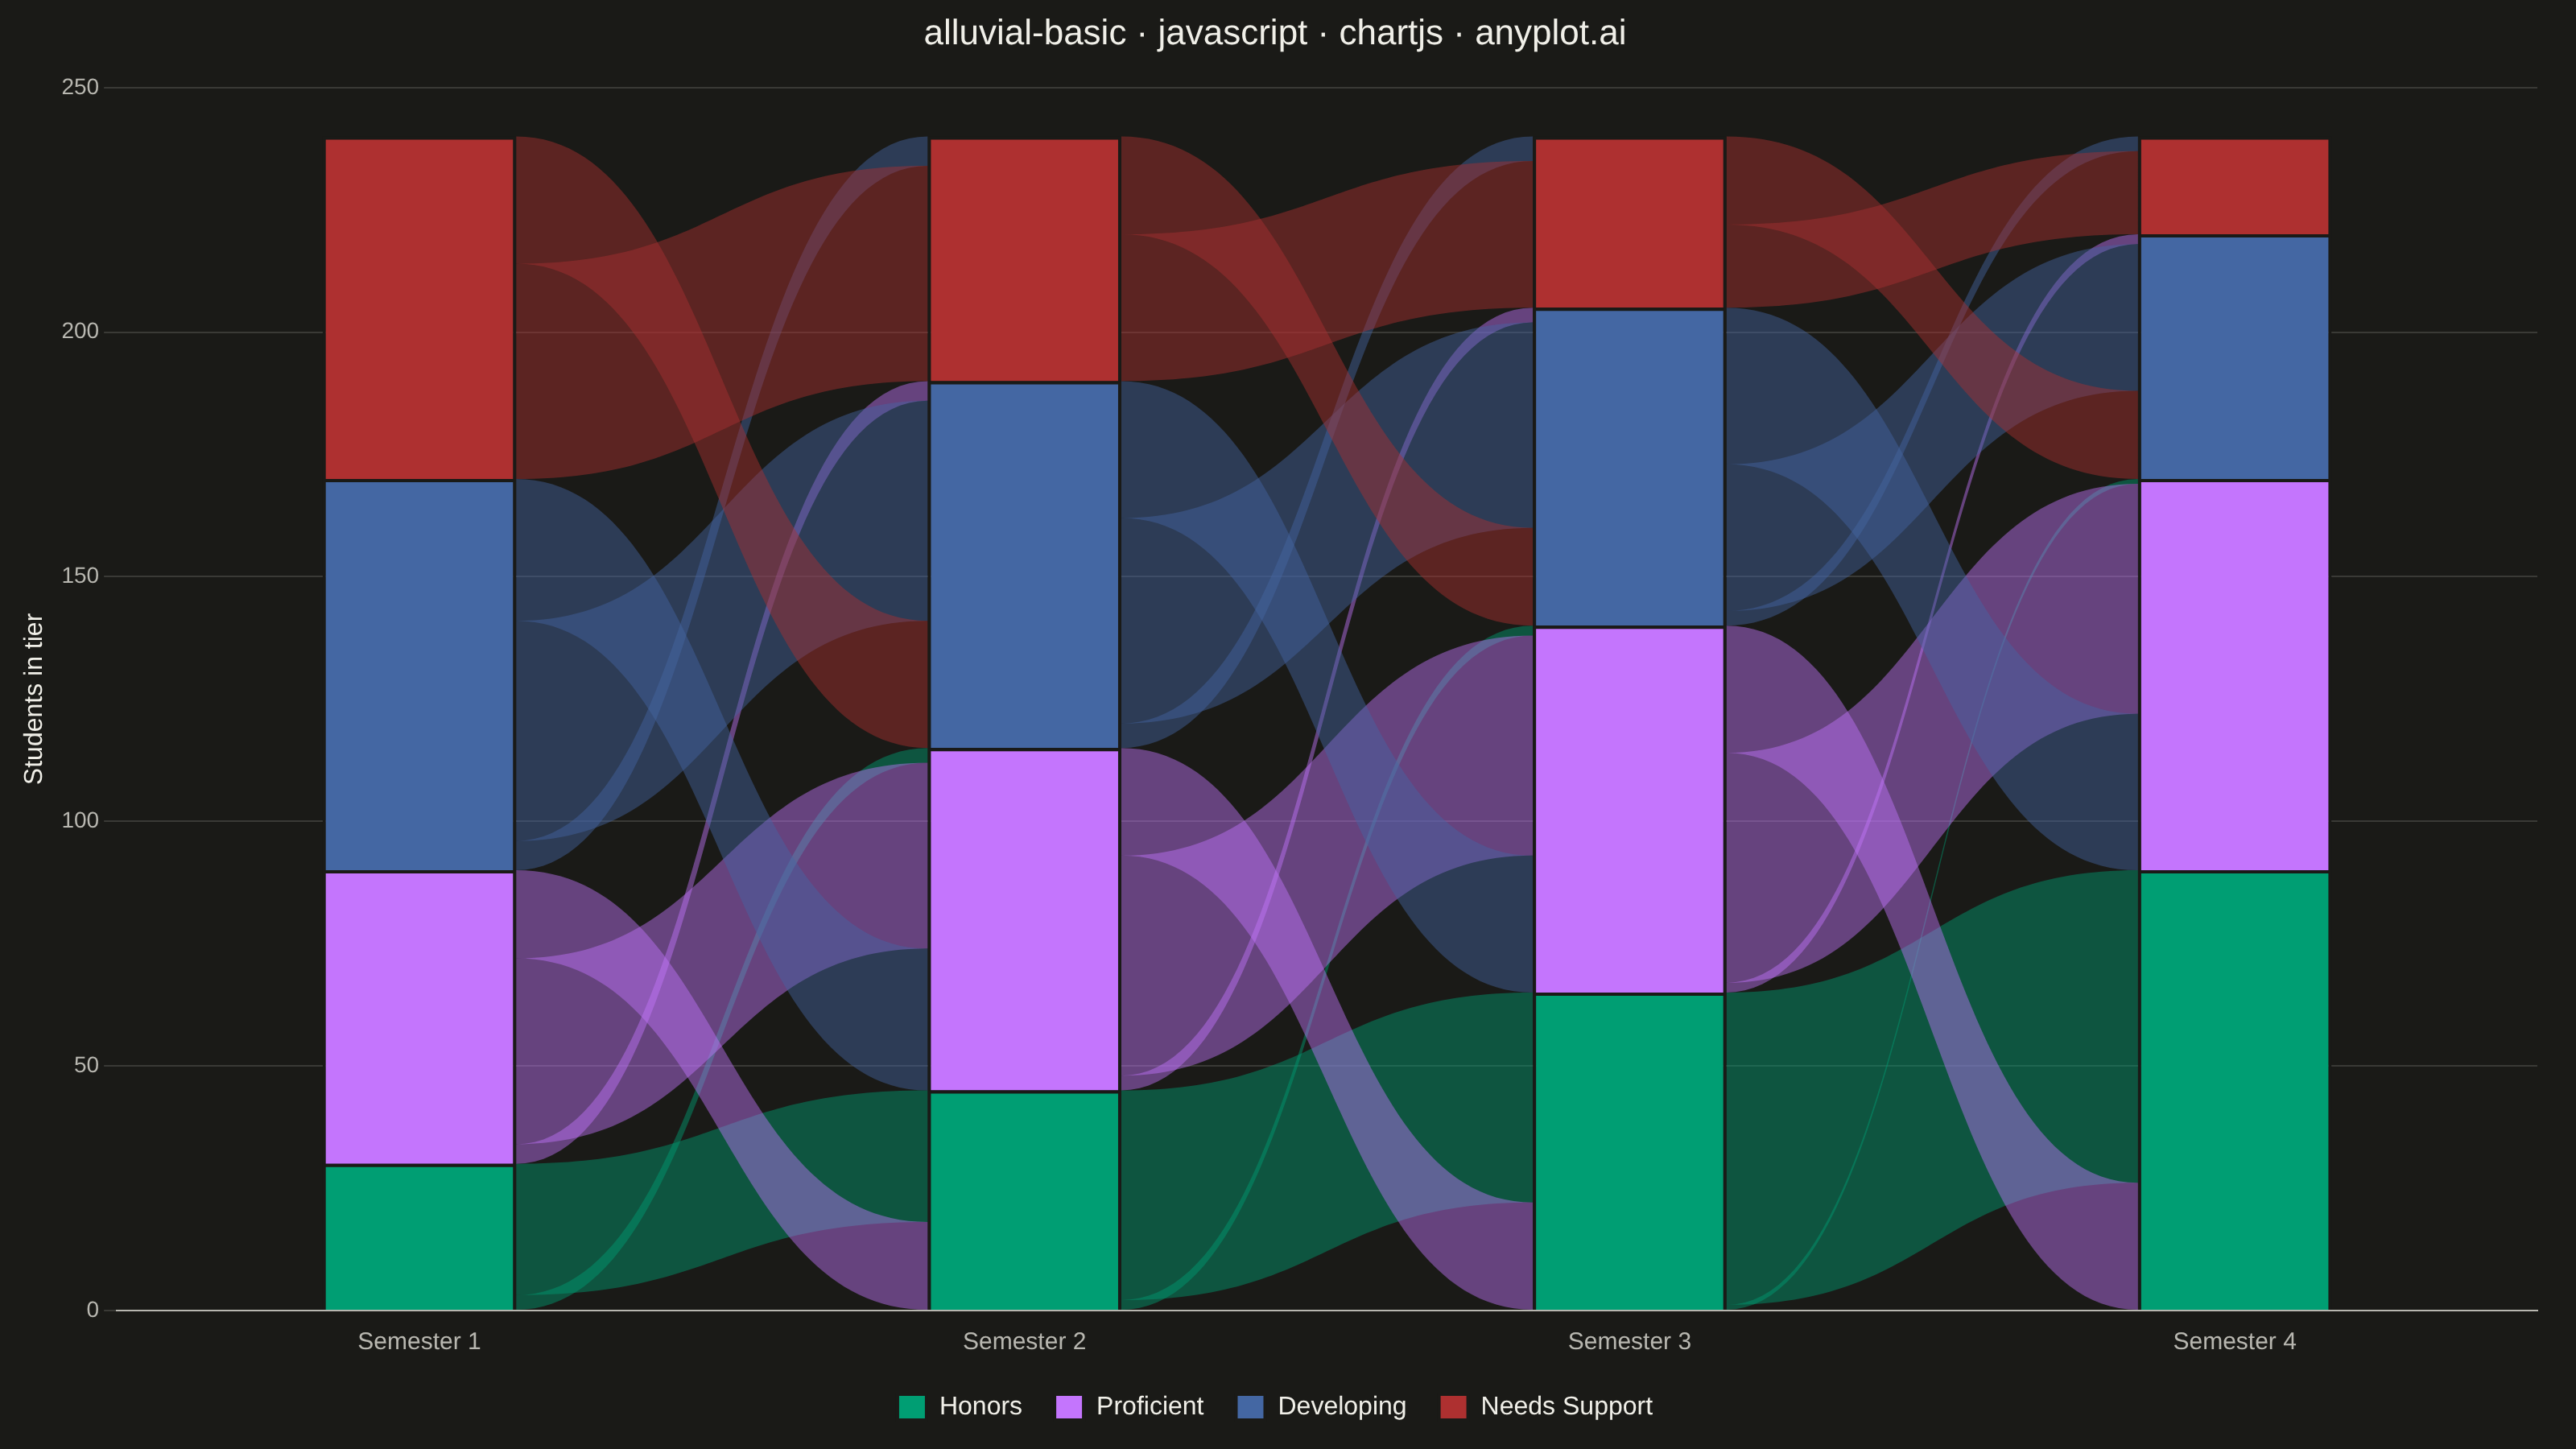
An alluvial diagram visualizes how entities flow or transition between discrete categories across multiple time points or ordered stages. Unlike general Sankey diagrams, alluvial diagrams enforce strict vertical ordering where each column represents a specific time step or category dimension. Bands connect related segments to show how proportions shift over time, making it ideal for tracking structural changes, migrations, and transitions in categorical data.
// anyplot.ai
// alluvial-basic: Basic Alluvial Diagram
// Library: chartjs 4.4.7 | JavaScript 22.23.2
// Quality: 95/100 | Created: 2026-09-02

const t = window.ANYPLOT_TOKENS;

// --- Data (in-memory, deterministic) ----------------------------------------
// Cohort of 240 students tracked across four semesters as they move between
// performance tiers. Each column sums to 240 — the alluvial reads as a
// conserved population reshuffling between tiers, not independent bars.
const semesters = ["Semester 1", "Semester 2", "Semester 3", "Semester 4"];

const tierNames = ["Honors", "Proficient", "Developing", "Needs Support"];
const tierColors = [t.palette[0], t.palette[1], t.palette[2], t.palette[4]];
const tierValues = [
  [30, 45, 65, 90], // Honors
  [60, 70, 75, 80], // Proficient
  [80, 75, 65, 50], // Developing
  [70, 50, 35, 20], // Needs Support
];

const tiers = tierNames.map((name, i) => ({
  name,
  color: tierColors[i],
  values: tierValues[i],
}));

// Per-gap transition matrices: transitions[gap][from][to] = number of students
// who were in tier `from` at semester `gap` and land in tier `to` at semester
// `gap + 1`. Movement is restricted to adjacent tiers (a student shifts by at
// most one rank per semester) and each row/column sums exactly to that tier's
// column total above, so the flow bands genuinely depict students crossing
// between tiers rather than each tier's own segment merely resizing.
const transitions = [
  // Semester 1 -> Semester 2
  [
    [27, 3, 0, 0],
    [18, 38, 4, 0],
    [0, 29, 45, 6],
    [0, 0, 26, 44],
  ],
  // Semester 2 -> Semester 3
  [
    [43, 2, 0, 0],
    [22, 45, 3, 0],
    [0, 28, 42, 5],
    [0, 0, 20, 30],
  ],
  // Semester 3 -> Semester 4
  [
    [64, 1, 0, 0],
    [26, 47, 2, 0],
    [0, 32, 30, 3],
    [0, 0, 18, 17],
  ],
];

// --- Flow ribbons: bezier bands for each actual tier-to-tier transition -----
const alluvialFlows = {
  id: "alluvialFlows",
  beforeDatasetsDraw(chart) {
    const { ctx } = chart;
    const numColumns = chart.data.labels.length;
    const numTiers = tiers.length;
    ctx.save();
    ctx.globalAlpha = 0.45;

    for (let gap = 0; gap < numColumns - 1; gap++) {
      const flowMatrix = transitions[gap];

      // Pixel span [top, bottom] of every tier's bar segment on both sides
      // of this gap, read straight from the stacked-bar geometry.
      const leftSpan = [];
      const rightSpan = [];
      for (let tierIdx = 0; tierIdx < numTiers; tierIdx++) {
        const leftBar = chart.getDatasetMeta(tierIdx).data[gap];
        const rightBar = chart.getDatasetMeta(tierIdx).data[gap + 1];
        leftSpan.push([
          Math.min(leftBar.y, leftBar.base),
          Math.max(leftBar.y, leftBar.base),
        ]);
        rightSpan.push([
          Math.min(rightBar.y, rightBar.base),
          Math.max(rightBar.y, rightBar.base),
        ]);
      }

      // Running top-of-next-band cursor within each tier's segment, so
      // multiple sub-bands stack without gaps or overlap.
      const leftCursor = leftSpan.map(([top]) => top);
      const rightCursor = rightSpan.map(([top]) => top);

      for (let from = 0; from < numTiers; from++) {
        const rowTotal = flowMatrix[from].reduce((sum, v) => sum + v, 0);
        const leftHeight = leftSpan[from][1] - leftSpan[from][0];

        for (let to = 0; to < numTiers; to++) {
          const amount = flowMatrix[from][to];
          if (amount === 0) continue;

          const colTotal = flowMatrix.reduce((sum, row) => sum + row[to], 0);
          const rightHeight = rightSpan[to][1] - rightSpan[to][0];

          const lTop = leftCursor[from];
          const lBot = lTop + (amount / rowTotal) * leftHeight;
          const rTop = rightCursor[to];
          const rBot = rTop + (amount / colTotal) * rightHeight;
          leftCursor[from] = lBot;
          rightCursor[to] = rBot;

          const leftBar = chart.getDatasetMeta(from).data[gap];
          const rightBar = chart.getDatasetMeta(to).data[gap + 1];
          const lx = leftBar.x + leftBar.width / 2;
          const rx = rightBar.x - rightBar.width / 2;
          const midX = (lx + rx) / 2;

          ctx.fillStyle = tiers[from].color;
          ctx.beginPath();
          ctx.moveTo(lx, lTop);
          ctx.bezierCurveTo(midX, lTop, midX, rTop, rx, rTop);
          ctx.lineTo(rx, rBot);
          ctx.bezierCurveTo(midX, rBot, midX, lBot, lx, lBot);
          ctx.closePath();
          ctx.fill();
        }
      }
    }
    ctx.restore();
  },
};

// --- Mount -------------------------------------------------------------------
const canvas = document.createElement("canvas");
document.getElementById("container").appendChild(canvas);

// --- Chart ---------------------------------------------------------------
new Chart(canvas, {
  type: "bar",
  data: {
    labels: semesters,
    datasets: tiers.map((tier) => ({
      label: tier.name,
      data: tier.values,
      backgroundColor: tier.color,
      borderColor: t.pageBg,
      borderWidth: 2,
      stack: "cohort",
      barPercentage: 1.0,
      categoryPercentage: 0.32,
    })),
  },
  options: {
    responsive: true,
    maintainAspectRatio: false,
    animation: false,
    layout: { padding: { top: 8, right: 24, bottom: 8, left: 8 } },
    plugins: {
      title: {
        display: true,
        text: "alluvial-basic · javascript · chartjs · anyplot.ai",
        color: t.ink,
        font: { size: 22, weight: "500" },
        padding: { bottom: 20 },
      },
      legend: {
        position: "bottom",
        labels: { color: t.ink, font: { size: 16 }, boxWidth: 18, padding: 20 },
      },
      tooltip: { enabled: false },
    },
    scales: {
      x: {
        stacked: true,
        ticks: { color: t.inkSoft, font: { size: 15 } },
        grid: { display: false },
        border: { color: t.inkSoft },
      },
      y: {
        stacked: true,
        beginAtZero: true,
        suggestedMax: 250,
        ticks: { color: t.inkSoft, font: { size: 14 } },
        grid: { color: t.grid },
        border: { display: false },
        title: {
          display: true,
          text: "Students in tier",
          color: t.ink,
          font: { size: 16 },
        },
      },
    },
  },
  plugins: [alluvialFlows],
});
Runnable source as JSON, for any HTTP client: https://api.anyplot.ai/specs/alluvial-basic/chartjs/code. Any spec id and library id listed in llms-full.txt fit the same URL shape; every URL below is complete and callable.
{
  "spec_id": "alluvial-basic",
  "language": "javascript",
  "library": "chartjs",
  "page": "https://anyplot.ai/alluvial-basic/javascript/chartjs",
  "hub": "https://anyplot.ai/alluvial-basic",
  "code_json": "https://api.anyplot.ai/specs/alluvial-basic/chartjs/code",
  "spec_json": "https://api.anyplot.ai/specs/alluvial-basic",
  "render_light_png": "https://storage.googleapis.com/anyplot-images/plots/alluvial-basic/javascript/chartjs/plot-light.png",
  "render_dark_png": "https://storage.googleapis.com/anyplot-images/plots/alluvial-basic/javascript/chartjs/plot-dark.png",
  "interactive_light_html": "https://storage.googleapis.com/anyplot-images/plots/alluvial-basic/javascript/chartjs/plot-light.html",
  "interactive_dark_html": "https://storage.googleapis.com/anyplot-images/plots/alluvial-basic/javascript/chartjs/plot-dark.html",
  "quality_score": 95.0,
  "license": "MIT",
  "guide": "https://anyplot.ai/llms.txt"
}
Part of Basic Alluvial Diagram on anyplot.ai.