The same plot in 14 other libraries — JavaScript: Chart.js, D3.js, Apache ECharts, Highcharts; Python: Altair, Bokeh, lets-plot, Matplotlib, Plotly, plotnine, Pygal, Seaborn; R: ggplot2; Julia: Makie.jl. Compare all 15 side by side: Basic Alluvial Diagram in Python, R, Julia and JavaScript.
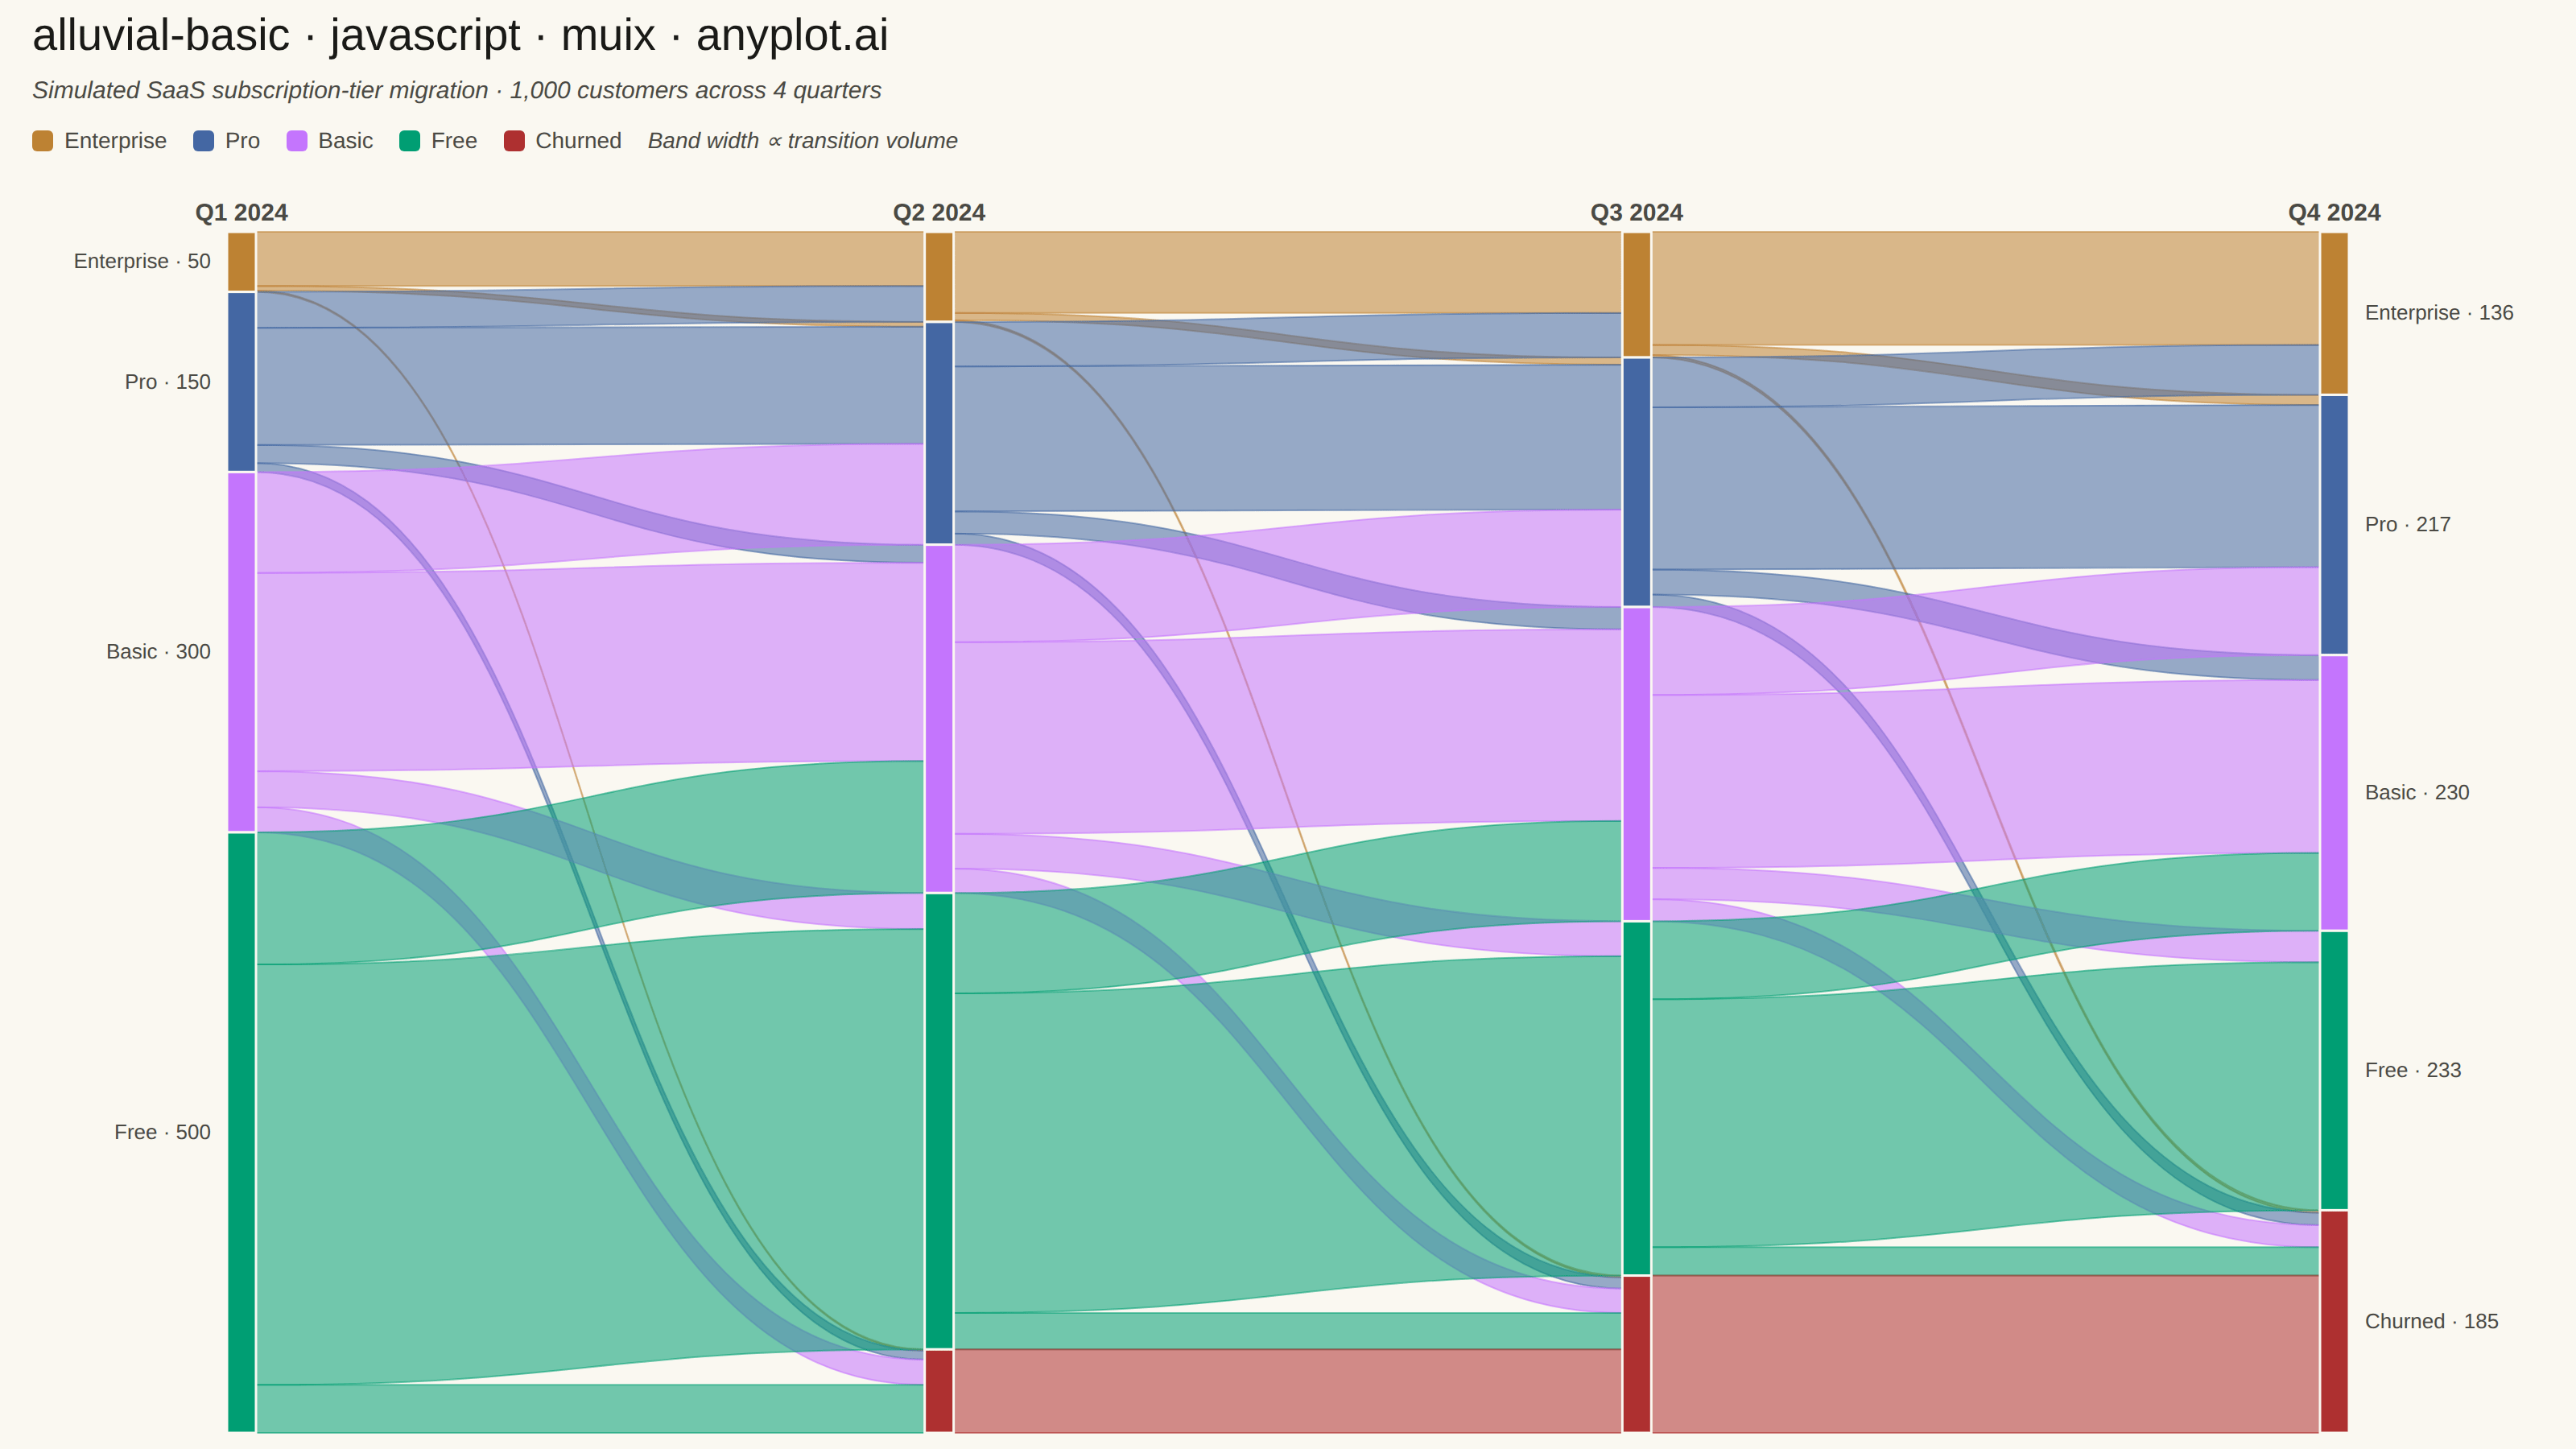
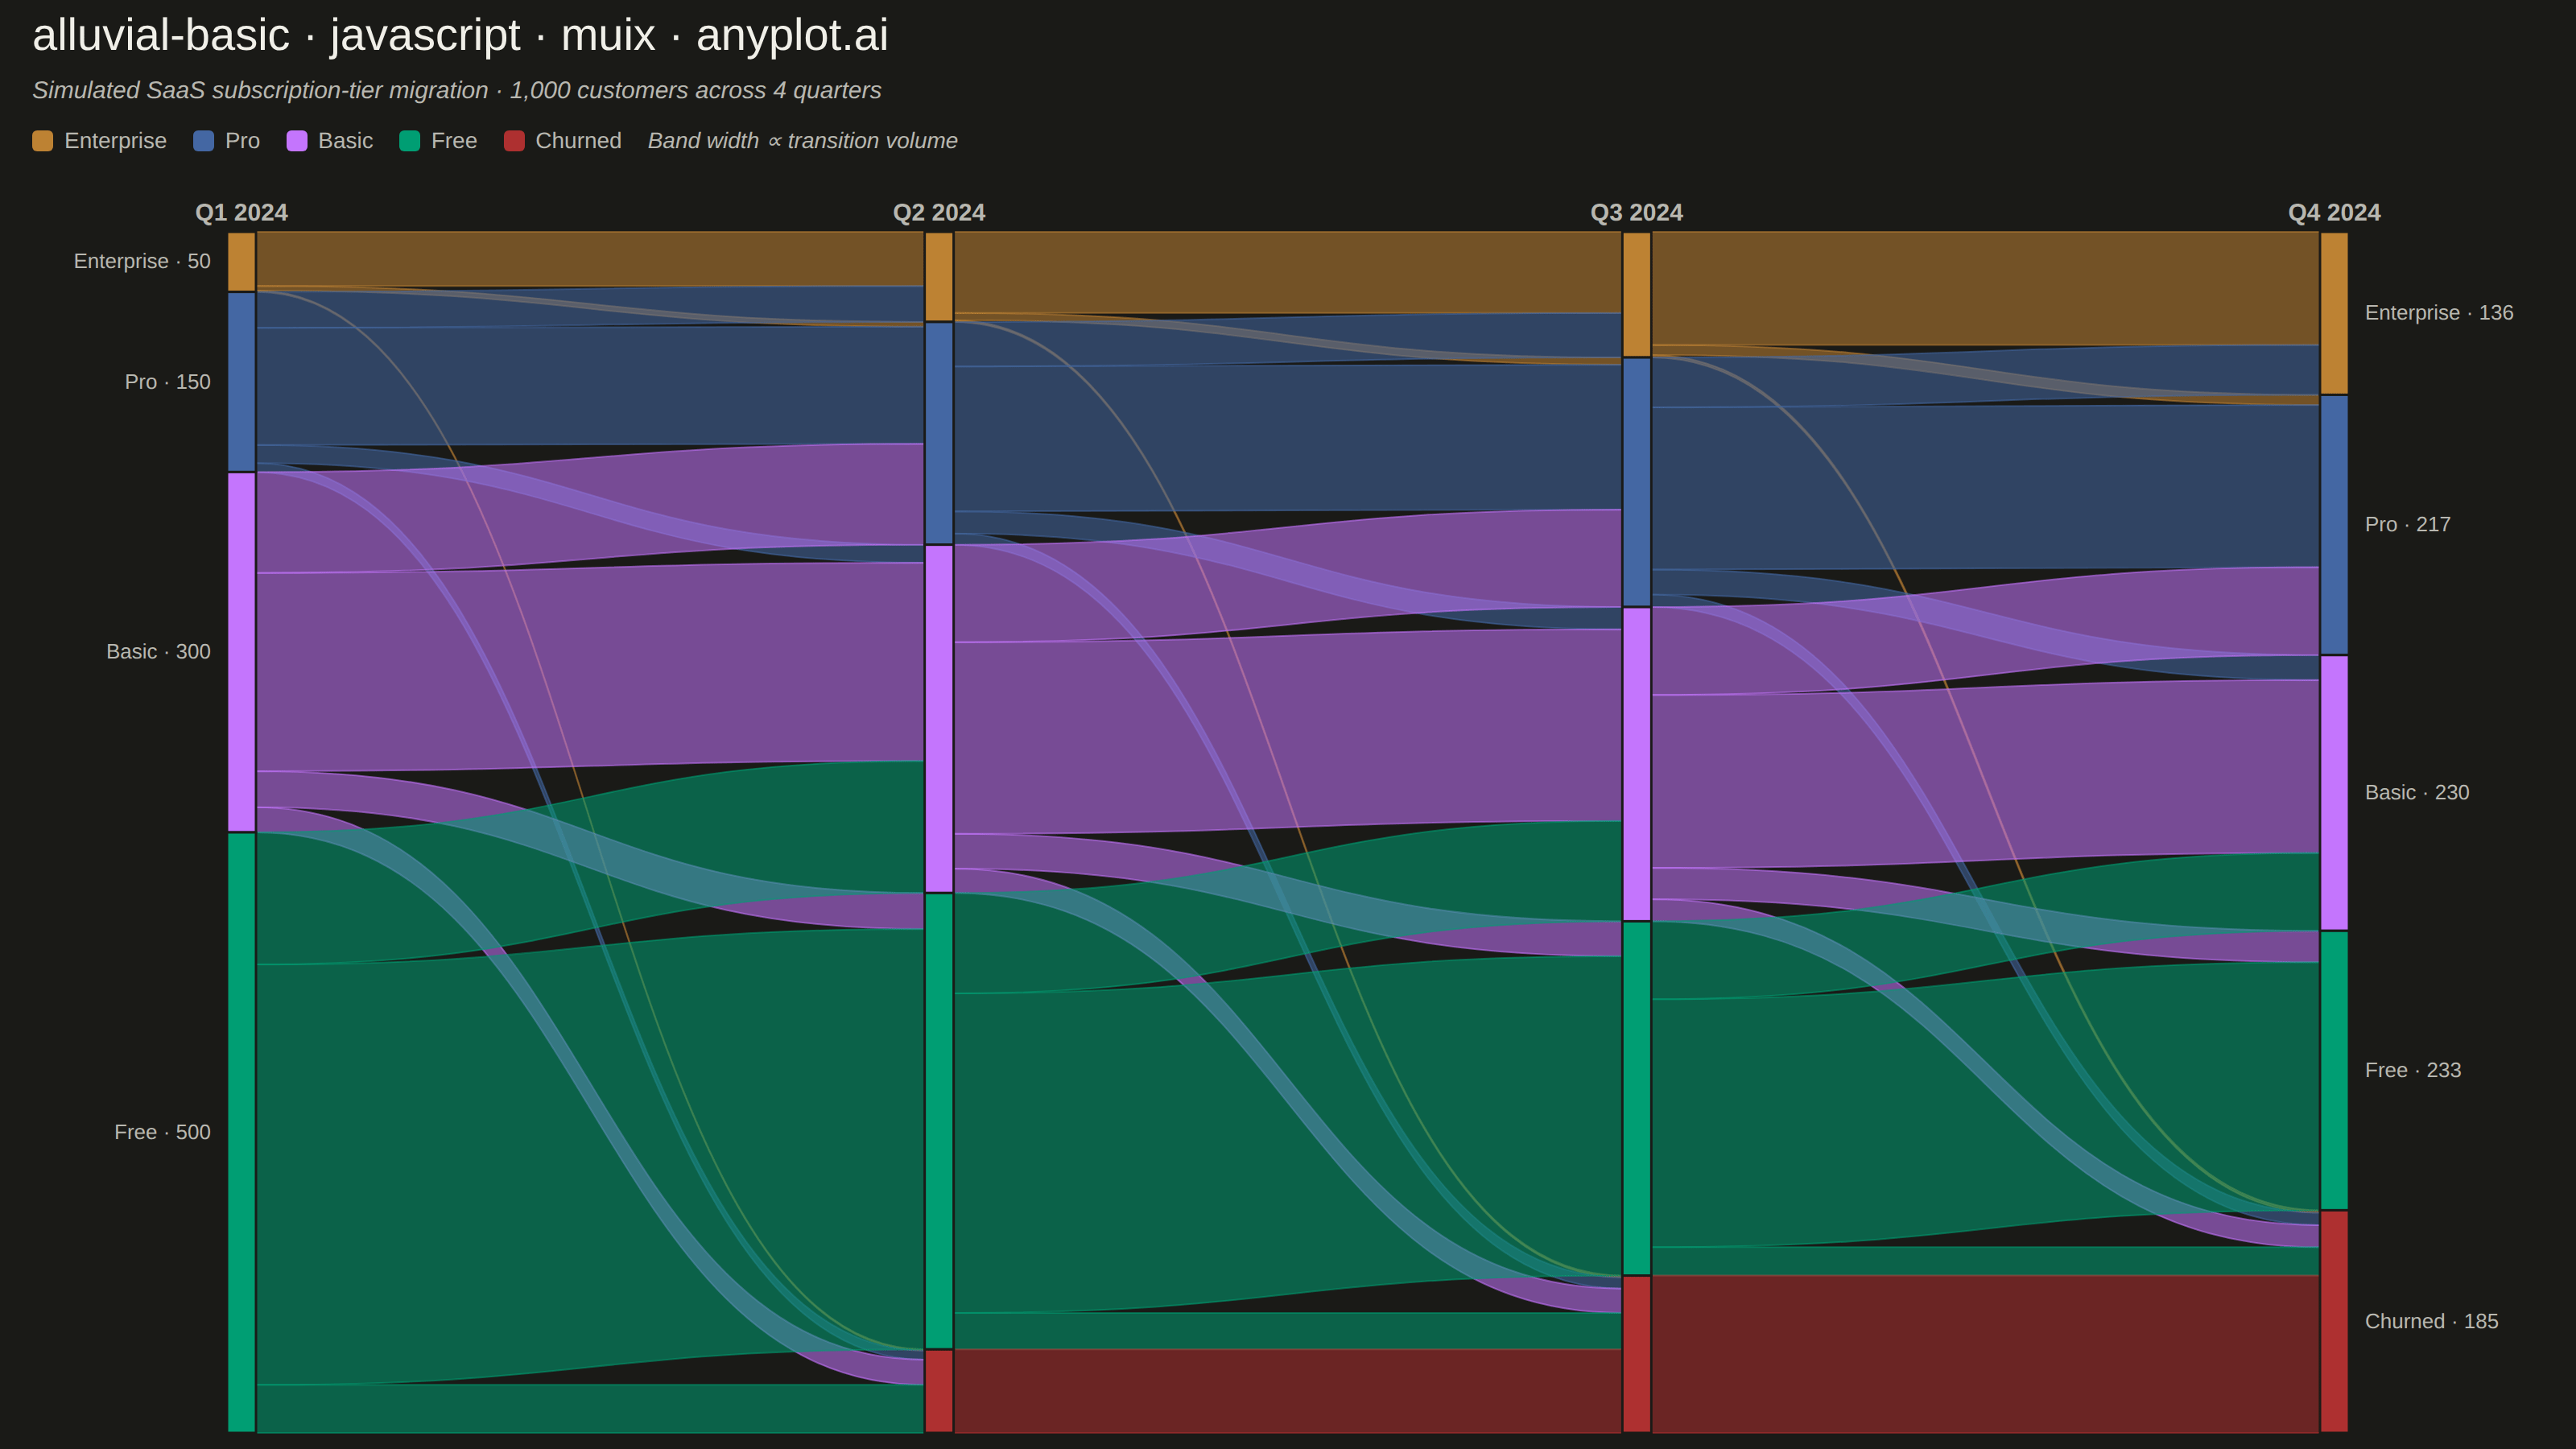
An alluvial diagram visualizes how entities flow or transition between discrete categories across multiple time points or ordered stages. Unlike general Sankey diagrams, alluvial diagrams enforce strict vertical ordering where each column represents a specific time step or category dimension. Bands connect related segments to show how proportions shift over time, making it ideal for tracking structural changes, migrations, and transitions in categorical data.
// anyplot.ai
// alluvial-basic: Basic Alluvial Diagram
// Library: muix 7.29.1 | JavaScript 22.23.2
// Quality: 88/100 | Created: 2026-09-02
import * as React from "react";
import { ChartContainer } from "@mui/x-charts/ChartContainer";
import { ChartsXAxis } from "@mui/x-charts/ChartsXAxis";
import { useXScale, useYScale, useDrawingArea } from "@mui/x-charts/hooks";

const t = window.ANYPLOT_TOKENS;

// --- Data: SaaS subscription-tier migration across four quarters -----------
// A Markov-style transition matrix drives every quarter-to-quarter step, so
// node values (populations) and flow values (transitions) stay perfectly
// consistent by construction — no separate bookkeeping needed.
const CATEGORIES = ["Free", "Basic", "Pro", "Enterprise", "Churned"];
// Visual stack order, top to bottom: higher tiers rise to the top of each
// column, churn sinks to the bottom.
const STACK_ORDER = ["Enterprise", "Pro", "Basic", "Free", "Churned"];
const TIME_POINTS = ["Q1 2024", "Q2 2024", "Q3 2024", "Q4 2024"];

// Only adjacent-tier upgrades/downgrades (plus churn, which can originate
// from any paid tier) — skip-tier jumps like Enterprise <-> Free would both
// be unrealistic customer behavior and force ribbons into wide, crossing
// detours that muddy the diagram. A small win-back rate (Churned -> Free)
// keeps churn from being a fully absorbing state, matching real SaaS
// reactivation behavior.
const TRANSITION = {
  Free: { Free: 0.7, Basic: 0.22, Pro: 0, Enterprise: 0, Churned: 0.08 },
  Basic: { Free: 0.1, Basic: 0.55, Pro: 0.28, Enterprise: 0, Churned: 0.07 },
  Pro: { Free: 0, Basic: 0.1, Pro: 0.65, Enterprise: 0.2, Churned: 0.05 },
  Enterprise: { Free: 0, Basic: 0, Pro: 0.08, Enterprise: 0.9, Churned: 0.02 },
  Churned: { Free: 0.03, Basic: 0, Pro: 0, Enterprise: 0, Churned: 0.97 },
};

const INITIAL_POPULATION = {
  Free: 500,
  Basic: 300,
  Pro: 150,
  Enterprise: 50,
  Churned: 0,
};
const TOTAL = CATEGORIES.reduce((sum, cat) => sum + INITIAL_POPULATION[cat], 0);

const nextPopulation = (pop) => {
  const next = {};
  CATEGORIES.forEach((to) => {
    next[to] = CATEGORIES.reduce(
      (sum, from) => sum + pop[from] * TRANSITION[from][to],
      0,
    );
  });
  return next;
};

const POPULATIONS = [INITIAL_POPULATION];
for (let i = 1; i < TIME_POINTS.length; i += 1) {
  POPULATIONS.push(nextPopulation(POPULATIONS[i - 1]));
}

// Stack each column's categories (top to bottom) into cumulative [top,
// bottom] value-space extents — shared by both the node rects and the flow
// ribbons that attach to them.
const stackExtents = (pop) => {
  let cursor = TOTAL;
  const extents = {};
  STACK_ORDER.forEach((cat) => {
    const bottom = cursor - pop[cat];
    extents[cat] = { top: cursor, bottom };
    cursor = bottom;
  });
  return extents;
};

const NODE_EXTENTS = POPULATIONS.map(stackExtents);

// Subdivide each node's extent among its flows, ordered by the counterpart
// category's stack rank — this keeps ribbons visually coherent instead of
// crossing more than the tier changes themselves require.
const buildFlows = () => {
  const flows = [];
  for (let step = 0; step < TIME_POINTS.length - 1; step += 1) {
    const srcCol = step;
    const dstCol = step + 1;
    const outCursor = {};
    const inCursor = {};
    STACK_ORDER.forEach((cat) => {
      outCursor[cat] = NODE_EXTENTS[srcCol][cat].top;
      inCursor[cat] = NODE_EXTENTS[dstCol][cat].top;
    });
    STACK_ORDER.forEach((from) => {
      STACK_ORDER.forEach((to) => {
        const rate = TRANSITION[from][to];
        if (!rate) return;
        const value = POPULATIONS[srcCol][from] * rate;
        if (value < 0.5) return;
        const srcTop = outCursor[from];
        const srcBottom = srcTop - value;
        outCursor[from] = srcBottom;
        const dstTop = inCursor[to];
        const dstBottom = dstTop - value;
        inCursor[to] = dstBottom;
        flows.push({
          step,
          from,
          to,
          value,
          srcTop,
          srcBottom,
          dstTop,
          dstBottom,
        });
      });
    });
  }
  return flows;
};

const FLOWS = buildFlows();

// First series is ALWAYS brand green; "Churned" is the semantic exception
// for loss (see default-style-guide "Semantic exception").
const CATEGORY_COLOR = {
  Free: t.palette[0],
  Basic: t.palette[1],
  Pro: t.palette[2],
  Enterprise: t.palette[3],
  Churned: t.palette[4],
};

const NODE_W = 18;

// Compact codes for the mid-diagram node chips (Q2/Q3) — short enough to sit
// centered on the narrow node column without swallowing the ribbons on
// either side.
const CATEGORY_ABBR = {
  Free: "Free",
  Basic: "Basic",
  Pro: "Pro",
  Enterprise: "Ent",
  Churned: "Chu",
};
const MID_LABEL_MIN_HEIGHT = 16;
const MID_LABEL_FONT = 10;

// --- Custom SVG layers, positioned via the chart's own scales --------------
function AlluvialFlows() {
  const xScale = useXScale();
  const yScale = useYScale();
  return (
    <g data-drawing-container>
      {FLOWS.map((f, i) => {
        const x1 = xScale(TIME_POINTS[f.step]) + NODE_W / 2;
        const x2 = xScale(TIME_POINTS[f.step + 1]) - NODE_W / 2;
        const midX = (x1 + x2) / 2;
        const ySrcTop = yScale(f.srcTop);
        const ySrcBottom = yScale(f.srcBottom);
        const yDstTop = yScale(f.dstTop);
        const yDstBottom = yScale(f.dstBottom);
        return (
          <path
            key={`flow-${i}`}
            d={`M ${x1} ${ySrcTop} C ${midX} ${ySrcTop}, ${midX} ${yDstTop}, ${x2} ${yDstTop} L ${x2} ${yDstBottom} C ${midX} ${yDstBottom}, ${midX} ${ySrcBottom}, ${x1} ${ySrcBottom} Z`}
            fill={CATEGORY_COLOR[f.from]}
            fillOpacity={0.55}
            stroke={CATEGORY_COLOR[f.from]}
            strokeOpacity={0.55}
            strokeWidth={1}
          />
        );
      })}
    </g>
  );
}

function AlluvialNodes() {
  const xScale = useXScale();
  const yScale = useYScale();
  return (
    <g data-drawing-container>
      {TIME_POINTS.map((timePoint, colIndex) => {
        const cx = xScale(timePoint);
        const isFirst = colIndex === 0;
        const isLast = colIndex === TIME_POINTS.length - 1;
        return STACK_ORDER.map((cat) => {
          const value = POPULATIONS[colIndex][cat];
          if (value < 0.5) return null;
          const { top, bottom } = NODE_EXTENTS[colIndex][cat];
          const yTop = yScale(top);
          const yBottom = yScale(bottom);
          const midY = (yTop + yBottom) / 2;
          const segmentH = yBottom - yTop;
          const showMidLabel =
            !isFirst && !isLast && segmentH >= MID_LABEL_MIN_HEIGHT;
          const midLabel = CATEGORY_ABBR[cat];
          const midPillW = midLabel.length * MID_LABEL_FONT * 0.62 + 10;
          const midPillH = MID_LABEL_FONT + 8;
          return (
            <React.Fragment key={`${timePoint}-${cat}`}>
              <rect
                x={cx - NODE_W / 2}
                y={yTop}
                width={NODE_W}
                height={segmentH}
                fill={CATEGORY_COLOR[cat]}
                stroke={t.pageBg}
                strokeWidth={1.5}
              />
              {(isFirst || isLast) && (
                <text
                  x={isFirst ? cx - NODE_W / 2 - 10 : cx + NODE_W / 2 + 10}
                  y={midY + 4}
                  textAnchor={isFirst ? "end" : "start"}
                  fontSize={13}
                  fill={t.inkSoft}
                >
                  {`${cat} · ${Math.round(value)}`}
                </text>
              )}
              {showMidLabel && (
                <>
                  <rect
                    x={cx - midPillW / 2}
                    y={midY - midPillH / 2}
                    width={midPillW}
                    height={midPillH}
                    rx={midPillH / 2}
                    fill={t.pageBg}
                    opacity={0.92}
                  />
                  <text
                    x={cx}
                    y={midY + MID_LABEL_FONT / 2 - 1}
                    textAnchor="middle"
                    fontSize={MID_LABEL_FONT}
                    fill={t.inkSoft}
                  >
                    {midLabel}
                  </text>
                </>
              )}
            </React.Fragment>
          );
        });
      })}
    </g>
  );
}

function ValueAxisTitle() {
  const { top, height } = useDrawingArea();
  const cy = top + height / 2;
  return (
    <text
      x={16}
      y={cy}
      textAnchor="middle"
      fontSize={13}
      fill={t.inkSoft}
      transform={`rotate(-90, 16, ${cy})`}
    >
      Customers
    </text>
  );
}

// --- Title + legend chrome ---------------------------------------------------
const TITLE = "alluvial-basic · javascript · muix · anyplot.ai";
const TITLE_FONT_DEFAULT = 28;
const titleFontSize =
  TITLE.length > 67
    ? Math.round(TITLE_FONT_DEFAULT * (67 / TITLE.length))
    : TITLE_FONT_DEFAULT;
const SUBTITLE =
  "Simulated SaaS subscription-tier migration · 1,000 customers across 4 quarters";
const TITLE_H = 44;
const SUBTITLE_H = 26;
const LEGEND_H = 34;

function Legend() {
  return (
    <div
      style={{
        height: LEGEND_H,
        display: "flex",
        alignItems: "center",
        gap: "16px",
        flexWrap: "wrap",
      }}
    >
      {STACK_ORDER.map((cat) => (
        <div
          key={cat}
          style={{ display: "flex", alignItems: "center", gap: "7px" }}
        >
          <span
            style={{
              width: "13px",
              height: "13px",
              borderRadius: "3px",
              backgroundColor: CATEGORY_COLOR[cat],
              display: "inline-block",
            }}
          />
          <span style={{ fontSize: "14px", color: t.inkSoft }}>{cat}</span>
        </div>
      ))}
      <span style={{ fontSize: "14px", color: t.inkSoft, fontStyle: "italic" }}>
        Band width ∝ transition volume
      </span>
    </div>
  );
}

// --- Chart (default-exported component — the harness mounts it) ------------
export default function Chart() {
  const { width, height } = window.ANYPLOT_SIZE;
  const chartHeight = height - TITLE_H - SUBTITLE_H - LEGEND_H;

  return (
    <div style={{ width, height, display: "flex", flexDirection: "column" }}>
      <div style={{ paddingLeft: "20px" }}>
        <div
          style={{
            height: `${TITLE_H}px`,
            lineHeight: `${TITLE_H}px`,
            fontSize: `${titleFontSize}px`,
            fontWeight: 500,
            color: t.ink,
          }}
        >
          {TITLE}
        </div>
        <div
          style={{
            height: `${SUBTITLE_H}px`,
            lineHeight: `${SUBTITLE_H}px`,
            fontSize: "15px",
            fontStyle: "italic",
            color: t.inkSoft,
          }}
        >
          {SUBTITLE}
        </div>
        <Legend />
      </div>
      <ChartContainer
        width={width}
        height={chartHeight}
        series={[]}
        margin={{ top: 40, bottom: 10, left: 150, right: 150 }}
        xAxis={[
          {
            id: "time",
            scaleType: "point",
            data: TIME_POINTS,
            position: "top",
            disableLine: true,
            disableTicks: true,
            tickLabelStyle: { fontSize: 15, fill: t.inkSoft, fontWeight: 600 },
          },
        ]}
        yAxis={[{ id: "value", scaleType: "linear", min: 0, max: TOTAL }]}
        skipAnimation
      >
        <ChartsXAxis axisId="time" />
        <ValueAxisTitle />
        <AlluvialFlows />
        <AlluvialNodes />
      </ChartContainer>
    </div>
  );
}
Runnable source as JSON, for any HTTP client: https://api.anyplot.ai/specs/alluvial-basic/muix/code. Any spec id and library id listed in llms-full.txt fit the same URL shape; every URL below is complete and callable.
{
  "spec_id": "alluvial-basic",
  "language": "javascript",
  "library": "muix",
  "page": "https://anyplot.ai/alluvial-basic/javascript/muix",
  "hub": "https://anyplot.ai/alluvial-basic",
  "code_json": "https://api.anyplot.ai/specs/alluvial-basic/muix/code",
  "spec_json": "https://api.anyplot.ai/specs/alluvial-basic",
  "render_light_png": "https://storage.googleapis.com/anyplot-images/plots/alluvial-basic/javascript/muix/plot-light.png",
  "render_dark_png": "https://storage.googleapis.com/anyplot-images/plots/alluvial-basic/javascript/muix/plot-dark.png",
  "interactive_light_html": "https://storage.googleapis.com/anyplot-images/plots/alluvial-basic/javascript/muix/plot-light.html",
  "interactive_dark_html": "https://storage.googleapis.com/anyplot-images/plots/alluvial-basic/javascript/muix/plot-dark.html",
  "quality_score": 88.0,
  "license": "MIT",
  "guide": "https://anyplot.ai/llms.txt"
}
Part of Basic Alluvial Diagram on anyplot.ai.