The same plot in 14 other libraries — JavaScript: Chart.js, Apache ECharts, Highcharts, MUI X Charts; Python: Altair, Bokeh, lets-plot, Matplotlib, Plotly, plotnine, Pygal, Seaborn; R: ggplot2; Julia: Makie.jl. Compare all 15 side by side: Basic Alluvial Diagram in Python, R, Julia and JavaScript.
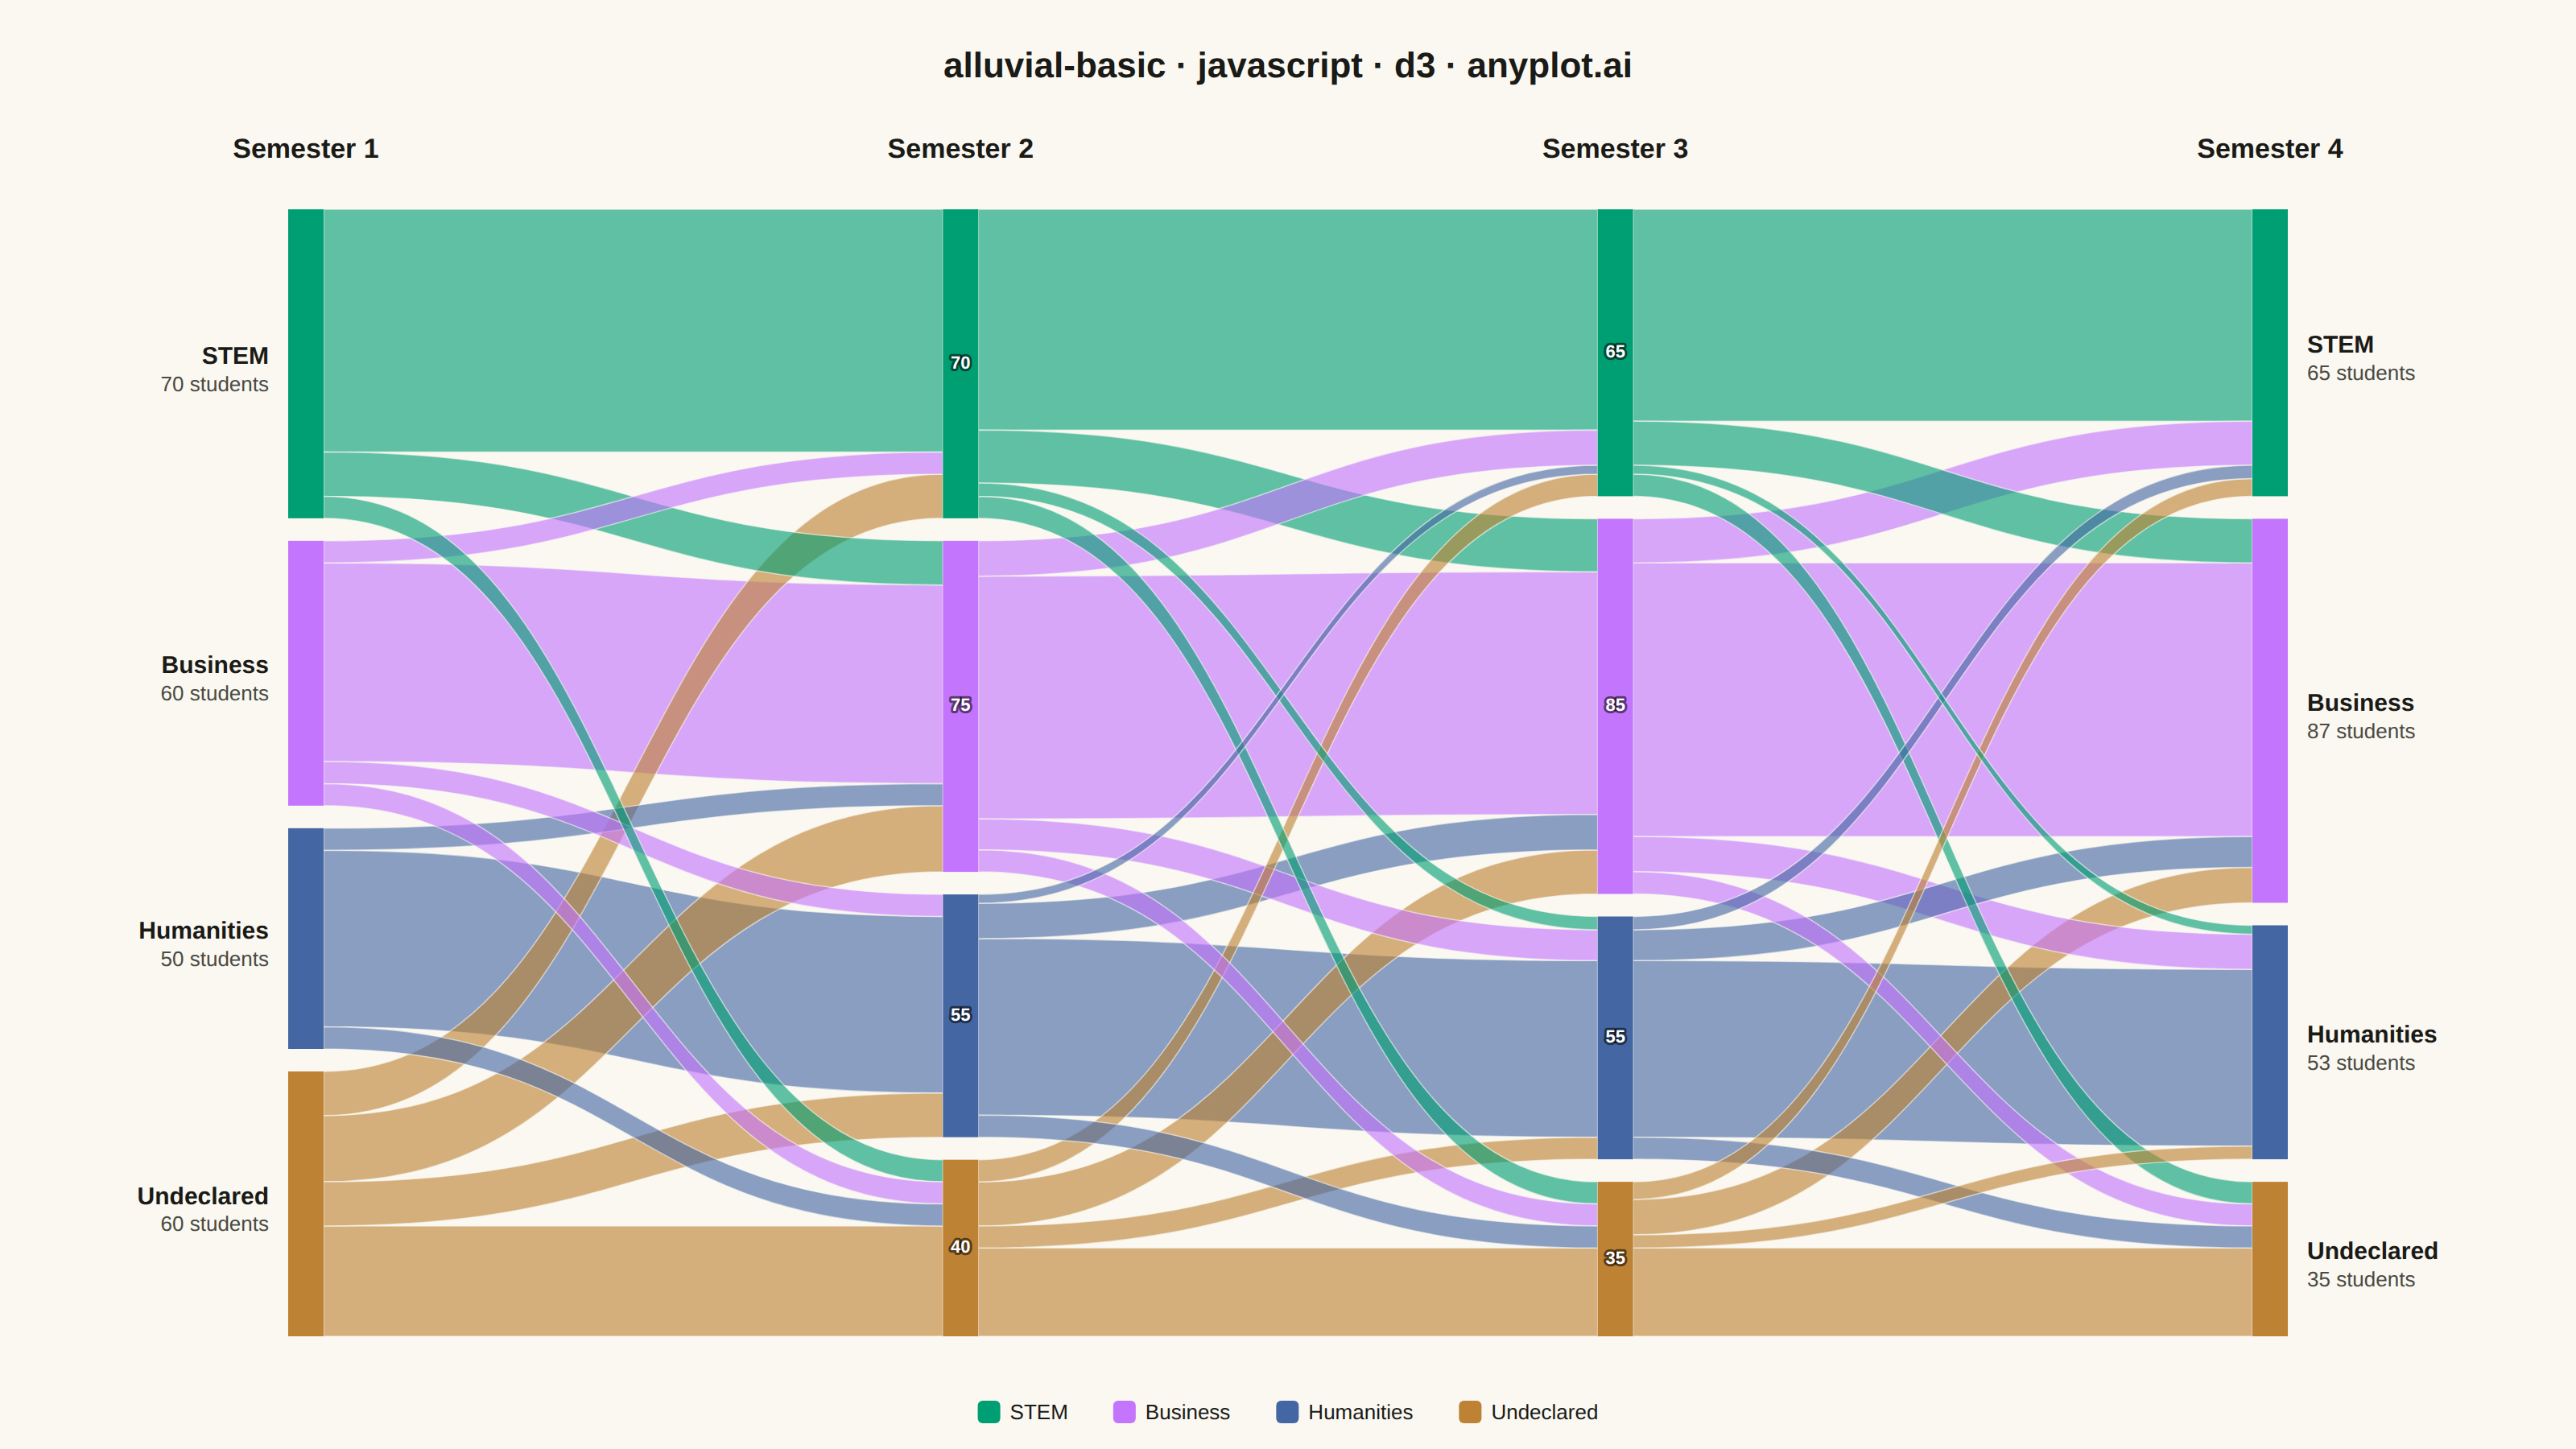
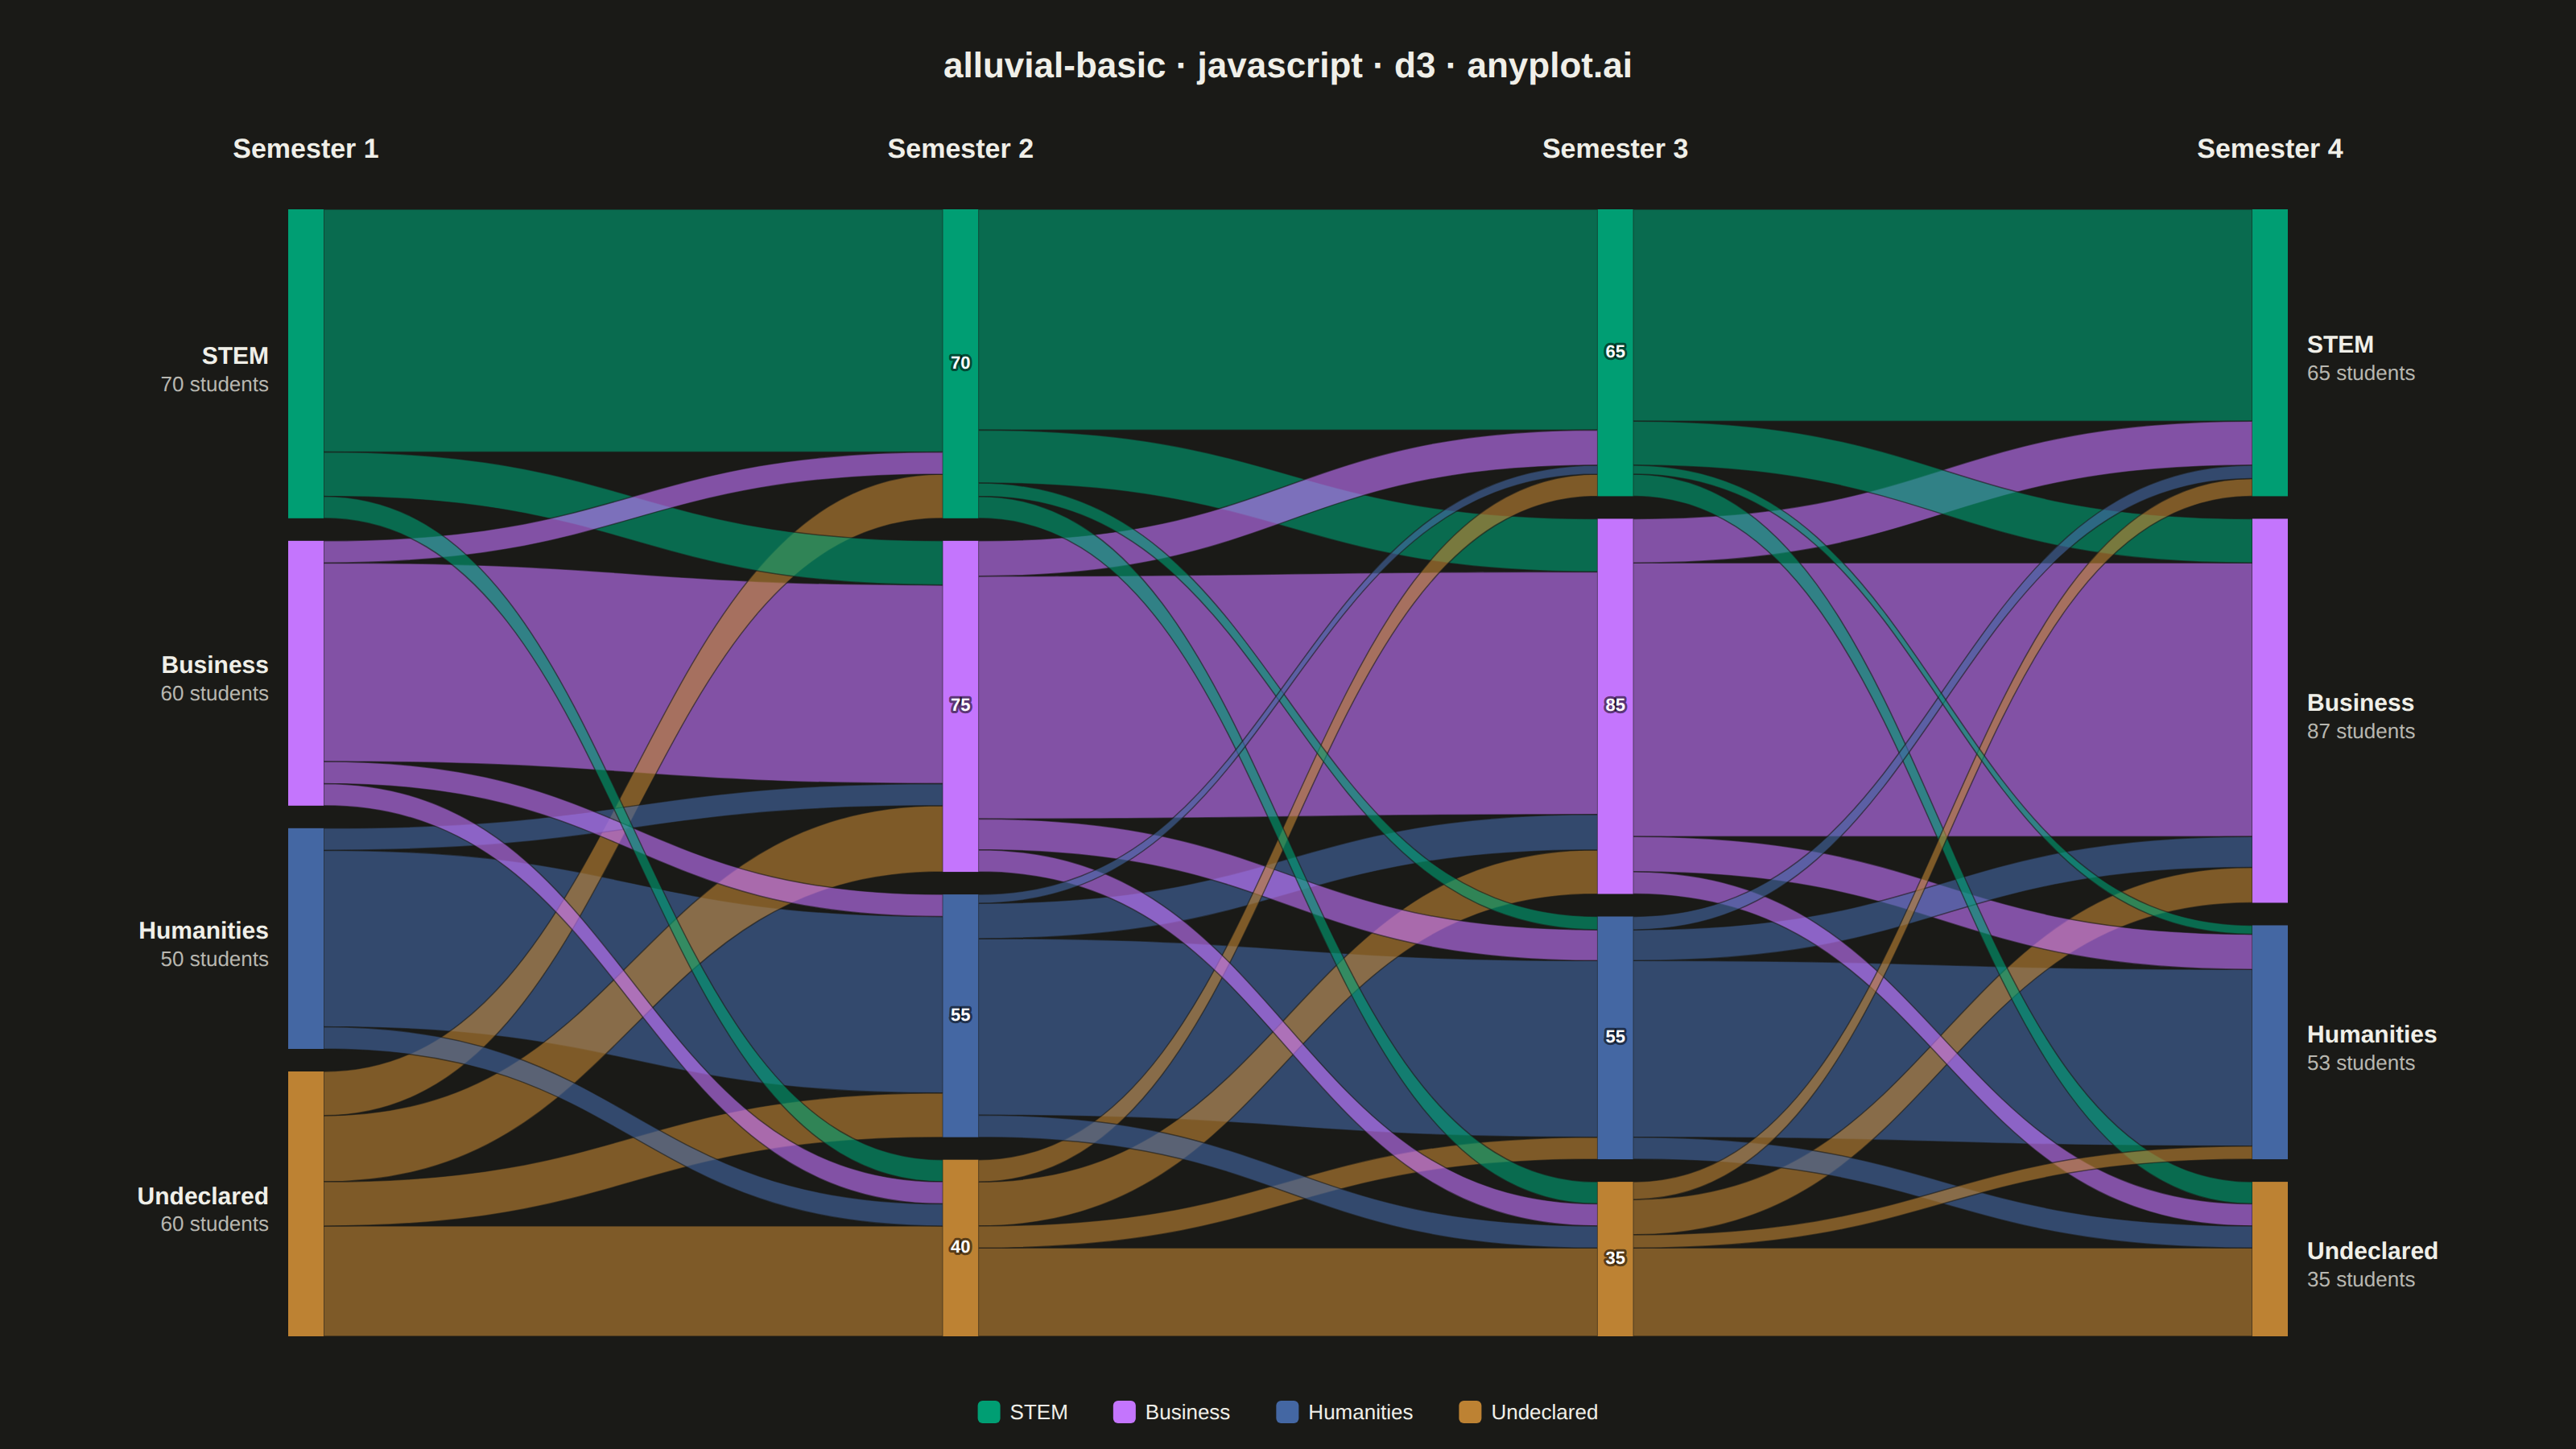
An alluvial diagram visualizes how entities flow or transition between discrete categories across multiple time points or ordered stages. Unlike general Sankey diagrams, alluvial diagrams enforce strict vertical ordering where each column represents a specific time step or category dimension. Bands connect related segments to show how proportions shift over time, making it ideal for tracking structural changes, migrations, and transitions in categorical data.
// anyplot.ai
// alluvial-basic: Basic Alluvial Diagram
// Library: d3 7.9.0 | JavaScript 22.23.2
// Quality: 92/100 | Created: 2026-09-02

//# anyplot-orientation: landscape
const t = window.ANYPLOT_TOKENS;
const { width, height } = window.ANYPLOT_SIZE;

// --- Data (in-memory, deterministic) ----------------------------------------
// Cohort of 240 students tracked across four semesters, transitioning between
// declared academic tracks. Categories persist across time points, so each
// keeps the same Imprint color throughout.
const categories = ["STEM", "Business", "Humanities", "Undeclared"];
const stages = ["Semester 1", "Semester 2", "Semester 3", "Semester 4"];

const initialCounts = { STEM: 70, Business: 60, Humanities: 50, Undeclared: 60 };

// transitions[s] = flows from stages[s] to stages[s + 1]
const transitions = [
  [
    ["STEM", "STEM", 55], ["STEM", "Business", 10], ["STEM", "Undeclared", 5],
    ["Business", "STEM", 5], ["Business", "Business", 45], ["Business", "Humanities", 5], ["Business", "Undeclared", 5],
    ["Humanities", "Business", 5], ["Humanities", "Humanities", 40], ["Humanities", "Undeclared", 5],
    ["Undeclared", "STEM", 10], ["Undeclared", "Business", 15], ["Undeclared", "Humanities", 10], ["Undeclared", "Undeclared", 25],
  ],
  [
    ["STEM", "STEM", 50], ["STEM", "Business", 12], ["STEM", "Humanities", 3], ["STEM", "Undeclared", 5],
    ["Business", "STEM", 8], ["Business", "Business", 55], ["Business", "Humanities", 7], ["Business", "Undeclared", 5],
    ["Humanities", "STEM", 2], ["Humanities", "Business", 8], ["Humanities", "Humanities", 40], ["Humanities", "Undeclared", 5],
    ["Undeclared", "STEM", 5], ["Undeclared", "Business", 10], ["Undeclared", "Humanities", 5], ["Undeclared", "Undeclared", 20],
  ],
  [
    ["STEM", "STEM", 48], ["STEM", "Business", 10], ["STEM", "Humanities", 2], ["STEM", "Undeclared", 5],
    ["Business", "STEM", 10], ["Business", "Business", 62], ["Business", "Humanities", 8], ["Business", "Undeclared", 5],
    ["Humanities", "STEM", 3], ["Humanities", "Business", 7], ["Humanities", "Humanities", 40], ["Humanities", "Undeclared", 5],
    ["Undeclared", "STEM", 4], ["Undeclared", "Business", 8], ["Undeclared", "Humanities", 3], ["Undeclared", "Undeclared", 20],
  ],
];

// Node totals per stage, derived from the transition matrices (column sums).
const counts = [initialCounts];
for (const stageTransitions of transitions) {
  const next = Object.fromEntries(categories.map((c) => [c, 0]));
  for (const [, target, value] of stageTransitions) next[target] += value;
  counts.push(next);
}

// --- Layout -------------------------------------------------------------
const margin = { top: 130, right: 190, bottom: 70, left: 190 };
const iw = width - margin.left - margin.right;
const ih = height - margin.top - margin.bottom;
const nodePadding = 14;
const nodeWidth = 22;
const colX = stages.map((_, s) => margin.left + (s * iw) / (stages.length - 1));

const color = d3.scaleOrdinal().domain(categories).range(t.palette);

// nodes[s][category] = { y0, y1, unit }
const nodes = counts.map((stageCounts) => {
  const total = d3.sum(categories, (c) => stageCounts[c]);
  const unit = (ih - nodePadding * (categories.length - 1)) / total;
  let y = margin.top;
  const stageNodes = {};
  for (const c of categories) {
    const h = stageCounts[c] * unit;
    stageNodes[c] = { y0: y, y1: y + h, unit };
    y += h + nodePadding;
  }
  return stageNodes;
});

// Sub-stack each node's outgoing/incoming flows in fixed category order so
// ribbons never cross within the same node.
const links = transitions.map((stageTransitions, s) => {
  const sourceOffset = Object.fromEntries(categories.map((c) => [c, nodes[s][c].y0]));
  const targetOffset = Object.fromEntries(categories.map((c) => [c, nodes[s + 1][c].y0]));
  const sorted = [...stageTransitions].sort(
    (a, b) => categories.indexOf(a[1]) - categories.indexOf(b[1]) || categories.indexOf(a[0]) - categories.indexOf(b[0])
  );
  return sorted.map(([source, target, value]) => {
    const h0 = value * nodes[s][source].unit;
    const h1 = value * nodes[s + 1][target].unit;
    const y0a = sourceOffset[source];
    const y1a = targetOffset[target];
    sourceOffset[source] += h0;
    targetOffset[target] += h1;
    return { source, target, value, x0: colX[s] + nodeWidth / 2, x1: colX[s + 1] - nodeWidth / 2, y0a, y0b: y0a + h0, y1a, y1b: y1a + h1 };
  });
});

const ribbonPath = (x0, y0a, y0b, x1, y1a, y1b) => {
  const xm = (x0 + x1) / 2;
  return `M${x0},${y0a}C${xm},${y0a} ${xm},${y1a} ${x1},${y1a}L${x1},${y1b}C${xm},${y1b} ${xm},${y0b} ${x0},${y0b}Z`;
};

// --- SVG mount ----------------------------------------------------------
const svg = d3.select("#container").append("svg").attr("width", width).attr("height", height);

// --- Ribbons --------------------------------------------------------------
// Positions are baked into each link already, so re-sorting for the join only
// changes paint (z-)order, not layout: draw the bulkiest flows first so the
// rarer, thinner ones paint last and stay traceable on top of the crossings.
for (const stageLinks of links) {
  const paintOrder = [...stageLinks].sort((a, b) => b.value - a.value);
  svg
    .append("g")
    .selectAll("path")
    .data(paintOrder)
    .join("path")
    .attr("d", (d) => ribbonPath(d.x0, d.y0a, d.y0b, d.x1, d.y1a, d.y1b))
    .attr("fill", (d) => color(d.source))
    .attr("fill-opacity", 0.62)
    .attr("stroke", t.pageBg)
    .attr("stroke-width", 0.75)
    .attr("stroke-opacity", 0.6);
}

// --- Nodes ------------------------------------------------------------------
nodes.forEach((stageNodes, s) => {
  svg
    .append("g")
    .selectAll("rect")
    .data(categories.map((c) => ({ category: c, ...stageNodes[c] })))
    .join("rect")
    .attr("x", colX[s] - nodeWidth / 2)
    .attr("y", (d) => d.y0)
    .attr("width", nodeWidth)
    .attr("height", (d) => d.y1 - d.y0)
    .attr("fill", (d) => color(d.category));
});

// --- Compact counts on the middle stages ---------------------------------
// Semester 1 and Semester 4 already get full "category + count" labels
// outside the diagram; the two interior stages have no room beside the
// nodes (ribbons touch both edges), so stamp the count directly on each bar
// with a haloed label instead — skipped only for slivers too short to hold
// readable text.
const MIN_LABEL_HEIGHT = 26;
for (let s = 1; s < stages.length - 1; s++) {
  const g = svg.append("g");
  for (const c of categories) {
    const { y0, y1 } = nodes[s][c];
    if (y1 - y0 < MIN_LABEL_HEIGHT) continue;
    g.append("text")
      .attr("x", colX[s])
      .attr("y", (y0 + y1) / 2)
      .attr("text-anchor", "middle")
      .attr("dominant-baseline", "central")
      .attr("fill", "#FFFFFF")
      .style("font-size", "11px")
      .style("font-weight", "600")
      .style("paint-order", "stroke")
      .style("stroke", "rgba(0,0,0,0.55)")
      .style("stroke-width", "3px")
      .style("stroke-linejoin", "round")
      .text(counts[s][c]);
  }
}

// --- Shared legend --------------------------------------------------------
// Ties each node/ribbon color back to its category name so the two
// unlabeled interior stages (which only carry counts above) stay
// self-explanatory without cross-referencing the edge columns.
const legend = svg.append("g");
const legendItems = categories.map((c) => {
  const item = legend.append("g");
  item.append("rect").attr("width", 14).attr("height", 14).attr("rx", 3).attr("fill", color(c));
  item
    .append("text")
    .attr("x", 20)
    .attr("y", 7)
    .attr("dominant-baseline", "central")
    .attr("fill", t.ink)
    .style("font-size", "13px")
    .style("font-weight", "500")
    .text(c);
  return item;
});
const legendGap = 28;
const itemWidths = legendItems.map((item) => item.node().getBBox().width);
const totalWidth = itemWidths.reduce((a, b) => a + b, 0) + legendGap * (legendItems.length - 1);
let legendX = (width - totalWidth) / 2;
const legendY = height - 30;
legendItems.forEach((item, i) => {
  item.attr("transform", `translate(${legendX},${legendY})`);
  legendX += itemWidths[i] + legendGap;
});

// --- Category labels (first and last stage only) -----------------------
const labelStage = (s, anchor, dx) => {
  const g = svg.append("g");
  for (const c of categories) {
    const { y0, y1 } = nodes[s][c];
    const cy = (y0 + y1) / 2;
    const text = g
      .append("text")
      .attr("x", colX[s] + dx)
      .attr("y", cy)
      .attr("text-anchor", anchor)
      .attr("fill", t.ink)
      .style("font-size", "15px")
      .style("font-weight", "600");
    text.append("tspan").text(c);
    text
      .append("tspan")
      .attr("x", colX[s] + dx)
      .attr("dy", "1.3em")
      .attr("fill", t.inkSoft)
      .style("font-size", "13px")
      .style("font-weight", "400")
      .text(`${counts[s][c]} students`);
  }
};
labelStage(0, "end", -nodeWidth / 2 - 12);
labelStage(stages.length - 1, "start", nodeWidth / 2 + 12);

// --- Stage headers ------------------------------------------------------
svg
  .append("g")
  .selectAll("text")
  .data(stages)
  .join("text")
  .attr("x", (_, s) => colX[s])
  .attr("y", margin.top - 32)
  .attr("text-anchor", "middle")
  .attr("fill", t.ink)
  .style("font-size", "17px")
  .style("font-weight", "600")
  .text((d) => d);

// --- Title --------------------------------------------------------------
svg
  .append("text")
  .attr("x", width / 2)
  .attr("y", 48)
  .attr("text-anchor", "middle")
  .attr("fill", t.ink)
  .style("font-size", "22px")
  .style("font-weight", "600")
  .text("alluvial-basic · javascript · d3 · anyplot.ai");
Runnable source as JSON, for any HTTP client: https://api.anyplot.ai/specs/alluvial-basic/d3/code. Any spec id and library id listed in llms-full.txt fit the same URL shape; every URL below is complete and callable.
{
  "spec_id": "alluvial-basic",
  "language": "javascript",
  "library": "d3",
  "page": "https://anyplot.ai/alluvial-basic/javascript/d3",
  "hub": "https://anyplot.ai/alluvial-basic",
  "code_json": "https://api.anyplot.ai/specs/alluvial-basic/d3/code",
  "spec_json": "https://api.anyplot.ai/specs/alluvial-basic",
  "render_light_png": "https://storage.googleapis.com/anyplot-images/plots/alluvial-basic/javascript/d3/plot-light.png",
  "render_dark_png": "https://storage.googleapis.com/anyplot-images/plots/alluvial-basic/javascript/d3/plot-dark.png",
  "interactive_light_html": "https://storage.googleapis.com/anyplot-images/plots/alluvial-basic/javascript/d3/plot-light.html",
  "interactive_dark_html": "https://storage.googleapis.com/anyplot-images/plots/alluvial-basic/javascript/d3/plot-dark.html",
  "quality_score": 92.0,
  "license": "MIT",
  "guide": "https://anyplot.ai/llms.txt"
}
Part of Basic Alluvial Diagram on anyplot.ai.