The same plot in 14 other libraries — JavaScript: Chart.js, D3.js, Apache ECharts, MUI X Charts; Python: Altair, Bokeh, lets-plot, Matplotlib, Plotly, plotnine, Pygal, Seaborn; R: ggplot2; Julia: Makie.jl. Compare all 15 side by side: Basic Alluvial Diagram in Python, R, Julia and JavaScript.
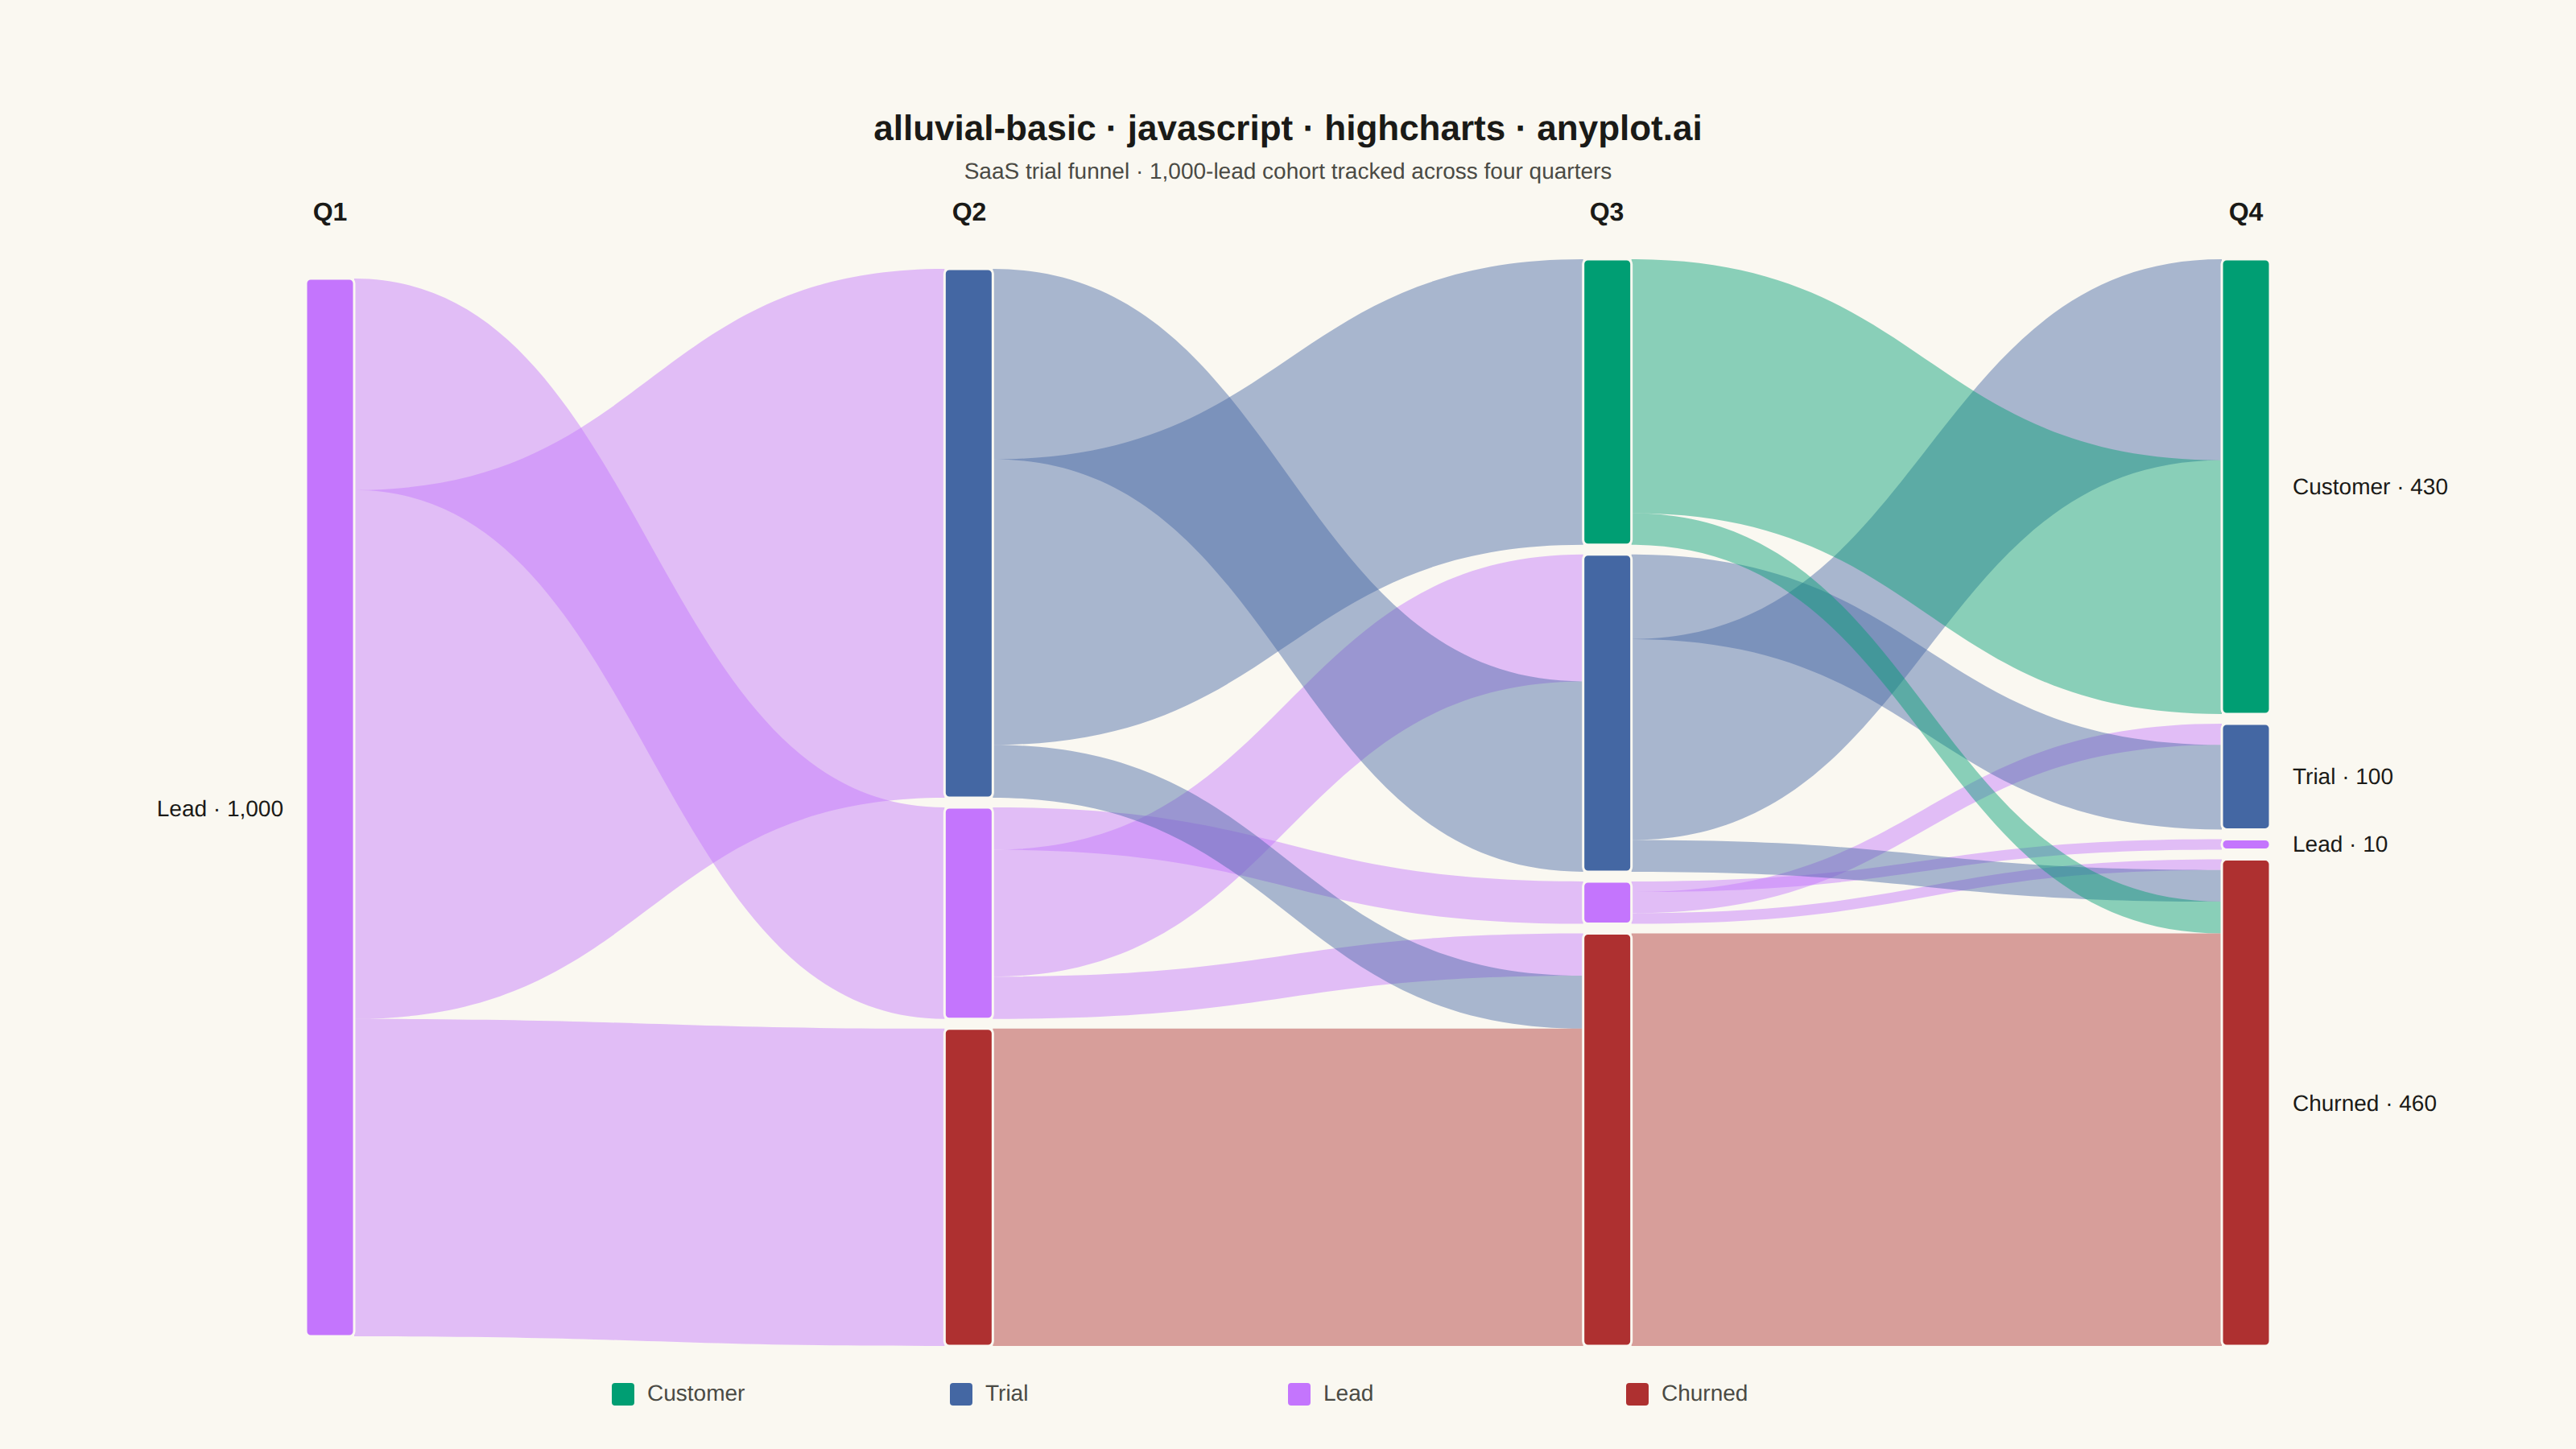
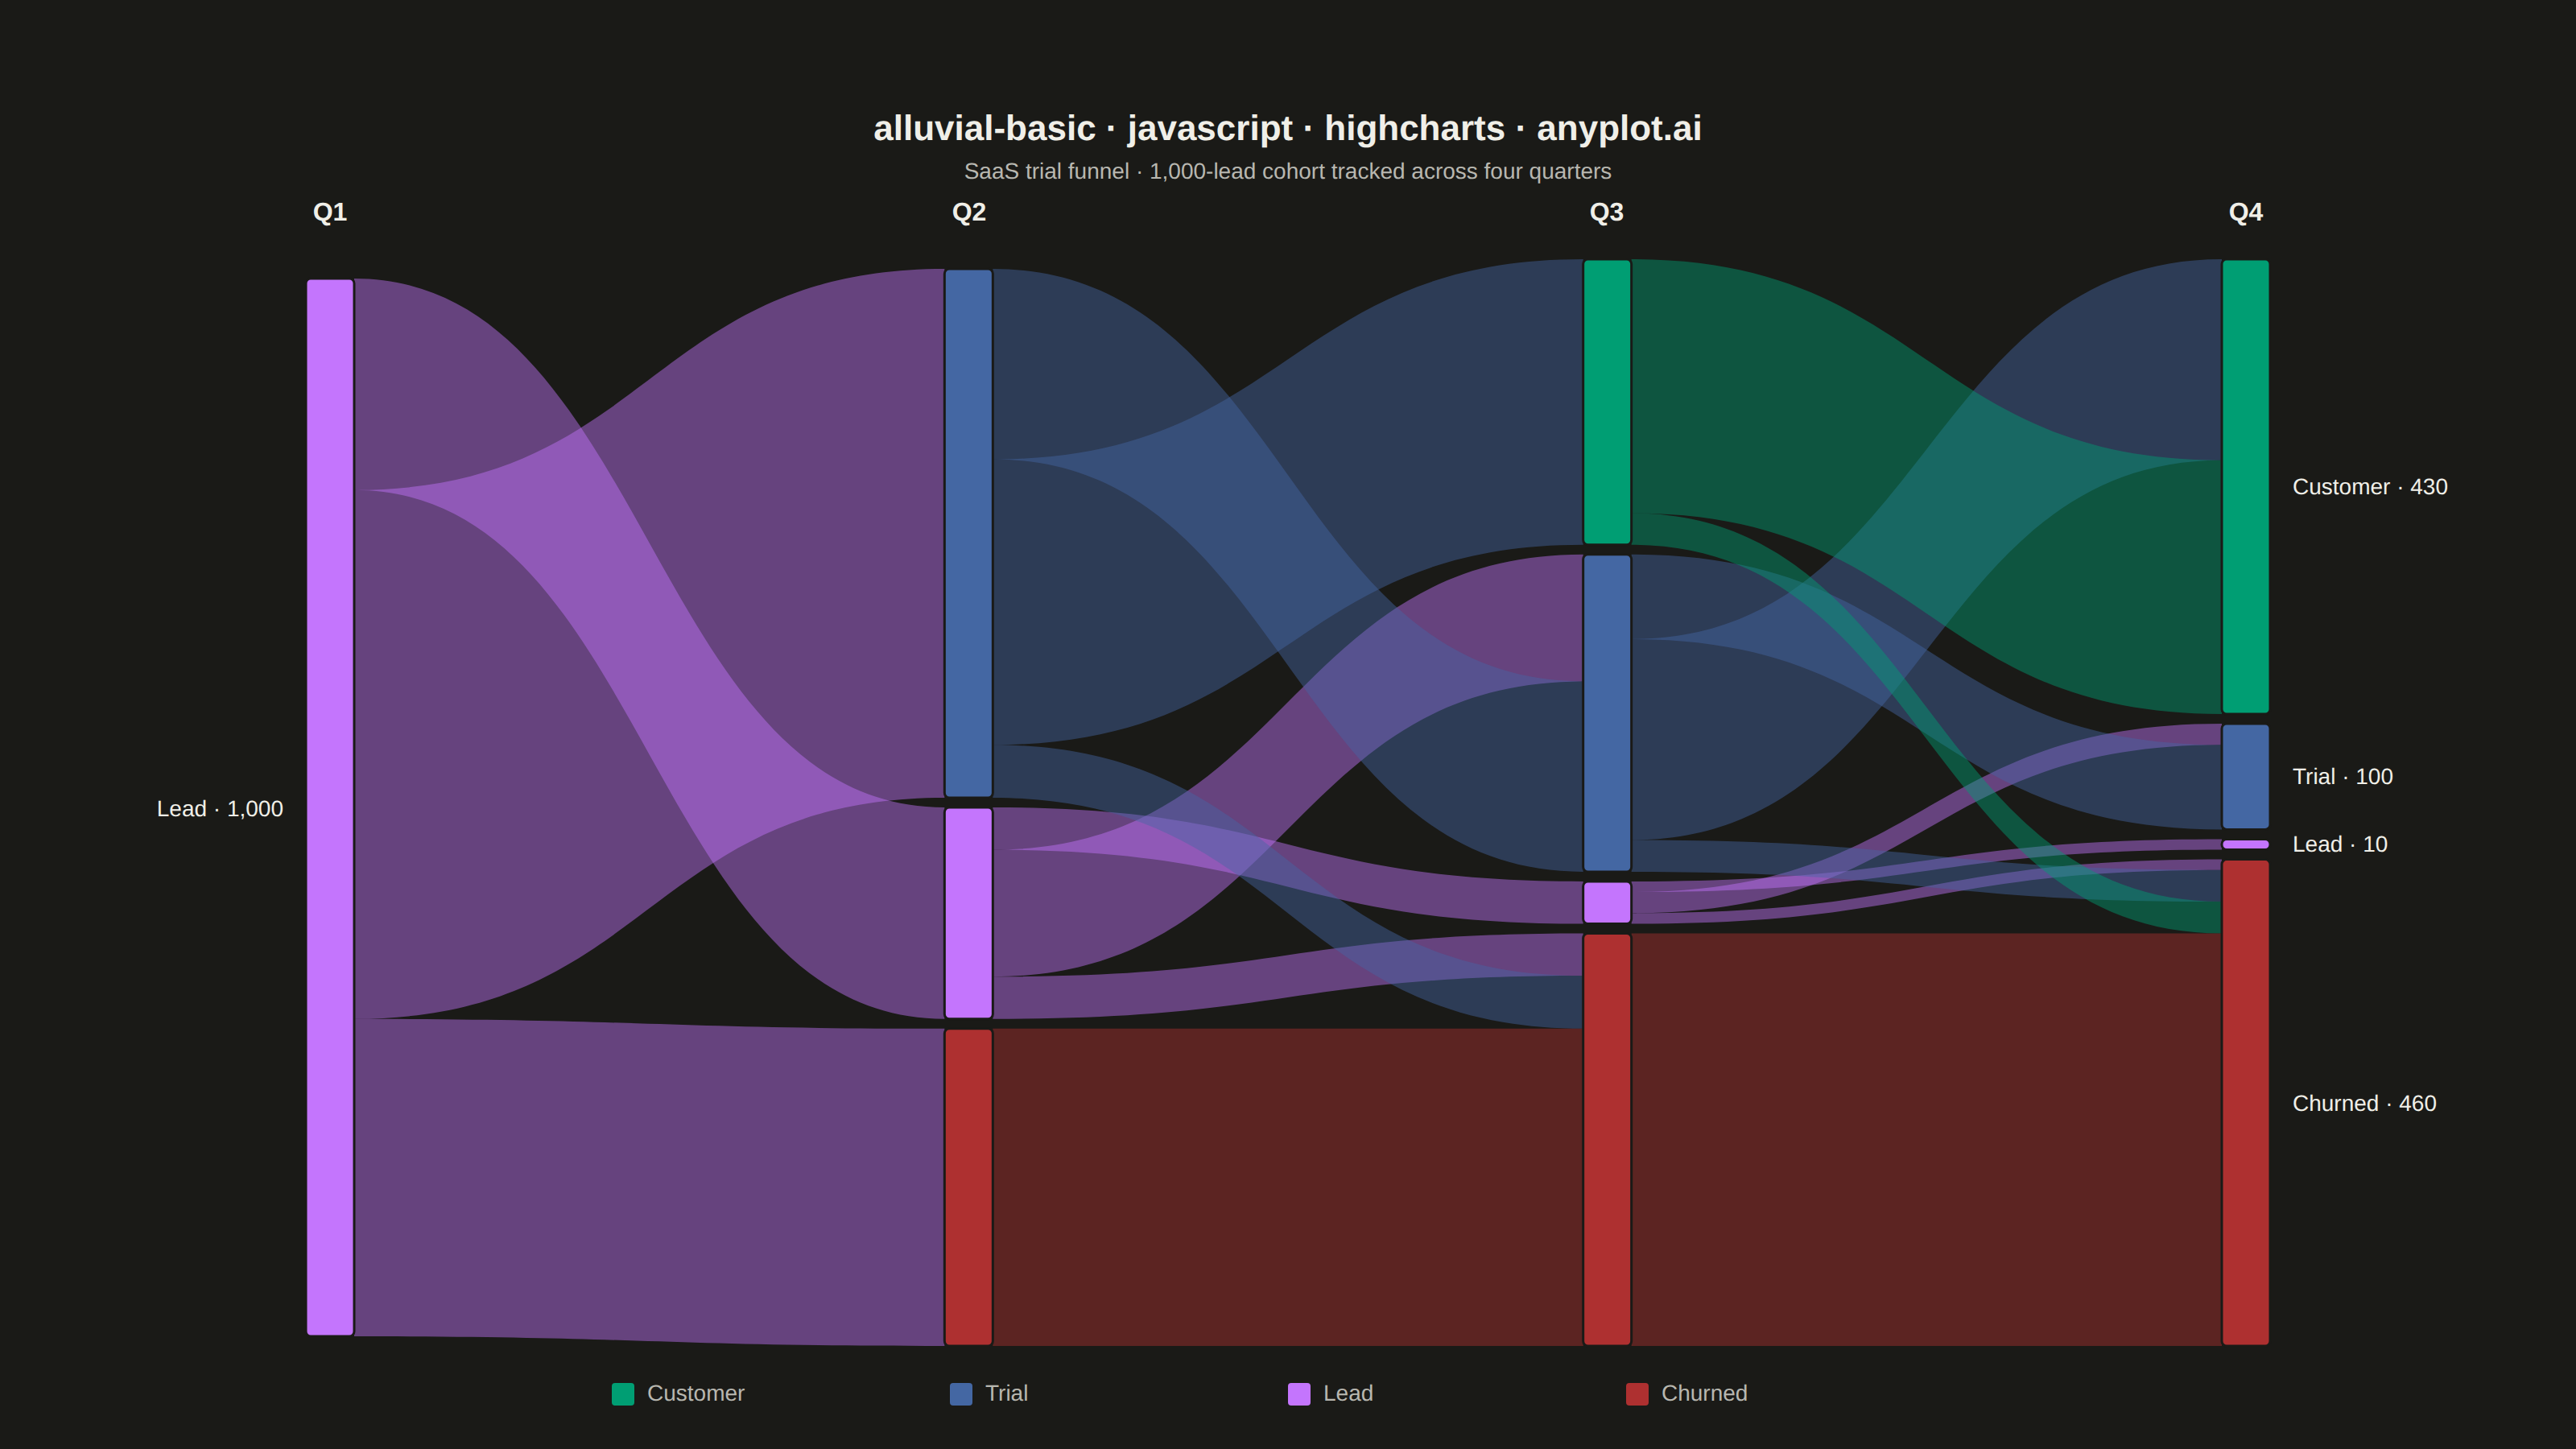
An alluvial diagram visualizes how entities flow or transition between discrete categories across multiple time points or ordered stages. Unlike general Sankey diagrams, alluvial diagrams enforce strict vertical ordering where each column represents a specific time step or category dimension. Bands connect related segments to show how proportions shift over time, making it ideal for tracking structural changes, migrations, and transitions in categorical data.
// anyplot.ai
// alluvial-basic: Basic Alluvial Diagram
// Library: highcharts 12.6.0 | JavaScript 22.23.2
// Quality: 92/100 | Created: 2026-09-02

// The Sankey/alluvial series type lives in a Highcharts add-on module
// (modules/sankey) that isn't vendored here — only the core bundle is loaded
// (see prompts/library/highcharts.md, "Forbidden patterns"). The core
// SVGRenderer is not a module, though, so this snippet draws the alluvial
// bands and category nodes natively with chart.renderer primitives inside a
// series-less chart, the same technique Highcharts itself used for flow
// diagrams before the sankey module existed.

const t = window.ANYPLOT_TOKENS;

// --- Data (in-memory, deterministic) ----------------------------------------
// A 1,000-lead SaaS trial cohort tracked across four quarters. Every lead is
// in exactly one category per quarter, so column totals stay conserved and
// each flow's width is exactly the number of leads making that transition.
const TIME_LABELS = ["Q1", "Q2", "Q3", "Q4"];
const CATEGORIES = ["Lead", "Trial", "Customer", "Churned"];
const STACK_ORDER = ["Customer", "Trial", "Lead", "Churned"]; // top → bottom
const CATEGORY_COLOR = {
  Customer: t.palette[0], // brand green — the desired outcome
  Trial: t.palette[2],
  Lead: t.palette[1],
  Churned: t.palette[4], // semantic anchor for loss (Color Philosophy, slot 5)
};

const TRANSITIONS = [
  // Q1 -> Q2
  [
    { from: "Lead", to: "Lead", value: 200 },
    { from: "Lead", to: "Trial", value: 500 },
    { from: "Lead", to: "Churned", value: 300 },
  ],
  // Q2 -> Q3
  [
    { from: "Lead", to: "Lead", value: 40 },
    { from: "Lead", to: "Trial", value: 120 },
    { from: "Lead", to: "Churned", value: 40 },
    { from: "Trial", to: "Trial", value: 180 },
    { from: "Trial", to: "Customer", value: 270 },
    { from: "Trial", to: "Churned", value: 50 },
    { from: "Churned", to: "Churned", value: 300 },
  ],
  // Q3 -> Q4
  [
    { from: "Lead", to: "Lead", value: 10 },
    { from: "Lead", to: "Trial", value: 20 },
    { from: "Lead", to: "Churned", value: 10 },
    { from: "Trial", to: "Trial", value: 80 },
    { from: "Trial", to: "Customer", value: 190 },
    { from: "Trial", to: "Churned", value: 30 },
    { from: "Customer", to: "Customer", value: 240 },
    { from: "Customer", to: "Churned", value: 30 },
    { from: "Churned", to: "Churned", value: 390 },
  ],
];

// Column totals per category, derived from the flows so the diagram can never
// drift out of balance with the data it draws.
const nodeValues = [{ Lead: 1000, Trial: 0, Customer: 0, Churned: 0 }];
TRANSITIONS.forEach((flows) => {
  const next = { Lead: 0, Trial: 0, Customer: 0, Churned: 0 };
  flows.forEach((flow) => {
    next[flow.to] += flow.value;
  });
  nodeValues.push(next);
});
const TOTAL = CATEGORIES.reduce((sum, cat) => sum + nodeValues[0][cat], 0);

// --- Chart (series-less; the alluvial is hand-drawn via chart.renderer) ----
Highcharts.chart("container", {
  chart: {
    backgroundColor: "transparent",
    animation: false,
    spacingTop: 70,
    spacingBottom: 64,
    spacingLeft: 190,
    spacingRight: 190,
    style: { fontFamily: "inherit" },
    events: {
      load() {
        drawAlluvial(this);
      },
    },
  },
  credits: { enabled: false },
  title: {
    text: "alluvial-basic · javascript · highcharts · anyplot.ai",
    style: { color: t.ink, fontSize: "22px", fontWeight: "600" },
    // Extra margin below the subtitle so the Q1-Q4 column headers (drawn at
    // chart.plotTop - 24) clear the subtitle baseline instead of sitting on it.
    margin: 50,
  },
  subtitle: {
    text: "SaaS trial funnel · 1,000-lead cohort tracked across four quarters",
    style: { color: t.inkSoft, fontSize: "14px" },
  },
  xAxis: { visible: false },
  yAxis: { visible: false },
  legend: { enabled: false },
  series: [],
});

function drawAlluvial(chart) {
  const r = chart.renderer;
  const nodeWidth = 30;
  const gap = 6;
  const usableHeight = chart.plotHeight - gap * (STACK_ORDER.length - 1);
  const scale = usableHeight / TOTAL;
  const usableWidth = chart.plotWidth - nodeWidth;

  const colX = (i) => chart.plotLeft + nodeWidth / 2 + (usableWidth * i) / (TIME_LABELS.length - 1);

  // Segment top/bottom per column & category, stacked in STACK_ORDER.
  const segments = nodeValues.map((values) => {
    const seg = {};
    let y = chart.plotTop;
    STACK_ORDER.forEach((cat) => {
      const h = values[cat] * scale;
      seg[cat] = { top: y, bottom: y + h, height: h };
      y += h + gap;
    });
    return seg;
  });

  // Flow bands — drawn first so the node rectangles sit cleanly on top of
  // their flat edges.
  TRANSITIONS.forEach((flows, i) => {
    const srcCursor = {};
    const tgtCursor = {};
    STACK_ORDER.forEach((cat) => {
      srcCursor[cat] = segments[i][cat].top;
      tgtCursor[cat] = segments[i + 1][cat].top;
    });
    const x0 = colX(i) + nodeWidth / 2;
    const x1 = colX(i + 1) - nodeWidth / 2;
    const cx = (x0 + x1) / 2;

    flows.forEach((flow) => {
      const h = flow.value * scale;
      const y0Top = srcCursor[flow.from];
      const y0Bottom = y0Top + h;
      const y1Top = tgtCursor[flow.to];
      const y1Bottom = y1Top + h;
      srcCursor[flow.from] = y0Bottom;
      tgtCursor[flow.to] = y1Bottom;

      r.path([
        "M", x0, y0Top,
        "C", cx, y0Top, cx, y1Top, x1, y1Top,
        "L", x1, y1Bottom,
        "C", cx, y1Bottom, cx, y0Bottom, x0, y0Bottom,
        "Z",
      ])
        .attr({ fill: CATEGORY_COLOR[flow.from], "fill-opacity": 0.45 })
        .add();
    });
  });

  // Category nodes.
  segments.forEach((seg, i) => {
    STACK_ORDER.forEach((cat) => {
      const s = seg[cat];
      if (s.height < 1) return;
      r.rect(colX(i) - nodeWidth / 2, s.top, nodeWidth, s.height, 3)
        .attr({ fill: CATEGORY_COLOR[cat], stroke: t.pageBg, "stroke-width": 1.5 })
        .add();
    });
  });

  // Column headers (time points).
  TIME_LABELS.forEach((label, i) => {
    r.text(label, colX(i), chart.plotTop - 24)
      .attr({ align: "center" })
      .css({ color: t.ink, fontSize: "16px", fontWeight: "600" })
      .add();
  });

  // Endpoint labels — category name + count, only at the first and last
  // columns (color + column headers carry identity for the middle columns).
  CATEGORIES.forEach((cat) => {
    const first = segments[0][cat];
    if (first.height >= 1) {
      r.text(`${cat} · ${nodeValues[0][cat].toLocaleString()}`, colX(0) - nodeWidth / 2 - 14, (first.top + first.bottom) / 2 + 5)
        .attr({ align: "right" })
        .css({ color: t.ink, fontSize: "14px" })
        .add();
    }
    const lastIdx = segments.length - 1;
    const last = segments[lastIdx][cat];
    if (last.height >= 1) {
      r.text(`${cat} · ${nodeValues[lastIdx][cat].toLocaleString()}`, colX(lastIdx) + nodeWidth / 2 + 14, (last.top + last.bottom) / 2 + 5)
        .attr({ align: "left" })
        .css({ color: t.ink, fontSize: "14px" })
        .add();
    }
  });

  // Legend — identifies category color for the two middle columns, where
  // endpoint labels aren't drawn. Ordered to match the visual top-to-bottom
  // stacking (STACK_ORDER), not category-definition order, so a swatch maps
  // directly onto its band without hunting.
  const itemWidth = 210;
  const legendWidth = itemWidth * STACK_ORDER.length;
  const legendY = chart.plotTop + chart.plotHeight + 34;
  const legendStartX = chart.plotLeft + (chart.plotWidth - legendWidth) / 2;
  STACK_ORDER.forEach((cat, i) => {
    const itemX = legendStartX + i * itemWidth;
    r.rect(itemX, legendY - 11, 14, 14, 2).attr({ fill: CATEGORY_COLOR[cat] }).add();
    r.text(cat, itemX + 22, legendY)
      .attr({ align: "left" })
      .css({ color: t.inkSoft, fontSize: "14px" })
      .add();
  });
}
Runnable source as JSON, for any HTTP client: https://api.anyplot.ai/specs/alluvial-basic/highcharts/code. Any spec id and library id listed in llms-full.txt fit the same URL shape; every URL below is complete and callable.
{
  "spec_id": "alluvial-basic",
  "language": "javascript",
  "library": "highcharts",
  "page": "https://anyplot.ai/alluvial-basic/javascript/highcharts",
  "hub": "https://anyplot.ai/alluvial-basic",
  "code_json": "https://api.anyplot.ai/specs/alluvial-basic/highcharts/code",
  "spec_json": "https://api.anyplot.ai/specs/alluvial-basic",
  "render_light_png": "https://storage.googleapis.com/anyplot-images/plots/alluvial-basic/javascript/highcharts/plot-light.png",
  "render_dark_png": "https://storage.googleapis.com/anyplot-images/plots/alluvial-basic/javascript/highcharts/plot-dark.png",
  "interactive_light_html": "https://storage.googleapis.com/anyplot-images/plots/alluvial-basic/javascript/highcharts/plot-light.html",
  "interactive_dark_html": "https://storage.googleapis.com/anyplot-images/plots/alluvial-basic/javascript/highcharts/plot-dark.html",
  "quality_score": 92.0,
  "license": "MIT",
  "guide": "https://anyplot.ai/llms.txt"
}
Part of Basic Alluvial Diagram on anyplot.ai.