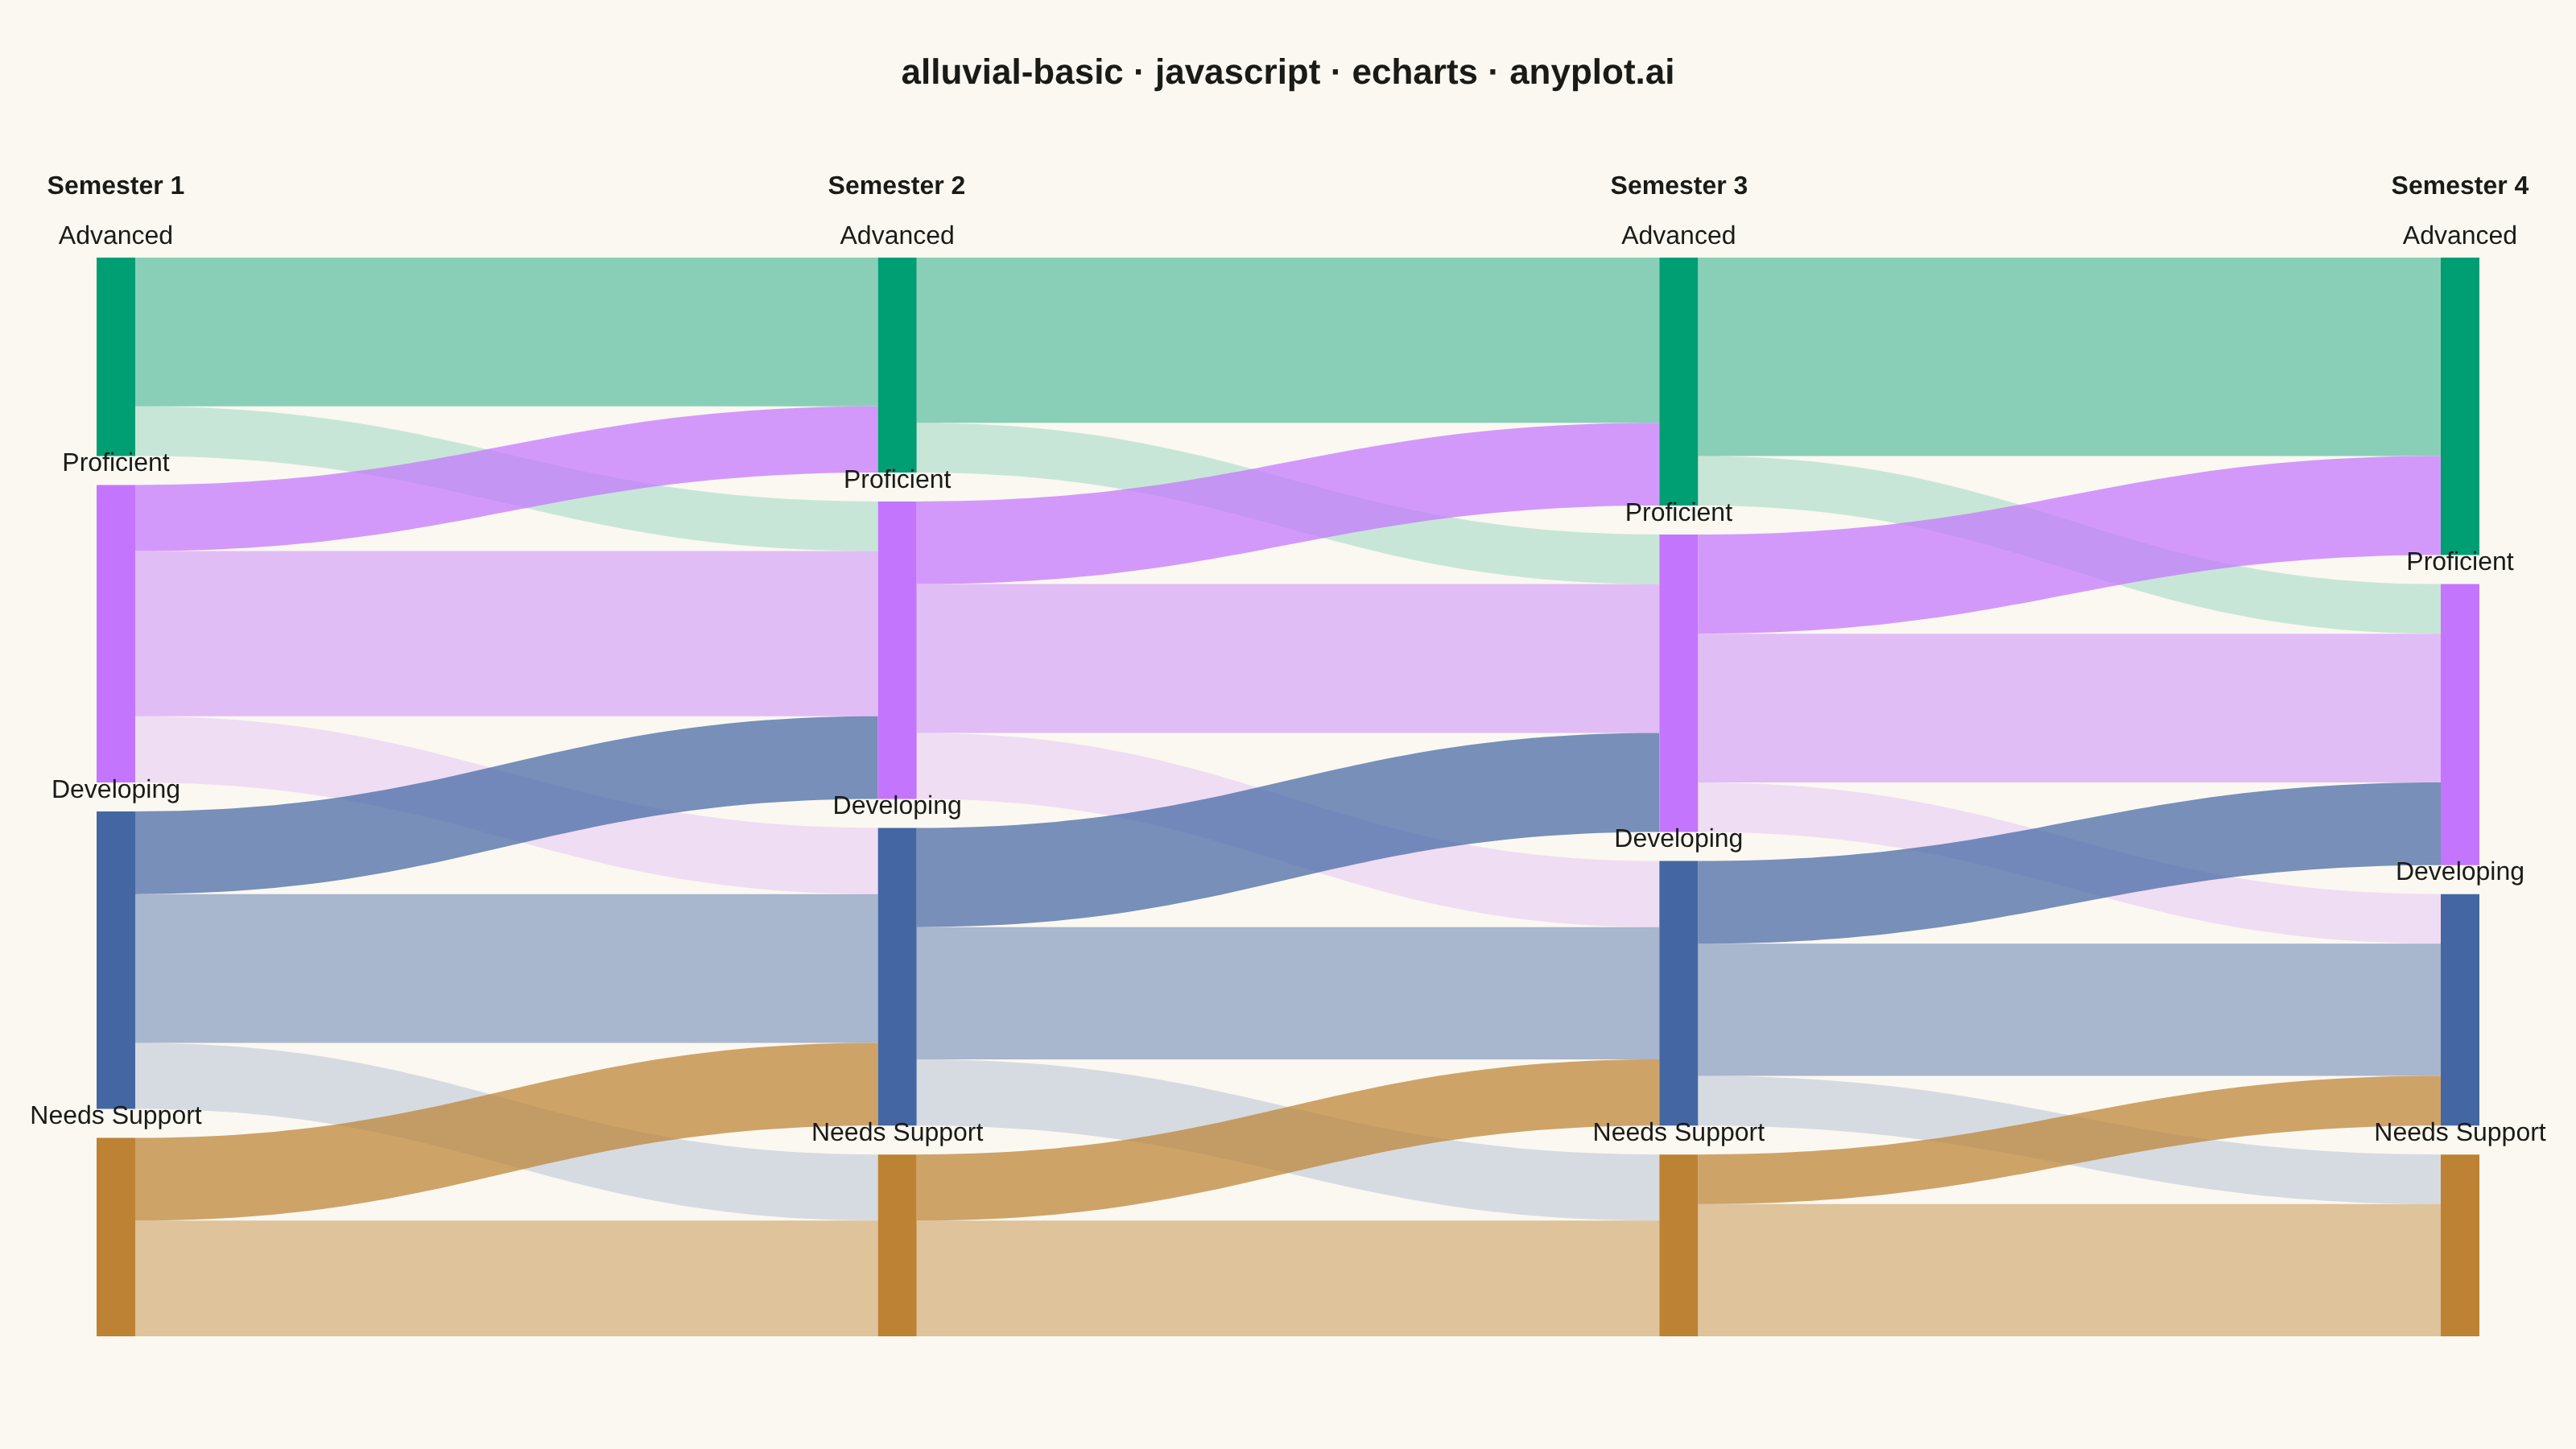
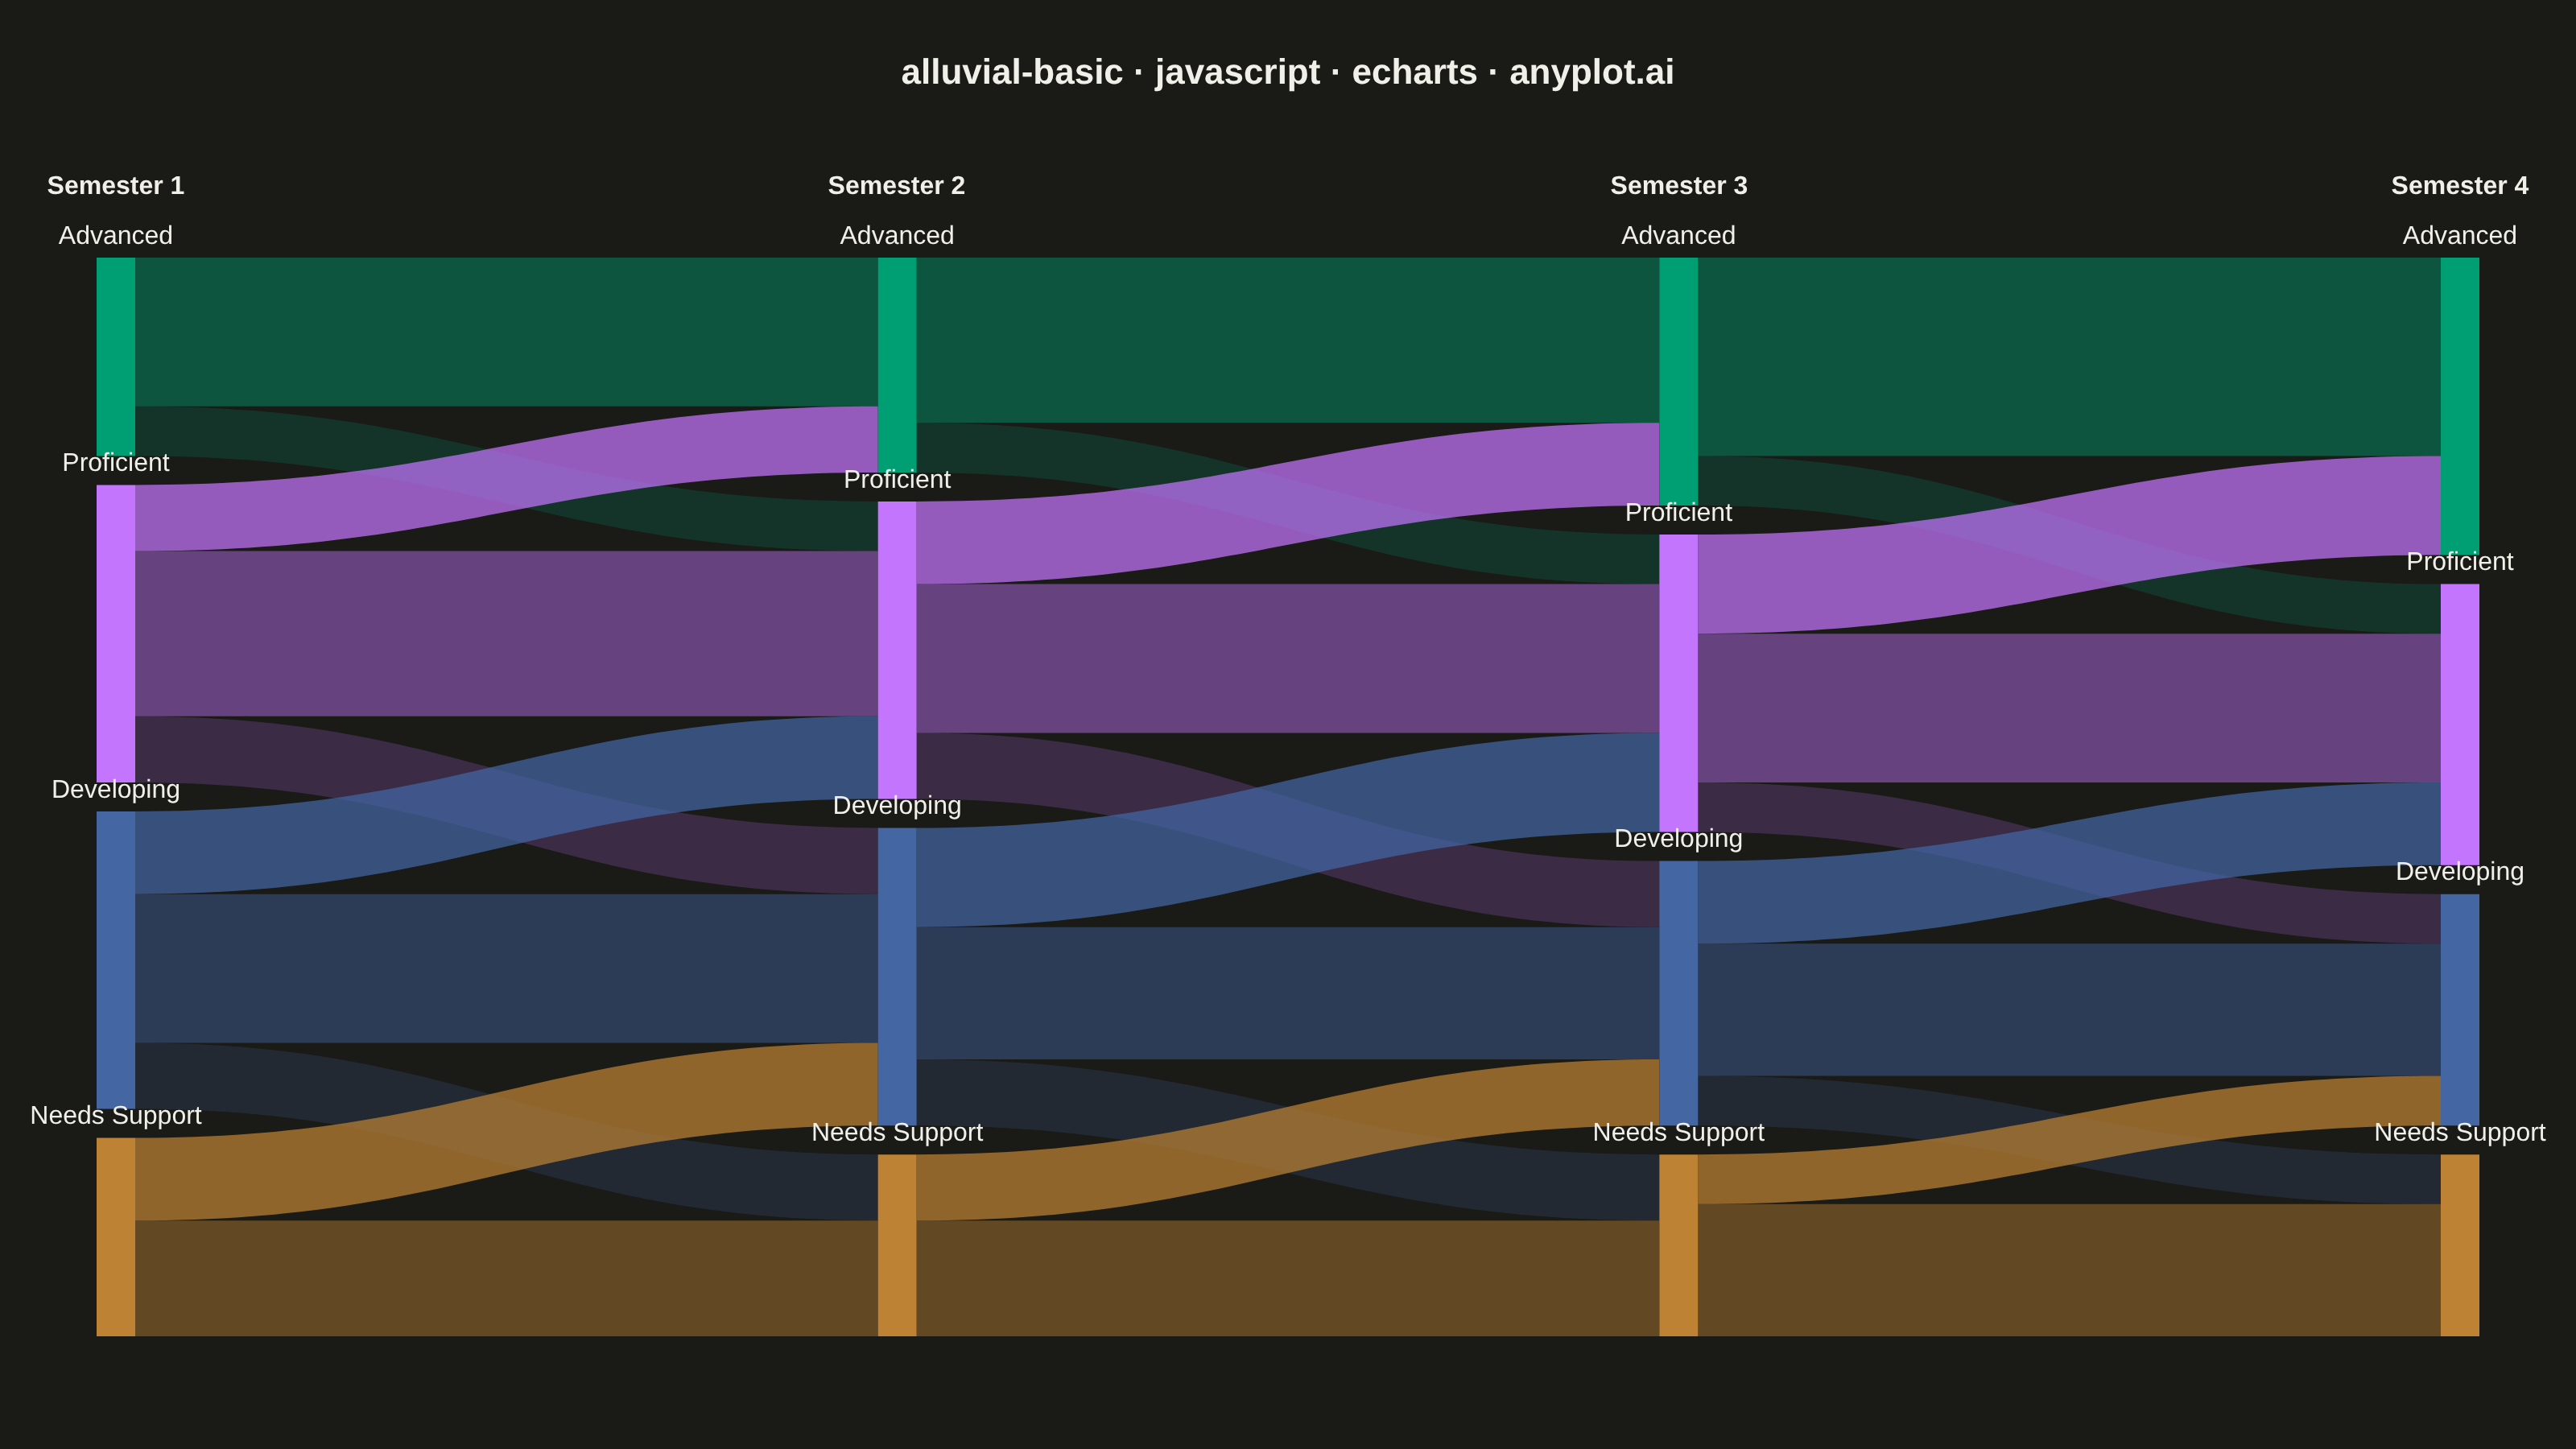
The same plot in 14 other libraries — JavaScript: Chart.js, D3.js, Highcharts, MUI X Charts; Python: Altair, Bokeh, lets-plot, Matplotlib, Plotly, plotnine, Pygal, Seaborn; R: ggplot2; Julia: Makie.jl. Compare all 15 side by side: Basic Alluvial Diagram in Python, R, Julia and JavaScript.
An alluvial diagram visualizes how entities flow or transition between discrete categories across multiple time points or ordered stages. Unlike general Sankey diagrams, alluvial diagrams enforce strict vertical ordering where each column represents a specific time step or category dimension. Bands connect related segments to show how proportions shift over time, making it ideal for tracking structural changes, migrations, and transitions in categorical data.
// anyplot.ai
// alluvial-basic: Basic Alluvial Diagram
// Library: echarts 6.1.0 | JavaScript 22.23.2
// Quality: 91/100 | Created: 2026-09-02

const t = window.ANYPLOT_TOKENS;

// --- Data (in-memory, deterministic) ----------------------------------------
// Student performance tracks followed across four semesters. Each time point
// is a strict column; every link only connects a category to its immediate
// successor column, which keeps the ECharts sankey layout aligned into a
// classic alluvial column structure (no cross-generation links).
const timePoints = ["Semester 1", "Semester 2", "Semester 3", "Semester 4"];
const categories = ["Advanced", "Proficient", "Developing", "Needs Support"];
const categoryColors = [t.palette[0], t.palette[1], t.palette[2], t.palette[3]];

// Transition matrices: transitions[k][from][to] = students moving from
// categories[from] at timePoints[k] to categories[to] at timePoints[k + 1].
const transitions = [
  [
    [45, 15, 0, 0],
    [20, 50, 20, 0],
    [0, 25, 45, 20],
    [0, 0, 25, 35],
  ],
  [
    [50, 15, 0, 0],
    [25, 45, 20, 0],
    [0, 30, 40, 20],
    [0, 0, 20, 35],
  ],
  [
    [60, 15, 0, 0],
    [30, 45, 15, 0],
    [0, 25, 40, 15],
    [0, 0, 15, 40],
  ],
];

const nodeName = (timeIdx, catIdx) => `${timeIdx}|${catIdx}`;

const nodes = timePoints.flatMap((_, timeIdx) =>
  categories.map((_, catIdx) => ({
    name: nodeName(timeIdx, catIdx),
    itemStyle: { color: categoryColors[catIdx] },
  }))
);

// Category index 0 (Advanced) is the best outcome and 3 (Needs Support) the
// worst, so a transition to a lower index is an improvement. Improving flows
// get a visibility boost and declining flows recede, so the "students
// improving over time" story reads immediately instead of requiring the
// viewer to trace individual bands through the crossing pattern.
const linkOpacity = (fromIdx, toIdx) => {
  if (toIdx < fromIdx) return 0.72; // improving
  if (toIdx > fromIdx) return 0.2; // declining
  return 0.45; // stable
};

const links = transitions.flatMap((matrix, k) =>
  matrix.flatMap((row, fromIdx) =>
    row
      .map((value, toIdx) => ({ value, fromIdx, toIdx }))
      .filter((link) => link.value > 0)
      .map((link) => ({
        source: nodeName(k, link.fromIdx),
        target: nodeName(k + 1, link.toIdx),
        value: link.value,
        lineStyle: {
          color: "source",
          opacity: linkOpacity(link.fromIdx, link.toIdx),
          curveness: 0.45,
        },
      }))
  )
);

// --- Init ---------------------------------------------------------------
const chart = echarts.init(document.getElementById("container"));

// --- Column headers (time points) ----------------------------------------
// Centers approximate the sankey's four justified column x-positions for the
// 1600px landscape mount (left: 60, right: 60, nodeWidth: 24).
const columnCenters = [72, 557, 1043, 1528];
const headerGraphics = timePoints.map((label, i) => ({
  type: "text",
  position: [columnCenters[i], 108],
  style: {
    text: label,
    textAlign: "center",
    fill: t.ink,
    fontSize: 16,
    fontWeight: "bold",
  },
}));

// --- Option -----------------------------------------------------------------
chart.setOption({
  animation: false,
  color: t.palette,
  backgroundColor: "transparent",
  title: {
    text: "alluvial-basic · javascript · echarts · anyplot.ai",
    left: "center",
    top: 30,
    textStyle: { color: t.ink, fontSize: 22 },
  },
  graphic: { elements: headerGraphics },
  series: [
    {
      type: "sankey",
      left: 60,
      right: 60,
      top: 160,
      bottom: 70,
      nodeWidth: 24,
      nodeGap: 18,
      nodeAlign: "justify",
      layoutIterations: 64,
      emphasis: { focus: "adjacency" },
      label: {
        position: "top",
        color: t.ink,
        fontSize: 16,
        formatter: (params) => categories[Number(params.name.split("|")[1])],
      },
      lineStyle: { color: "source", opacity: 0.45, curveness: 0.45 },
      data: nodes,
      links,
    },
  ],
});
Runnable source as JSON, for any HTTP client: https://api.anyplot.ai/specs/alluvial-basic/echarts/code. Any spec id and library id listed in llms-full.txt fit the same URL shape; every URL below is complete and callable.
{
  "spec_id": "alluvial-basic",
  "language": "javascript",
  "library": "echarts",
  "page": "https://anyplot.ai/alluvial-basic/javascript/echarts",
  "hub": "https://anyplot.ai/alluvial-basic",
  "code_json": "https://api.anyplot.ai/specs/alluvial-basic/echarts/code",
  "spec_json": "https://api.anyplot.ai/specs/alluvial-basic",
  "render_light_png": "https://storage.googleapis.com/anyplot-images/plots/alluvial-basic/javascript/echarts/plot-light.png",
  "render_dark_png": "https://storage.googleapis.com/anyplot-images/plots/alluvial-basic/javascript/echarts/plot-dark.png",
  "interactive_light_html": "https://storage.googleapis.com/anyplot-images/plots/alluvial-basic/javascript/echarts/plot-light.html",
  "interactive_dark_html": "https://storage.googleapis.com/anyplot-images/plots/alluvial-basic/javascript/echarts/plot-dark.html",
  "quality_score": 91.0,
  "license": "MIT",
  "guide": "https://anyplot.ai/llms.txt"
}
Part of Basic Alluvial Diagram on anyplot.ai.