The same plot in 14 other libraries — JavaScript: D3.js, Apache ECharts, Highcharts, MUI X Charts; Python: Altair, Bokeh, lets-plot, Matplotlib, Plotly, plotnine, Pygal, Seaborn; R: ggplot2; Julia: Makie.jl. Compare all 15 side by side: Cumulative Flow Diagram for Workflow Analytics in Python, R, Julia and JavaScript.
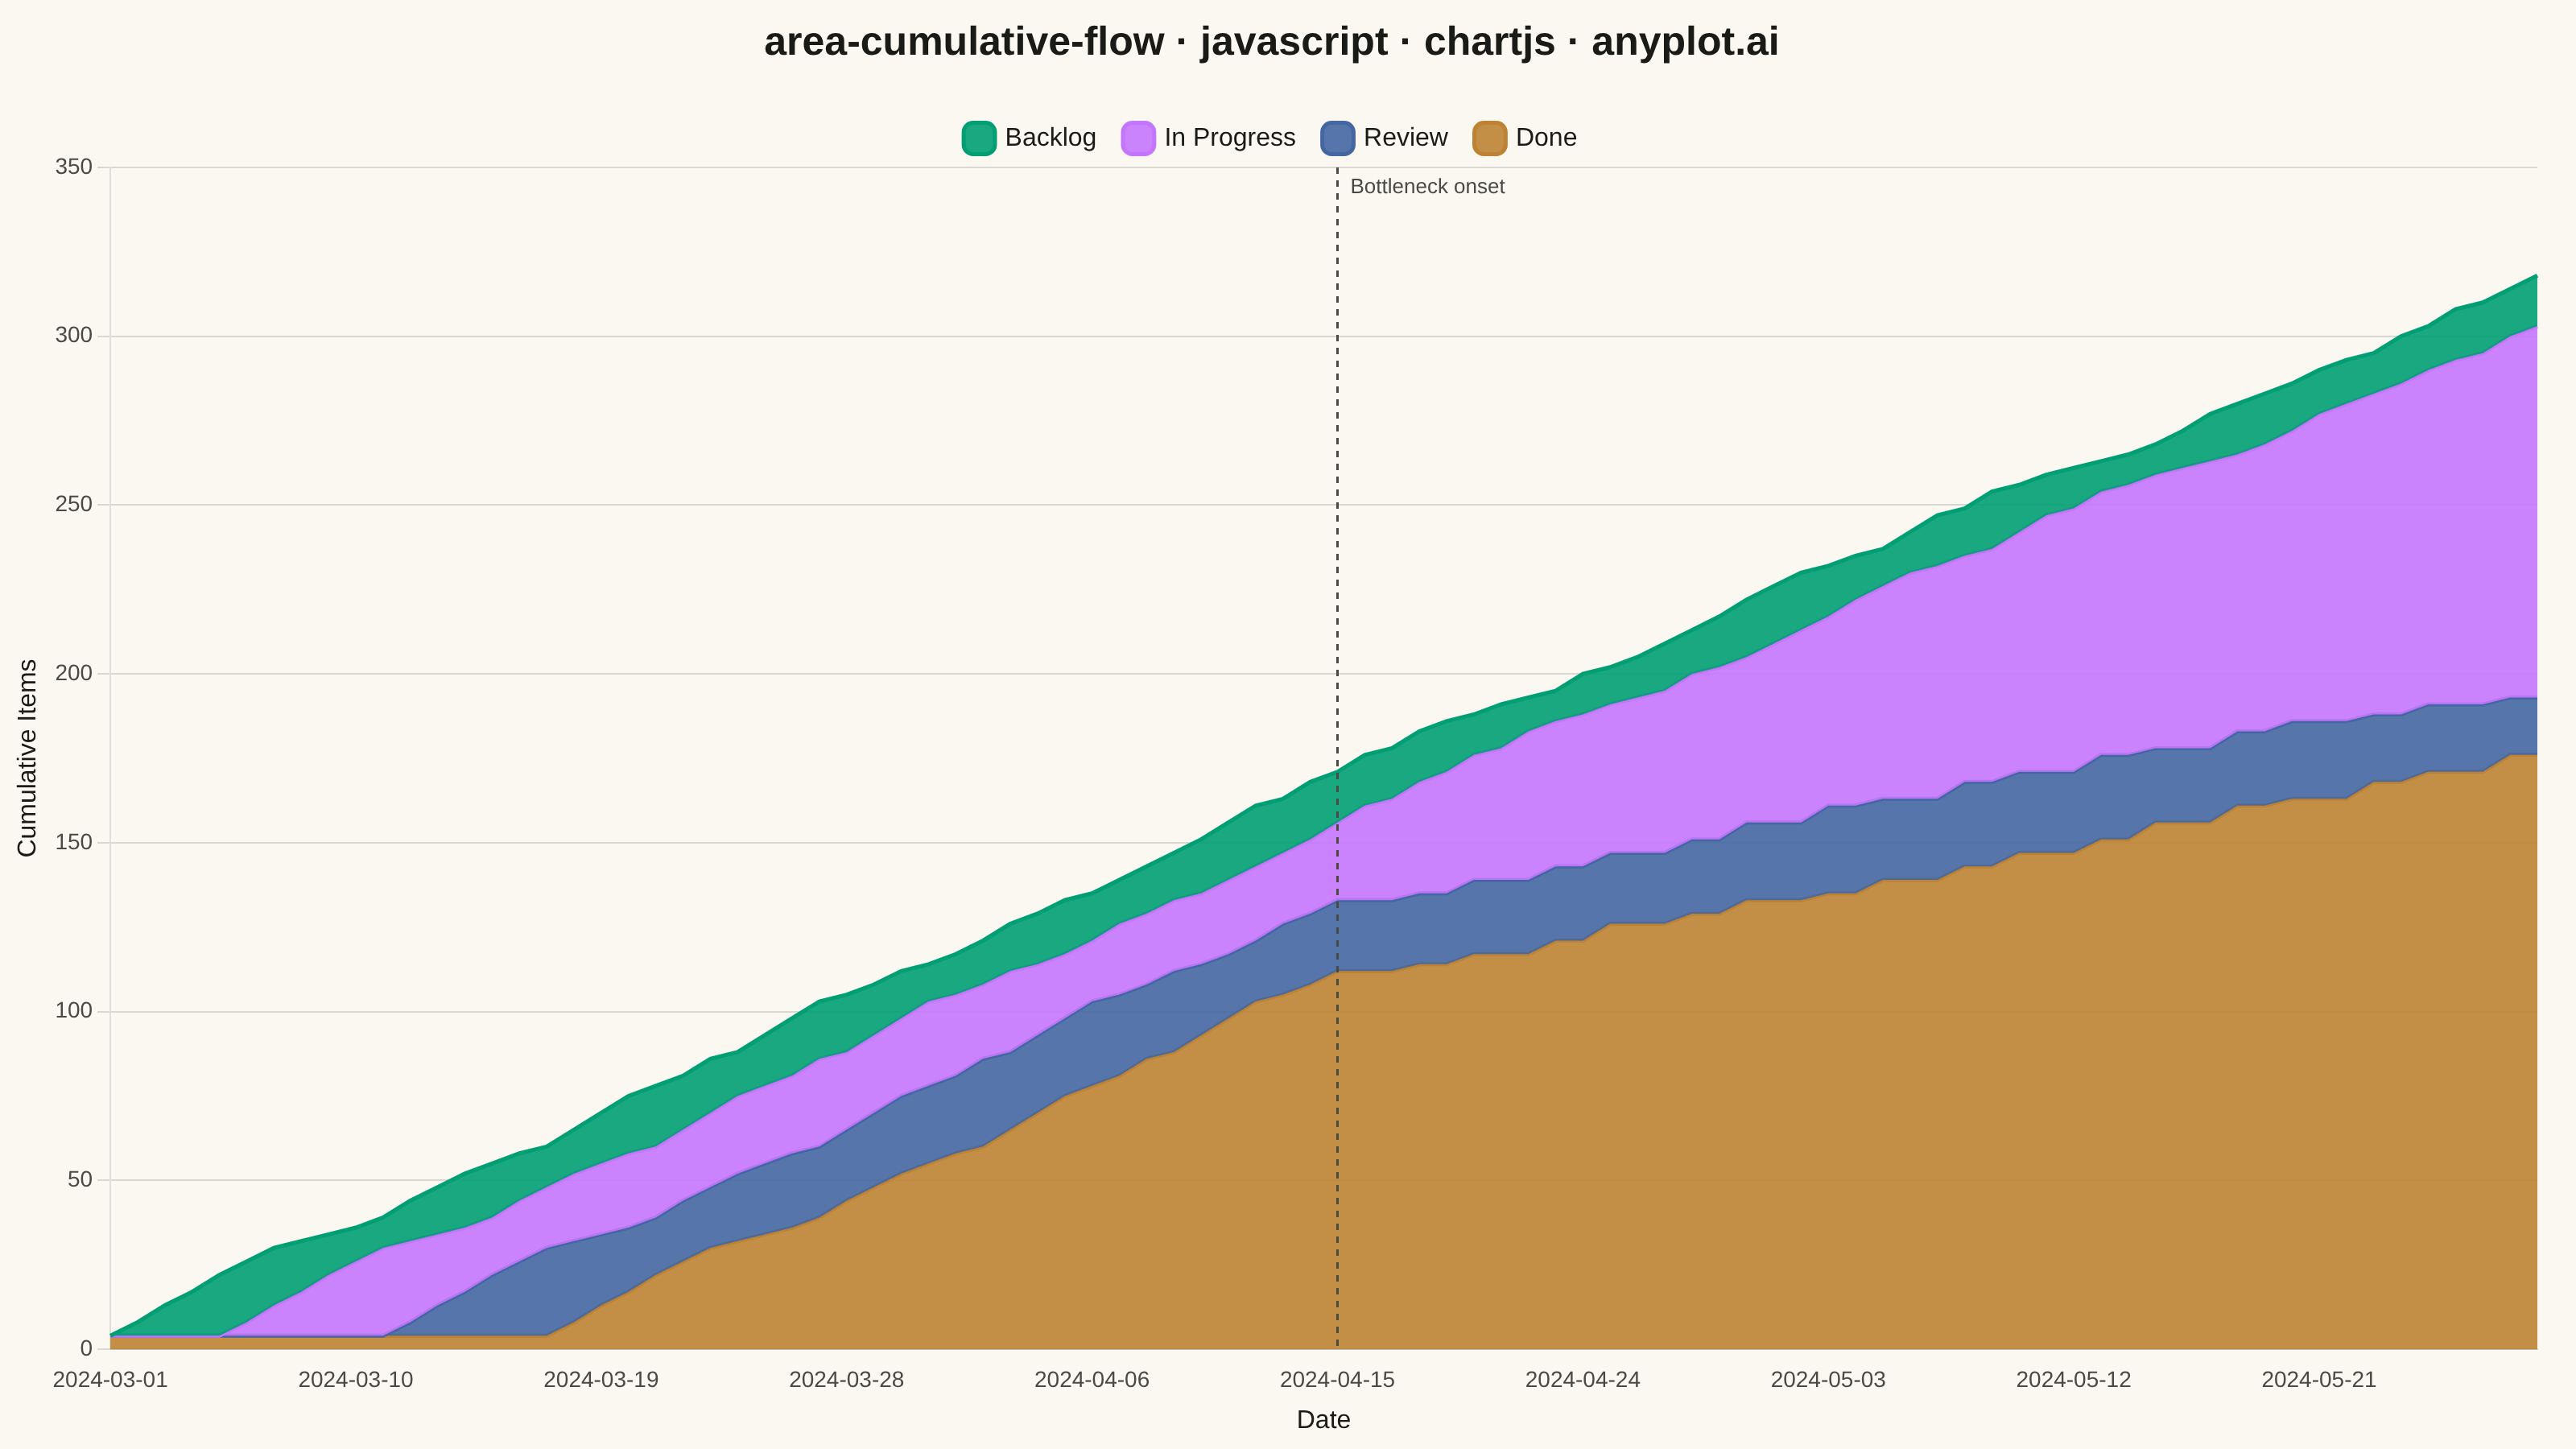
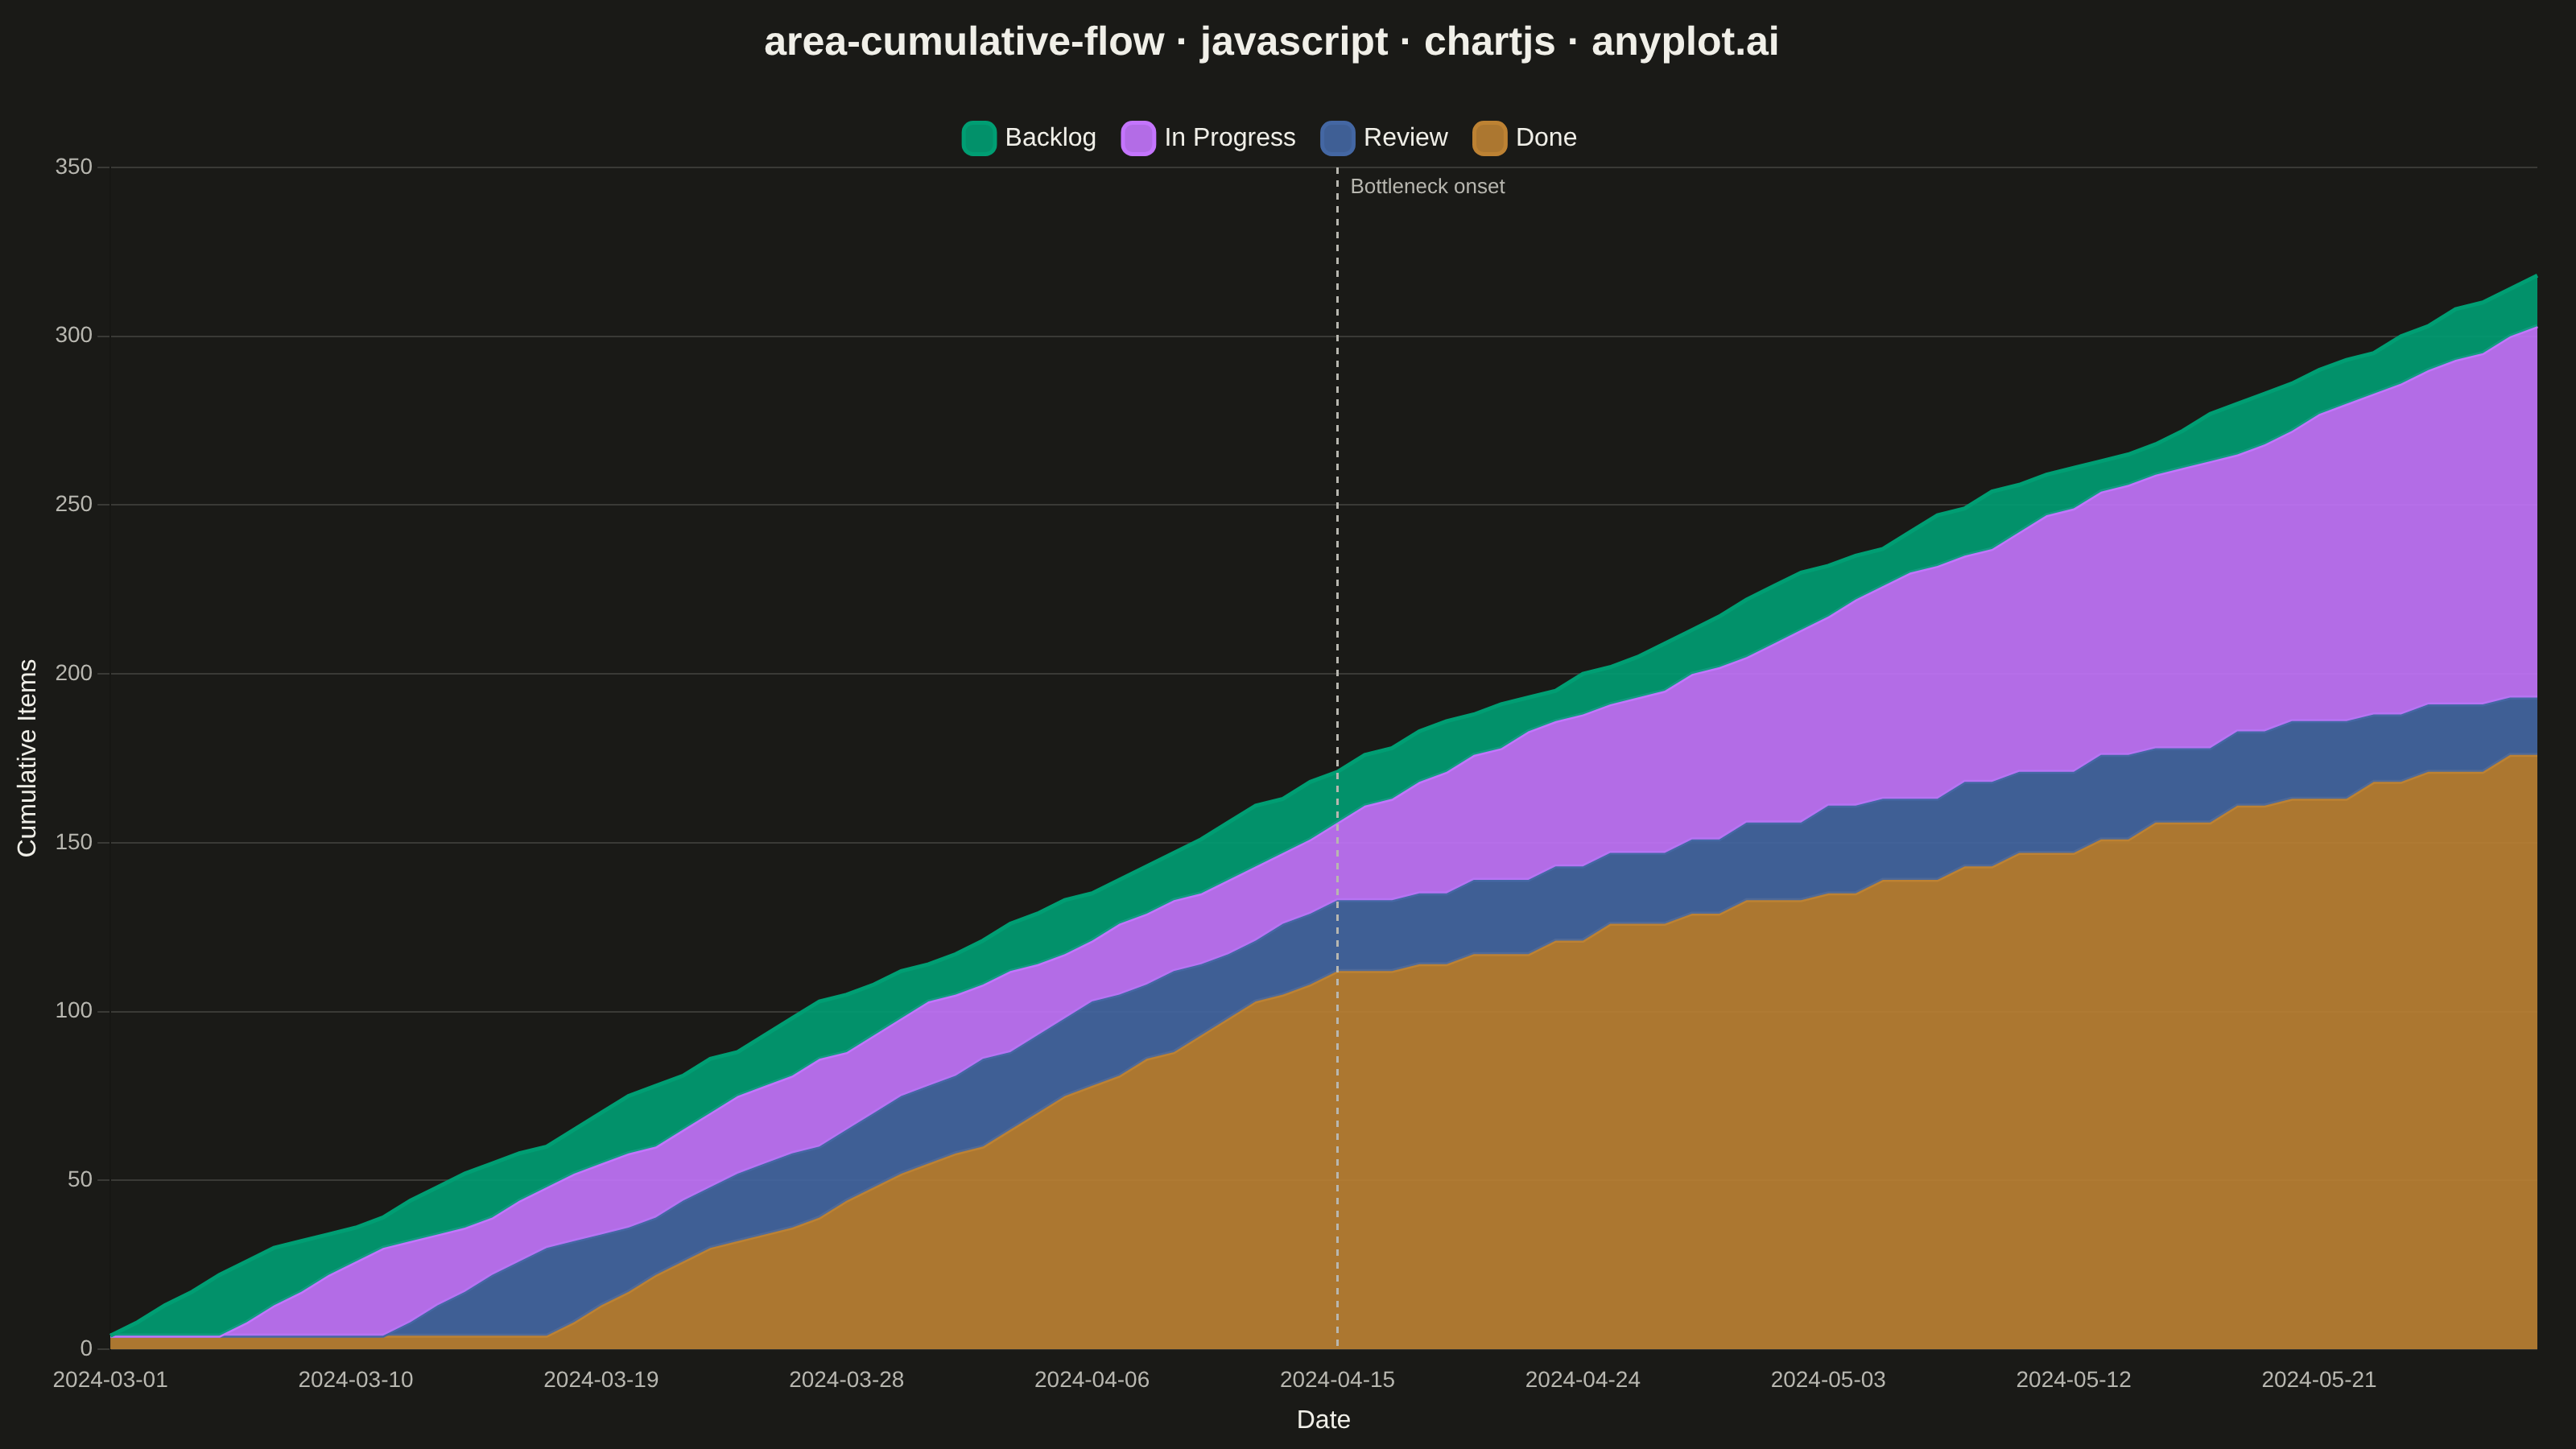
A cumulative flow diagram (CFD) displays the cumulative count of items in each workflow stage as stacked areas over time. Each band represents a stage (e.g., Backlog, In Progress, Done), and the vertical distance between two adjacent band boundaries shows the number of items currently in that stage (work-in-progress). This is a key visualization in Lean and Agile project management for identifying bottlenecks, monitoring throughput, and assessing flow efficiency across a delivery pipeline.
// anyplot.ai
// area-cumulative-flow: Cumulative Flow Diagram for Workflow Analytics
// Library: chartjs 4.4.7 | JavaScript 22.23.2
// Quality: 92/100 | Created: 2026-08-18
//# anyplot-orientation: landscape

const t = window.ANYPLOT_TOKENS;

// --- Data (in-memory, deterministic) ----------------------------------------
// Simulates a 90-day Kanban board: Backlog -> In Progress -> Review -> Done.
// Each stage's cumulative count is the total number of items that have ever
// reached that stage. Downstream stages lag behind Backlog by a per-stage
// delay, so backlog >= inProgress >= review >= done at every date. The Review
// delay widens after day 45 to simulate a bottleneck (growing "In Progress"
// band).
let seed = 42;
const nextRand = () => {
  seed = (seed * 1103515245 + 12345) & 0x7fffffff;
  return seed / 0x7fffffff;
};

const DAYS = 90;
const START_DATE = new Date("2024-03-01T00:00:00Z");

const dateLabels = [];
const backlog = [];
let backlogTotal = 0;
for (let day = 0; day < DAYS; day++) {
  const d = new Date(START_DATE);
  d.setUTCDate(d.getUTCDate() + day);
  dateLabels.push(d.toISOString().slice(0, 10));

  backlogTotal += 2 + Math.floor(nextRand() * 4); // 2-5 new items/day
  backlog.push(backlogTotal);
}

const LAG_IN_PROGRESS = 4;
const inProgress = [];
const review = [];
const done = [];
for (let day = 0; day < DAYS; day++) {
  const lagReview = day < 45 ? 10 : 10 + (day - 45) * 0.6;
  const lagDone = lagReview + 6;

  const idxInProgress = Math.min(DAYS - 1, Math.floor(Math.max(0, day - LAG_IN_PROGRESS)));
  const idxReview = Math.min(DAYS - 1, Math.floor(Math.max(0, day - lagReview)));
  const idxDone = Math.min(DAYS - 1, Math.floor(Math.max(0, day - lagDone)));

  inProgress.push(backlog[idxInProgress]);
  review.push(backlog[idxReview]);
  done.push(backlog[idxDone]);
}

// Stacked top (Backlog, earliest stage) to bottom (Done, latest stage). Each
// band fills to the next stage's line, so the visible area is the WIP
// currently sitting in that stage — not a running sum of the raw values.
const stages = [
  { label: "Backlog", data: backlog, fill: 1 },
  { label: "In Progress", data: inProgress, fill: 2 },
  { label: "Review", data: review, fill: 3 },
  { label: "Done", data: done, fill: "origin" },
];

// Day the Review lag starts widening (see lagReview above) — the onset of the
// growing "In Progress" WIP bottleneck the data was constructed to show.
const BOTTLENECK_DAY = 45;

// A thin dashed reference line + label marking that onset, drawn with
// Chart.js's native per-chart plugin hook (no external annotation plugin).
const bottleneckMarkerPlugin = {
  id: "bottleneckMarker",
  afterDraw(chart) {
    const { ctx, chartArea, scales } = chart;
    const x = scales.x.getPixelForValue(dateLabels[BOTTLENECK_DAY], BOTTLENECK_DAY);
    ctx.save();
    ctx.strokeStyle = t.inkSoft;
    ctx.lineWidth = 1.5;
    ctx.setLineDash([4, 4]);
    ctx.beginPath();
    ctx.moveTo(x, chartArea.top);
    ctx.lineTo(x, chartArea.bottom);
    ctx.stroke();

    ctx.setLineDash([]);
    ctx.fillStyle = t.inkSoft;
    ctx.font = "13px sans-serif";
    ctx.textAlign = "left";
    ctx.textBaseline = "top";
    ctx.fillText("Bottleneck onset", x + 8, chartArea.top + 6);
    ctx.restore();
  },
};

// --- Mount -------------------------------------------------------------------
const canvas = document.createElement("canvas");
document.getElementById("container").appendChild(canvas);

// --- Chart ---------------------------------------------------------------
new Chart(canvas, {
  type: "line",
  data: {
    labels: dateLabels,
    datasets: stages.map((stage, i) => ({
      label: stage.label,
      data: stage.data,
      borderColor: t.palette[i],
      backgroundColor: `${t.palette[i]}E6`,
      fill: stage.fill,
      borderWidth: 2.5,
      pointRadius: 0,
      tension: 0,
    })),
  },
  plugins: [bottleneckMarkerPlugin],
  options: {
    responsive: true,
    maintainAspectRatio: false,
    animation: false,
    interaction: { intersect: false, mode: "index" },
    layout: { padding: { top: 8, right: 24, bottom: 4, left: 4 } },
    plugins: {
      title: {
        display: true,
        text: "area-cumulative-flow · javascript · chartjs · anyplot.ai",
        color: t.ink,
        font: { size: 25, weight: "bold" },
        padding: { top: 4, bottom: 18 },
      },
      legend: {
        labels: { color: t.ink, font: { size: 16 }, usePointStyle: true, pointStyle: "rectRounded", padding: 18 },
      },
    },
    scales: {
      x: {
        ticks: { color: t.inkSoft, font: { size: 14 }, maxTicksLimit: 10, maxRotation: 0 },
        grid: { display: false },
        title: { display: true, text: "Date", color: t.ink, font: { size: 16 } },
      },
      y: {
        beginAtZero: true,
        ticks: { color: t.inkSoft, font: { size: 14 } },
        grid: { color: t.grid },
        title: { display: true, text: "Cumulative Items", color: t.ink, font: { size: 16 } },
      },
    },
  },
});
Runnable source as JSON, for any HTTP client: https://api.anyplot.ai/specs/area-cumulative-flow/chartjs/code. Any spec id and library id listed in llms-full.txt fit the same URL shape; every URL below is complete and callable.
{
  "spec_id": "area-cumulative-flow",
  "language": "javascript",
  "library": "chartjs",
  "page": "https://anyplot.ai/area-cumulative-flow/javascript/chartjs",
  "hub": "https://anyplot.ai/area-cumulative-flow",
  "code_json": "https://api.anyplot.ai/specs/area-cumulative-flow/chartjs/code",
  "spec_json": "https://api.anyplot.ai/specs/area-cumulative-flow",
  "render_light_png": "https://storage.googleapis.com/anyplot-images/plots/area-cumulative-flow/javascript/chartjs/plot-light.png",
  "render_dark_png": "https://storage.googleapis.com/anyplot-images/plots/area-cumulative-flow/javascript/chartjs/plot-dark.png",
  "interactive_light_html": "https://storage.googleapis.com/anyplot-images/plots/area-cumulative-flow/javascript/chartjs/plot-light.html",
  "interactive_dark_html": "https://storage.googleapis.com/anyplot-images/plots/area-cumulative-flow/javascript/chartjs/plot-dark.html",
  "quality_score": 92.0,
  "license": "MIT",
  "guide": "https://anyplot.ai/llms.txt"
}
Part of Cumulative Flow Diagram for Workflow Analytics on anyplot.ai.