The same plot in 14 other libraries — Python: Altair, Bokeh, lets-plot, Plotly, plotnine, Pygal, Seaborn; R: ggplot2; Julia: Makie.jl; JavaScript: Chart.js, D3.js, Apache ECharts, Highcharts, MUI X Charts. Compare all 15 side by side: Cumulative Flow Diagram for Workflow Analytics in Python, R, Julia and JavaScript.
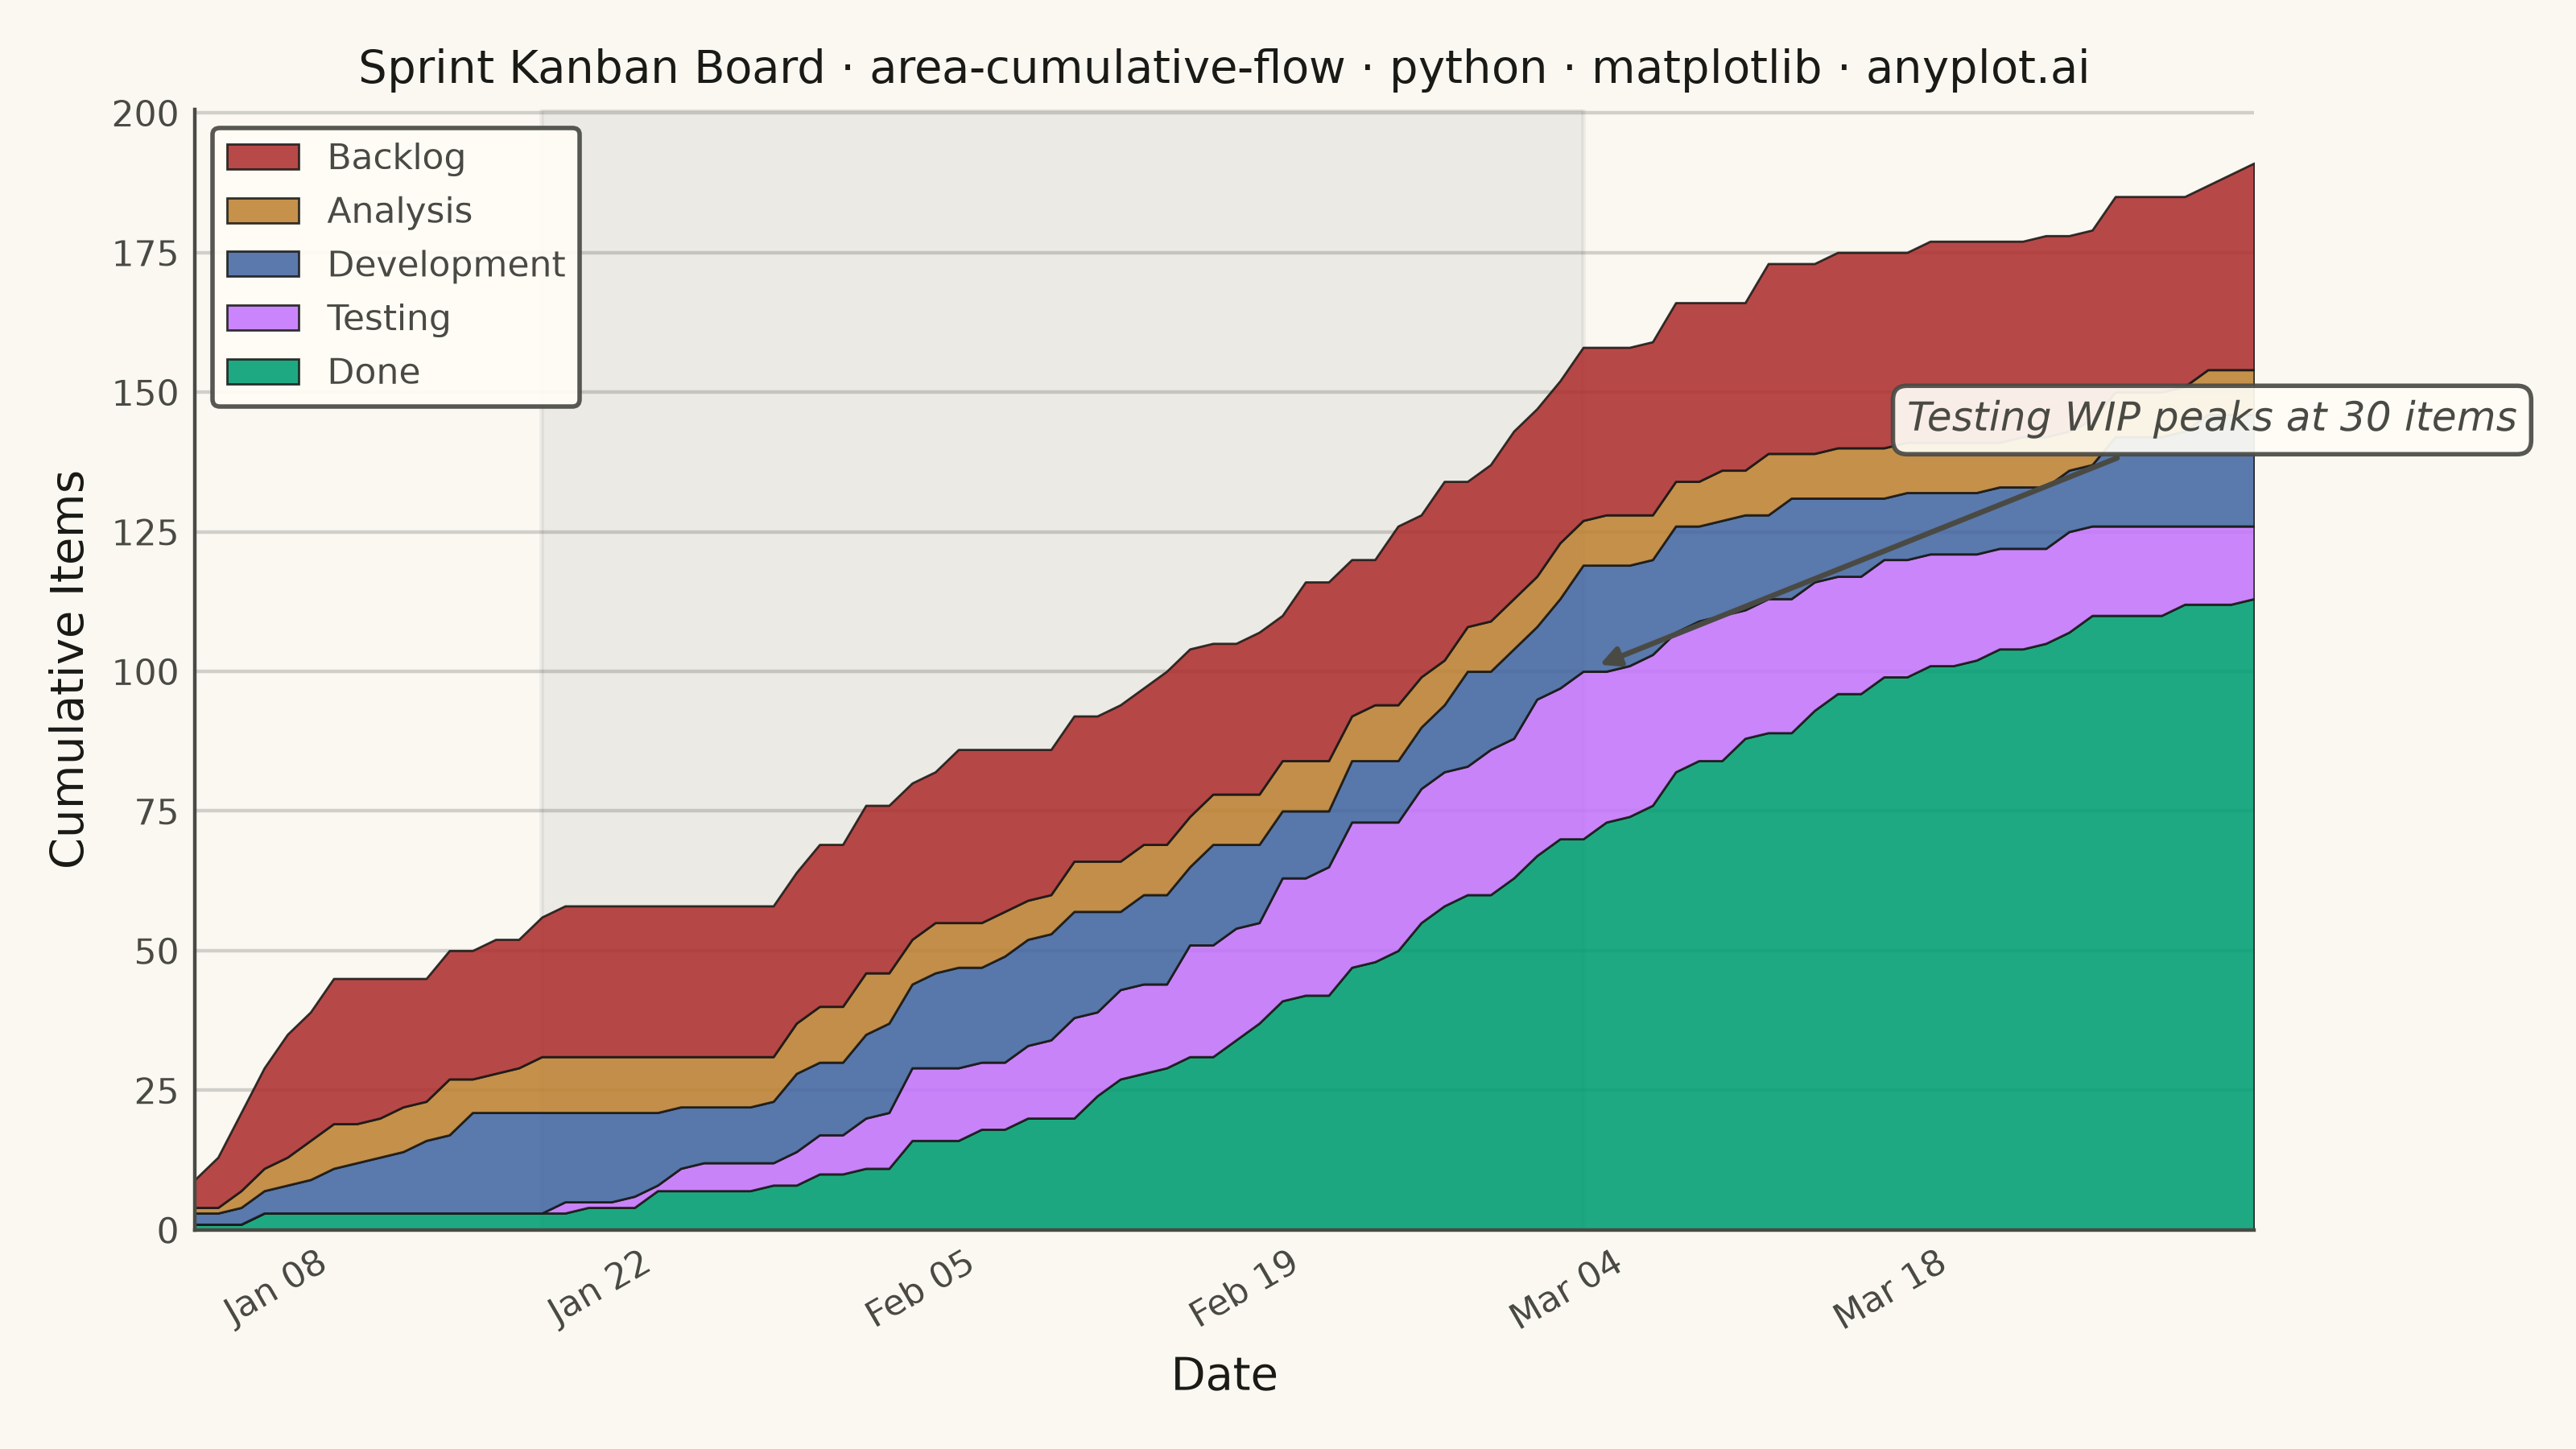
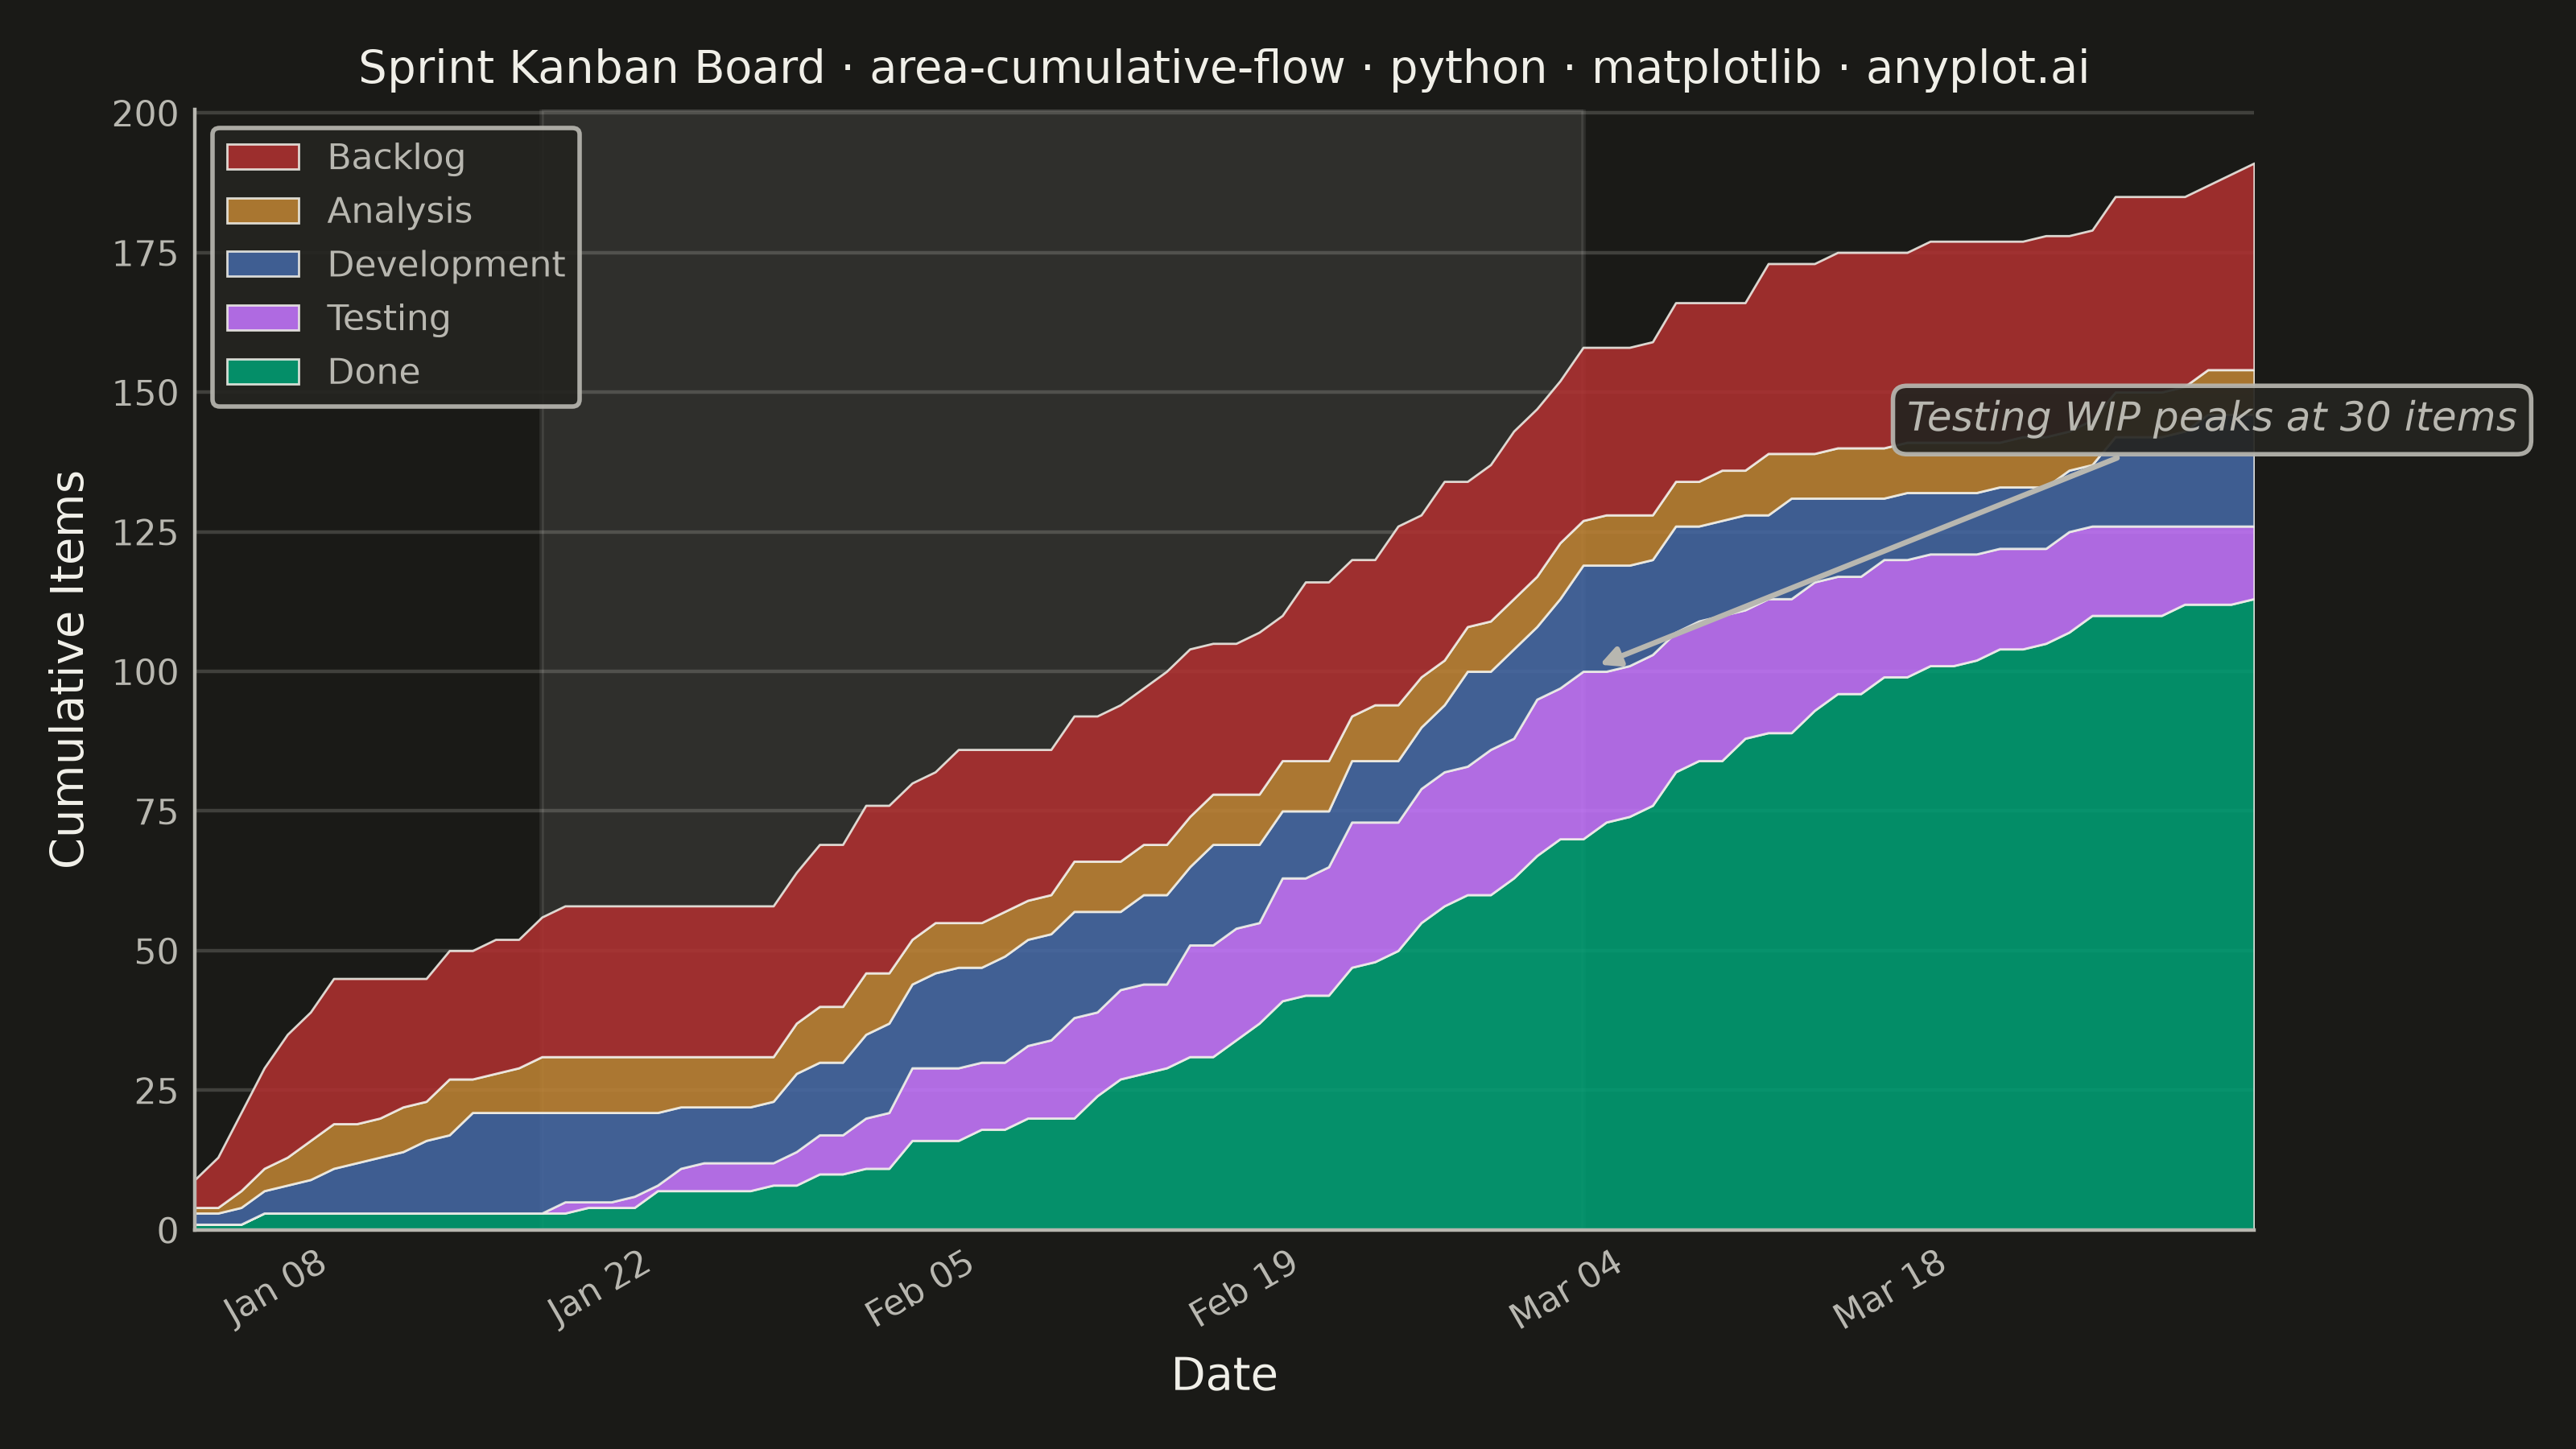
A cumulative flow diagram (CFD) displays the cumulative count of items in each workflow stage as stacked areas over time. Each band represents a stage (e.g., Backlog, In Progress, Done), and the vertical distance between two adjacent band boundaries shows the number of items currently in that stage (work-in-progress). This is a key visualization in Lean and Agile project management for identifying bottlenecks, monitoring throughput, and assessing flow efficiency across a delivery pipeline.
""" anyplot.ai
area-cumulative-flow: Cumulative Flow Diagram for Workflow Analytics
Library: matplotlib 3.11.1 | Python 3.13.15
Quality: 95/100 | Updated: 2026-08-18
"""

import sys


# Prevent this file from shadowing the installed matplotlib package when run
# from its own directory (sys.path[0] would otherwise resolve to this file).
sys.path.pop(0)

import os

import matplotlib.dates as mdates
import matplotlib.pyplot as plt
import numpy as np
import pandas as pd


# Theme tokens
THEME = os.getenv("ANYPLOT_THEME", "light")
PAGE_BG = "#FAF8F1" if THEME == "light" else "#1A1A17"
ELEVATED_BG = "#FFFDF6" if THEME == "light" else "#242420"
INK = "#1A1A17" if THEME == "light" else "#F0EFE8"
INK_SOFT = "#4A4A44" if THEME == "light" else "#B8B7B0"

# Okabe-Ito positions 1-5 (bottom to top: Done → Backlog)
COLORS = ["#009E73", "#C475FD", "#4467A3", "#BD8233", "#AE3030"]

# Data: 90-day software Kanban board simulation
np.random.seed(42)
n_days = 90
dates = pd.date_range("2024-01-02", periods=n_days, freq="D")
t = np.arange(n_days)

# Build cumulative counts from Done upward; each layer stacks WIP above the previous
# Done: S-curve — accelerates through the sprint
done_raw = 120 * (1 / (1 + np.exp(-(t - 55) / 12)))
done_raw -= done_raw[0]
done = np.maximum.accumulate(np.maximum(np.round(done_raw + np.random.normal(0, 1.5, n_days)).astype(int), 0))

# Testing: widens as a bottleneck builds from day 15-60, then drains
wip_testing = np.zeros(n_days)
wip_testing[15:60] = np.linspace(0, 28, 45) + np.random.normal(0, 1.5, 45)
wip_testing[60:] = np.linspace(28, 12, n_days - 60) + np.random.normal(0, 1.0, n_days - 60)
wip_testing = np.round(np.maximum(wip_testing, 0)).astype(int)
testing = np.maximum.accumulate(done + wip_testing)

# Development: steady ~14 items, slight oscillation
wip_dev = np.round(14 + 4 * np.sin(2 * np.pi * t / 28) + np.random.normal(0, 1.5, n_days)).astype(int)
wip_dev[:12] = np.round(np.linspace(0, 14, 12)).astype(int)
wip_dev = np.maximum(wip_dev, 2)
development = np.maximum.accumulate(testing + wip_dev)

# Analysis: small buffer of ~8 items
wip_analysis = np.round(8 + np.random.normal(0, 1.2, n_days)).astype(int)
wip_analysis[:7] = np.round(np.linspace(0, 8, 7)).astype(int)
wip_analysis = np.maximum(wip_analysis, 1)
analysis = np.maximum.accumulate(development + wip_analysis)

# Backlog: grows as new work arrives faster than it's pulled
wip_backlog = np.round(22 + np.linspace(0, 12, n_days) + np.random.normal(0, 2.0, n_days)).astype(int)
wip_backlog[:5] = np.round(np.linspace(5, 22, 5)).astype(int)
wip_backlog = np.maximum(wip_backlog, 5)
backlog = np.maximum.accumulate(analysis + wip_backlog)

# Layer contributions (bottom to top in stackplot order)
c_done = done.astype(float)
c_testing = np.maximum(testing - done, 0).astype(float)
c_development = np.maximum(development - testing, 0).astype(float)
c_analysis = np.maximum(analysis - development, 0).astype(float)
c_backlog = np.maximum(backlog - analysis, 0).astype(float)

# Peak of the Testing bottleneck band — drives the callout annotation below
peak_idx = int(np.argmax(c_testing))
peak_wip = int(round(c_testing[peak_idx]))
peak_top = float(testing[peak_idx])

# Plot — canonical 3200x1800 landscape canvas (figsize x dpi = 8 x 400, 4.5 x 400)
fig, ax = plt.subplots(figsize=(8, 4.5), dpi=400, facecolor=PAGE_BG)
ax.set_facecolor(PAGE_BG)

stage_labels = ["Done", "Testing", "Development", "Analysis", "Backlog"]

ax.stackplot(
    dates,
    c_done,
    c_testing,
    c_development,
    c_analysis,
    c_backlog,
    labels=stage_labels,
    colors=COLORS,
    alpha=0.88,
    edgecolor=INK,
    linewidth=0.5,
)

# Style
title = "Sprint Kanban Board · area-cumulative-flow · python · matplotlib · anyplot.ai"
title_fontsize = max(8, round(12 * 67 / len(title))) if len(title) > 67 else 12
ax.set_xlabel("Date", fontsize=10, color=INK)
ax.set_ylabel("Cumulative Items", fontsize=10, color=INK)
ax.set_title(title, fontsize=title_fontsize, fontweight="medium", color=INK)
ax.tick_params(axis="both", labelsize=8, colors=INK_SOFT, length=0)

# X-axis: bi-weekly date ticks
ax.xaxis.set_major_formatter(mdates.DateFormatter("%b %d"))
ax.xaxis.set_major_locator(mdates.WeekdayLocator(byweekday=mdates.MO, interval=2))
plt.setp(ax.get_xticklabels(), rotation=30, ha="right", color=INK_SOFT)
plt.setp(ax.get_yticklabels(), color=INK_SOFT)

ax.set_xlim(dates[0], dates[-1])

# Spines
ax.spines["top"].set_visible(False)
ax.spines["right"].set_visible(False)
for spine in ("left", "bottom"):
    ax.spines[spine].set_color(INK_SOFT)

# Grid (y-axis only, subtle)
ax.yaxis.grid(True, alpha=0.18, linewidth=0.8, color=INK)
ax.set_axisbelow(True)

# Shaded region highlighting Testing bottleneck buildup (days 15–60) — tint
# drawn from INK rather than a categorical data color, with a theme-adaptive
# alpha, so the highlight carries similar visual weight in both themes
highlight_alpha = 0.06 if THEME == "light" else 0.10
ax.axvspan(dates[15], dates[60], alpha=highlight_alpha, color=INK, zorder=0)

# Arrow-annotated callout quantifying the bottleneck peak, with an elevated box
# for typographic hierarchy beyond the title/axis/tick levels
ax.annotate(
    f"Testing WIP peaks at {peak_wip} items",
    xy=(dates[peak_idx], peak_top),
    xytext=(dates[min(peak_idx + 14, len(dates) - 1)], peak_top + 45),
    ha="left",
    va="center",
    fontsize=9,
    color=INK_SOFT,
    style="italic",
    arrowprops={"arrowstyle": "-|>", "color": INK_SOFT, "lw": 1.2, "shrinkA": 2, "shrinkB": 4},
    bbox={"facecolor": ELEVATED_BG, "edgecolor": INK_SOFT, "alpha": 0.92, "boxstyle": "round,pad=0.35"},
)

# Legend — reversed so Backlog appears at top, matching visual stacking order
handles, labels = ax.get_legend_handles_labels()
leg = ax.legend(handles[::-1], labels[::-1], loc="upper left", fontsize=8, framealpha=0.92)
leg.get_frame().set_facecolor(ELEVATED_BG)
leg.get_frame().set_edgecolor(INK_SOFT)
plt.setp(leg.get_texts(), color=INK_SOFT)

plt.tight_layout()
_out = os.path.join(os.path.dirname(os.path.abspath(__file__)), f"plot-{THEME}.png")
plt.savefig(_out, dpi=400, facecolor=PAGE_BG)  # bbox_inches MUST stay default (None) — see canvas contract
Runnable source as JSON, for any HTTP client: https://api.anyplot.ai/specs/area-cumulative-flow/matplotlib/code. Any spec id and library id listed in llms-full.txt fit the same URL shape; every URL below is complete and callable.
{
  "spec_id": "area-cumulative-flow",
  "language": "python",
  "library": "matplotlib",
  "page": "https://anyplot.ai/area-cumulative-flow/python/matplotlib",
  "hub": "https://anyplot.ai/area-cumulative-flow",
  "code_json": "https://api.anyplot.ai/specs/area-cumulative-flow/matplotlib/code",
  "spec_json": "https://api.anyplot.ai/specs/area-cumulative-flow",
  "render_light_png": "https://storage.googleapis.com/anyplot-images/plots/area-cumulative-flow/python/matplotlib/plot-light.png",
  "render_dark_png": "https://storage.googleapis.com/anyplot-images/plots/area-cumulative-flow/python/matplotlib/plot-dark.png",
  "quality_score": 95.0,
  "license": "MIT",
  "guide": "https://anyplot.ai/llms.txt"
}
Part of Cumulative Flow Diagram for Workflow Analytics on anyplot.ai.