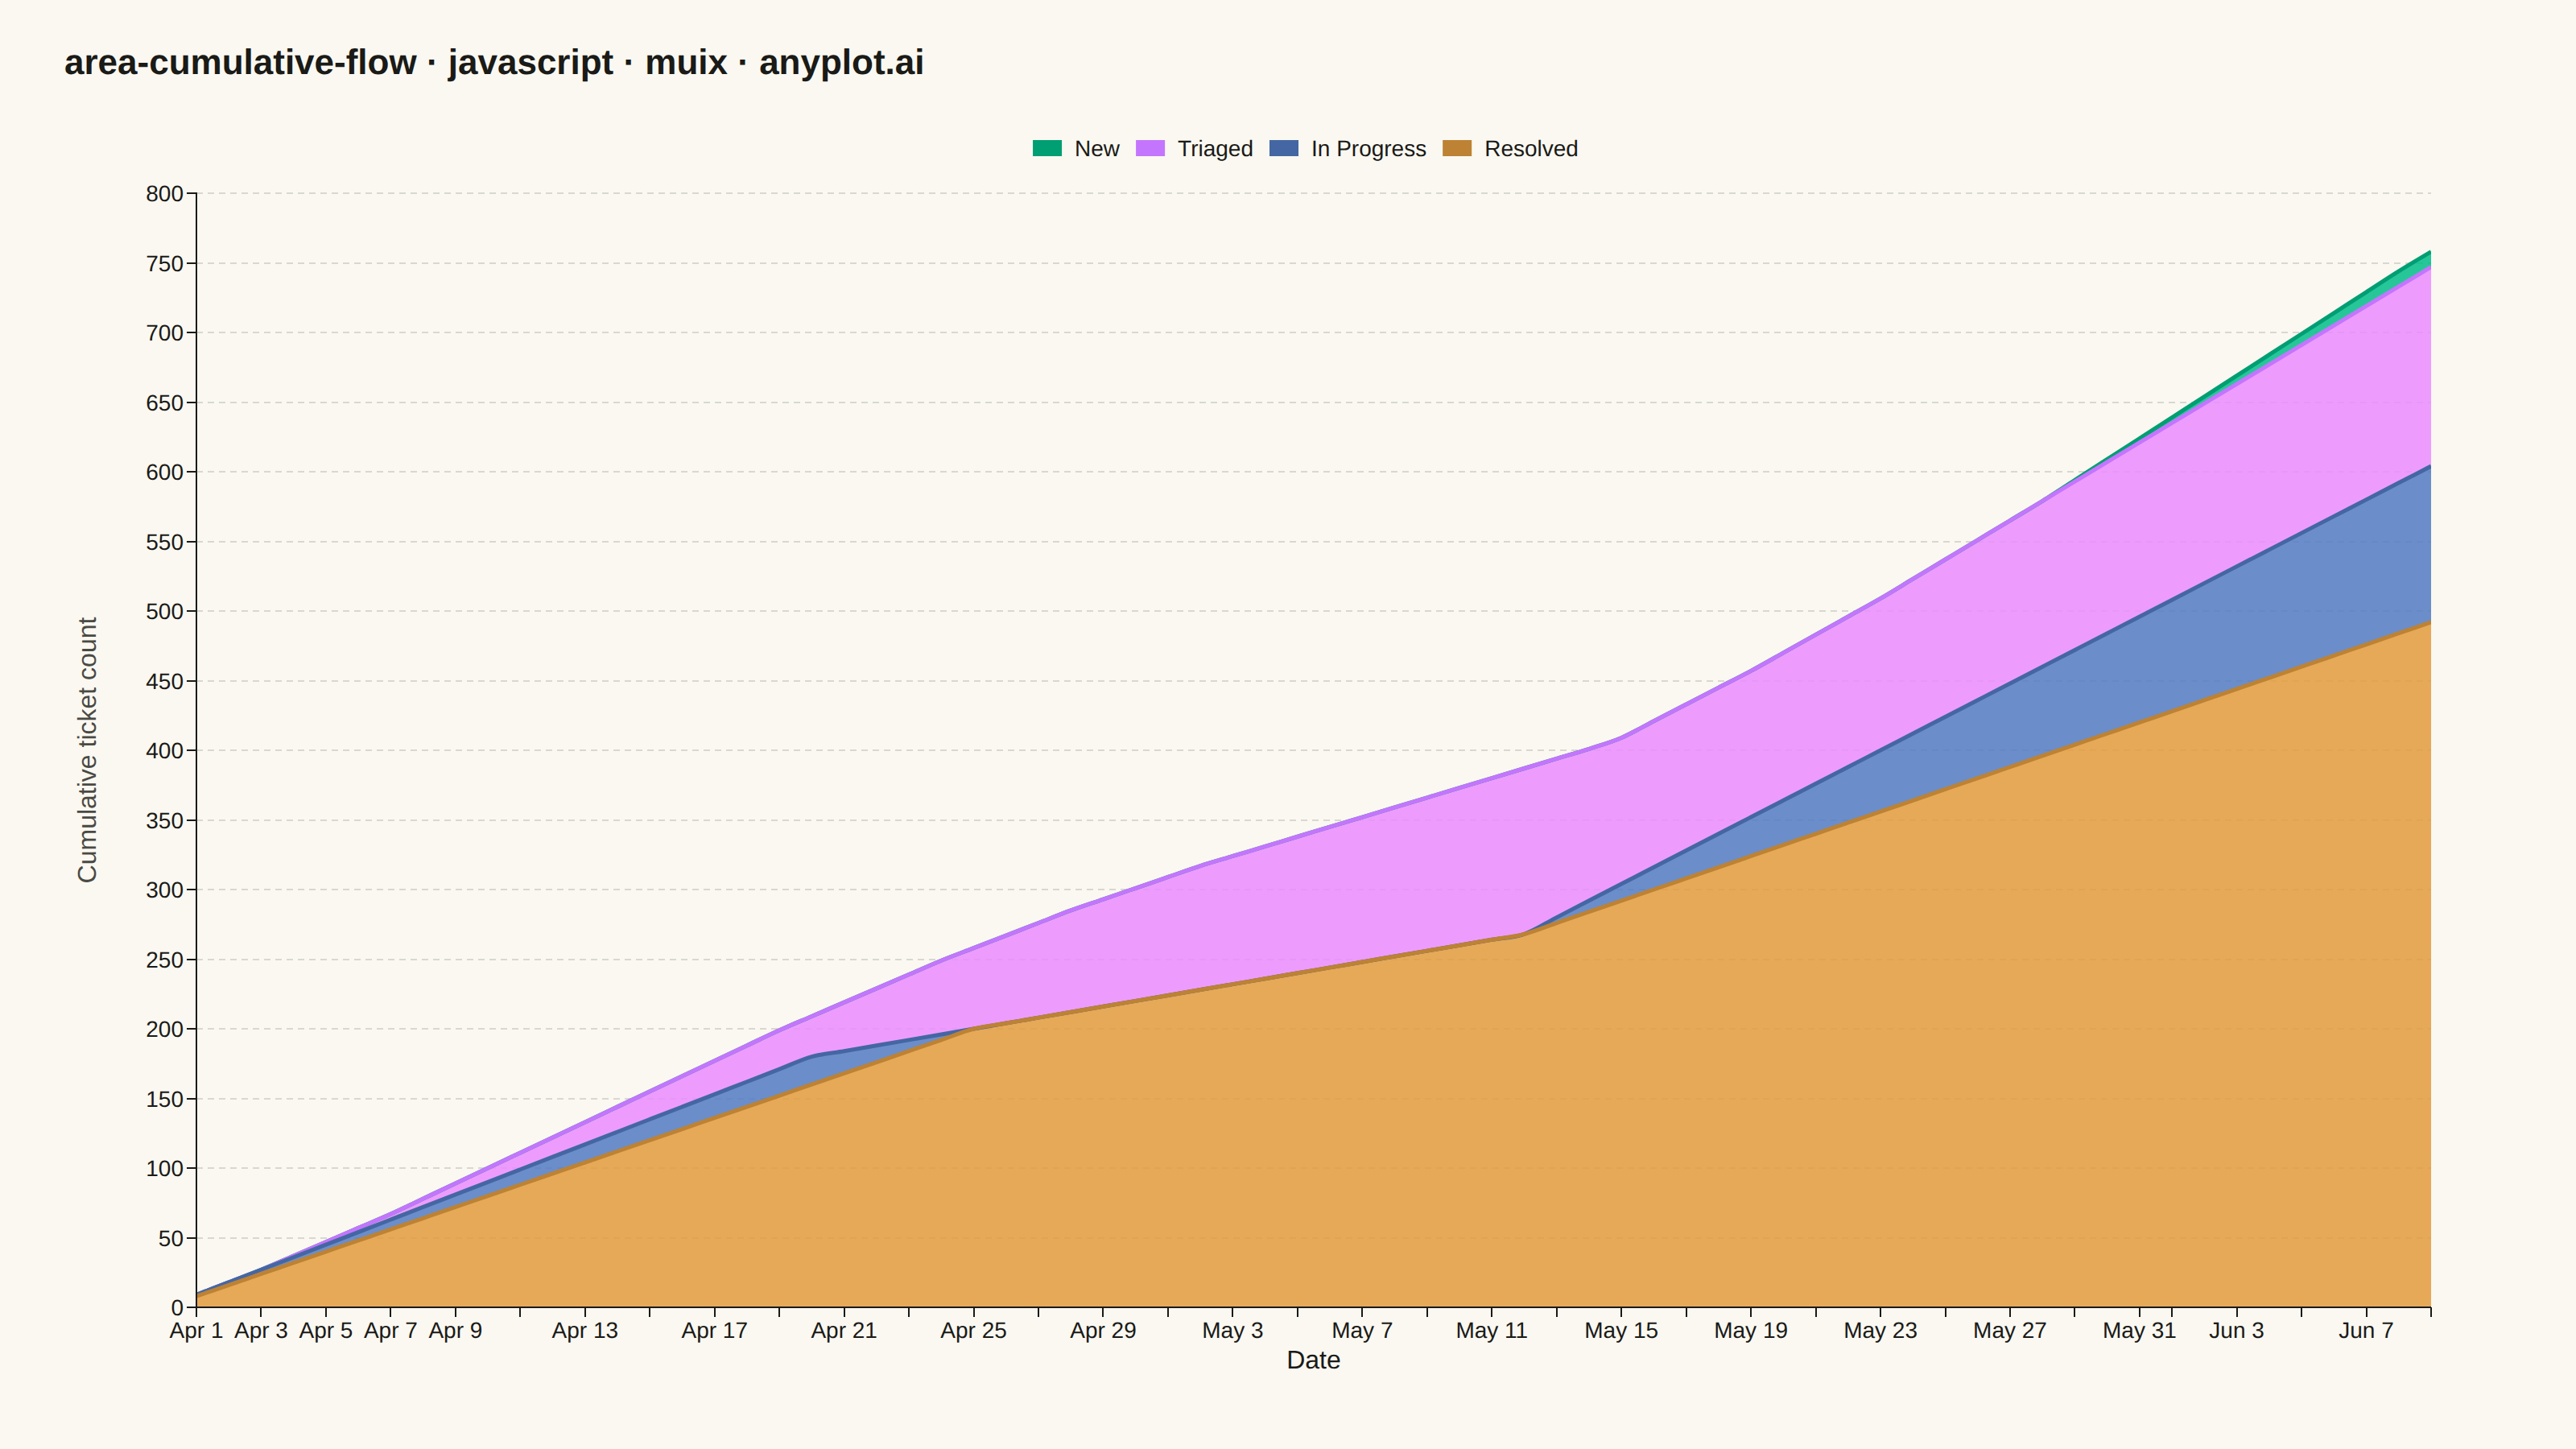
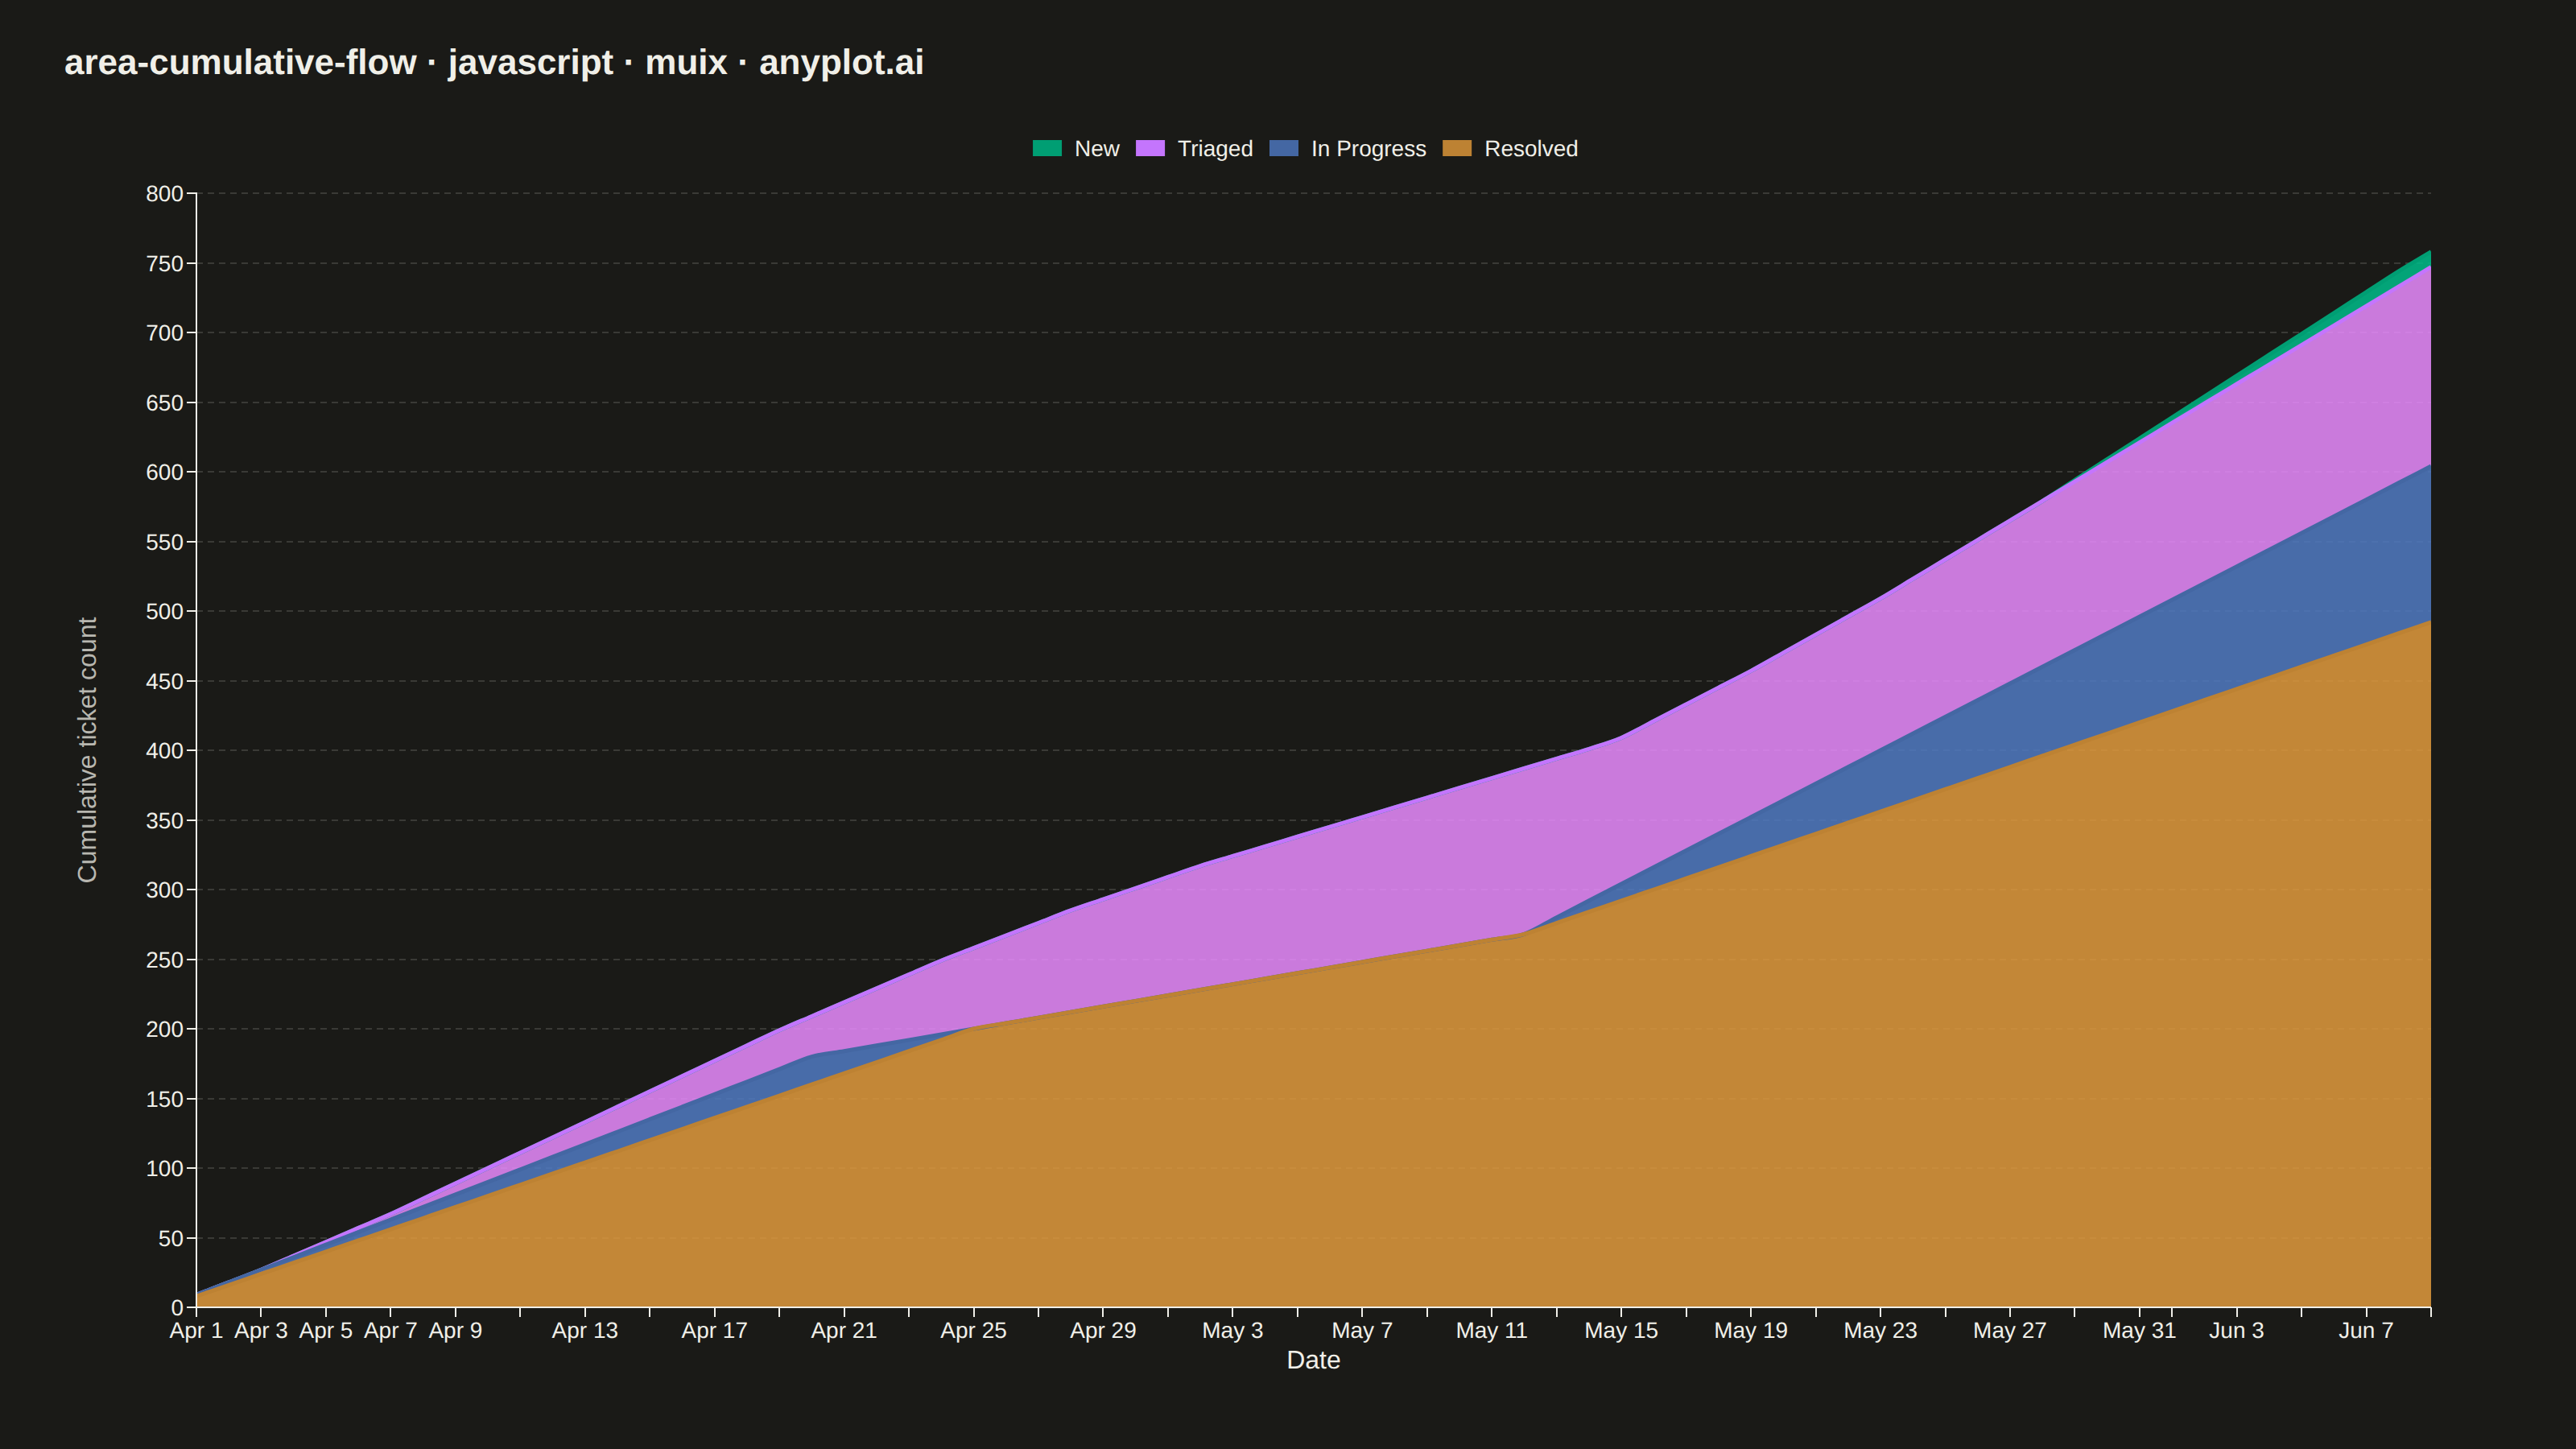
The same plot in 14 other libraries — JavaScript: Chart.js, D3.js, Apache ECharts, Highcharts; Python: Altair, Bokeh, lets-plot, Matplotlib, Plotly, plotnine, Pygal, Seaborn; R: ggplot2; Julia: Makie.jl. Compare all 15 side by side: Cumulative Flow Diagram for Workflow Analytics in Python, R, Julia and JavaScript.
A cumulative flow diagram (CFD) displays the cumulative count of items in each workflow stage as stacked areas over time. Each band represents a stage (e.g., Backlog, In Progress, Done), and the vertical distance between two adjacent band boundaries shows the number of items currently in that stage (work-in-progress). This is a key visualization in Lean and Agile project management for identifying bottlenecks, monitoring throughput, and assessing flow efficiency across a delivery pipeline.
// anyplot.ai
// area-cumulative-flow: Cumulative Flow Diagram for Workflow Analytics
// Library: muix 7.29.1 | JavaScript 22.23.2
// Quality: 88/100 | Created: 2026-08-19
import { LineChart } from "@mui/x-charts/LineChart";
import { Box, Typography } from "@mui/material";

const t = window.ANYPLOT_TOKENS;

// --- Data (in-memory, deterministic) ----------------------------------------
// A support-ticket board with four workflow stages, earliest to latest:
// New -> Triaged -> In Progress -> Resolved. Each stage's cumulative count is
// simulated as a queue: every day it can move at most its daily capacity of
// tickets out of the backlog handed to it by the previous stage. That keeps
// every curve monotonically non-decreasing and guarantees an earlier stage's
// cumulative count never dips below a later stage's — the CFD invariant.
const NUM_DAYS = 70;
const START_DATE = new Date(2026, 3, 1);

const dates = Array.from({ length: NUM_DAYS }, (_, day) => {
  const d = new Date(START_DATE);
  d.setDate(d.getDate() + day);
  return d;
});

// Daily new-ticket arrivals: a steady baseline plus a late-quarter surge.
const arrivalsPerDay = Array.from(
  { length: NUM_DAYS },
  (_, day) => 9 + Math.round(2 * Math.sin(day / 8)) + (day >= 45 ? 4 : 0)
);

// Per-stage daily processing capacity. Development capacity tightens for
// three weeks, then a staffing boost drains the backlog — the bottleneck
// this chart tells the story of.
const triageCapacityForDay = () => 14;
const devCapacityForDay = (day) => (day < 20 ? 9 : day < 42 ? 4 : 12);
const releaseCapacityForDay = () => 8;

const advanceQueue = (previousCumulative, capacityForDay) => {
  const cumulative = [];
  let processedTotal = 0;
  for (let day = 0; day < previousCumulative.length; day += 1) {
    const waiting = previousCumulative[day] - processedTotal;
    processedTotal += Math.min(capacityForDay(day), waiting);
    cumulative.push(processedTotal);
  }
  return cumulative;
};

const newCumulative = [];
arrivalsPerDay.reduce((total, arrivals, day) => {
  const next = total + arrivals;
  newCumulative[day] = next;
  return next;
}, 0);

const triagedCumulative = advanceQueue(newCumulative, triageCapacityForDay);
const inProgressCumulative = advanceQueue(triagedCumulative, devCapacityForDay);
const resolvedCumulative = advanceQueue(inProgressCumulative, releaseCapacityForDay);

// Band widths (work-in-progress per stage) fed to the stacked areas.
const wipNew = newCumulative.map((v, i) => v - triagedCumulative[i]);
const wipTriaged = triagedCumulative.map((v, i) => v - inProgressCumulative[i]);
const wipInProgress = inProgressCumulative.map((v, i) => v - resolvedCumulative[i]);
const wipResolved = resolvedCumulative;

const TITLE = "area-cumulative-flow · javascript · muix · anyplot.ai";

// --- Chart (default-exported component — the harness mounts it) ------------
export default function Chart() {
  const size = window.ANYPLOT_SIZE;
  const padding = { top: 28, right: 40, bottom: 24, left: 40 };
  const titleBlockHeight = 56;
  // MUI X's y-axis `label` prop offsets itself from a hardcoded `tickFontSize`
  // guess rather than the tick labels' real measured width, so with a 3-digit
  // axis it collides with the tick numbers. A hand-rotated label in its own
  // flex column sidesteps that and gives predictable, collision-free spacing.
  const yLabelWidth = 32;
  const chartWidth = size.width - padding.left - padding.right - yLabelWidth;
  const chartHeight = size.height - padding.top - padding.bottom - titleBlockHeight;

  return (
    <Box
      sx={{
        width: size.width,
        height: size.height,
        boxSizing: "border-box",
        padding: `${padding.top}px ${padding.right}px ${padding.bottom}px ${padding.left}px`,
        display: "flex",
        flexDirection: "column",
      }}
    >
      <Typography sx={{ fontSize: 22, fontWeight: 600, color: "text.primary", mb: "20px", lineHeight: 1 }}>
        {TITLE}
      </Typography>
      <Box sx={{ display: "flex", flexDirection: "row", height: chartHeight }}>
        <Box sx={{ width: yLabelWidth, display: "flex", alignItems: "center", justifyContent: "center" }}>
          <Typography
            sx={{
              fontSize: 16,
              color: "text.secondary",
              whiteSpace: "nowrap",
              transform: "rotate(-90deg)",
            }}
          >
            Cumulative ticket count
          </Typography>
        </Box>
        <LineChart
          width={chartWidth}
          height={chartHeight}
          skipAnimation
          series={[
            {
              id: "new",
              label: "New",
              data: wipNew,
              stack: "flow",
              stackOrder: "reverse",
              area: true,
              showMark: false,
              color: t.palette[0],
              valueFormatter: (v) => `${v} tickets waiting`,
            },
            {
              id: "triaged",
              label: "Triaged",
              data: wipTriaged,
              stack: "flow",
              stackOrder: "reverse",
              area: true,
              showMark: false,
              color: t.palette[1],
              valueFormatter: (v) => `${v} tickets waiting`,
            },
            {
              id: "in-progress",
              label: "In Progress",
              data: wipInProgress,
              stack: "flow",
              stackOrder: "reverse",
              area: true,
              showMark: false,
              color: t.palette[2],
              valueFormatter: (v) => `${v} tickets waiting`,
            },
            {
              id: "resolved",
              label: "Resolved",
              data: wipResolved,
              stack: "flow",
              stackOrder: "reverse",
              area: true,
              showMark: false,
              color: t.palette[3],
              valueFormatter: (v) => `${v} tickets`,
            },
          ]}
          xAxis={[
            {
              data: dates,
              scaleType: "time",
              label: "Date",
              valueFormatter: (date) => date.toLocaleDateString("en-US", { month: "short", day: "numeric" }),
              tickLabelStyle: { fontSize: 14 },
              labelStyle: { fontSize: 16 },
            },
          ]}
          yAxis={[
            {
              valueFormatter: (value) => value.toLocaleString("en-US"),
              tickLabelStyle: { fontSize: 14 },
            },
          ]}
          grid={{ horizontal: true }}
          slotProps={{
            legend: {
              direction: "row",
              labelStyle: { fontSize: 14 },
              itemMarkWidth: 18,
              itemMarkHeight: 10,
              markGap: 8,
            },
          }}
          sx={{
            "& .MuiLineElement-root": { strokeWidth: 2.5 },
            "& .MuiAreaElement-root": { fillOpacity: 0.85 },
            "& .MuiChartsGrid-line": { strokeDasharray: "4 3" },
          }}
        />
      </Box>
    </Box>
  );
}
Runnable source as JSON, for any HTTP client: https://api.anyplot.ai/specs/area-cumulative-flow/muix/code. Any spec id and library id listed in llms-full.txt fit the same URL shape; every URL below is complete and callable.
{
  "spec_id": "area-cumulative-flow",
  "language": "javascript",
  "library": "muix",
  "page": "https://anyplot.ai/area-cumulative-flow/javascript/muix",
  "hub": "https://anyplot.ai/area-cumulative-flow",
  "code_json": "https://api.anyplot.ai/specs/area-cumulative-flow/muix/code",
  "spec_json": "https://api.anyplot.ai/specs/area-cumulative-flow",
  "render_light_png": "https://storage.googleapis.com/anyplot-images/plots/area-cumulative-flow/javascript/muix/plot-light.png",
  "render_dark_png": "https://storage.googleapis.com/anyplot-images/plots/area-cumulative-flow/javascript/muix/plot-dark.png",
  "interactive_light_html": "https://storage.googleapis.com/anyplot-images/plots/area-cumulative-flow/javascript/muix/plot-light.html",
  "interactive_dark_html": "https://storage.googleapis.com/anyplot-images/plots/area-cumulative-flow/javascript/muix/plot-dark.html",
  "quality_score": 88.0,
  "license": "MIT",
  "guide": "https://anyplot.ai/llms.txt"
}
Part of Cumulative Flow Diagram for Workflow Analytics on anyplot.ai.