The same plot in 14 other libraries — JavaScript: Chart.js, D3.js, Highcharts, MUI X Charts; Python: Altair, Bokeh, lets-plot, Matplotlib, Plotly, plotnine, Pygal, Seaborn; R: ggplot2; Julia: Makie.jl. Compare all 15 side by side: Cumulative Flow Diagram for Workflow Analytics in Python, R, Julia and JavaScript.
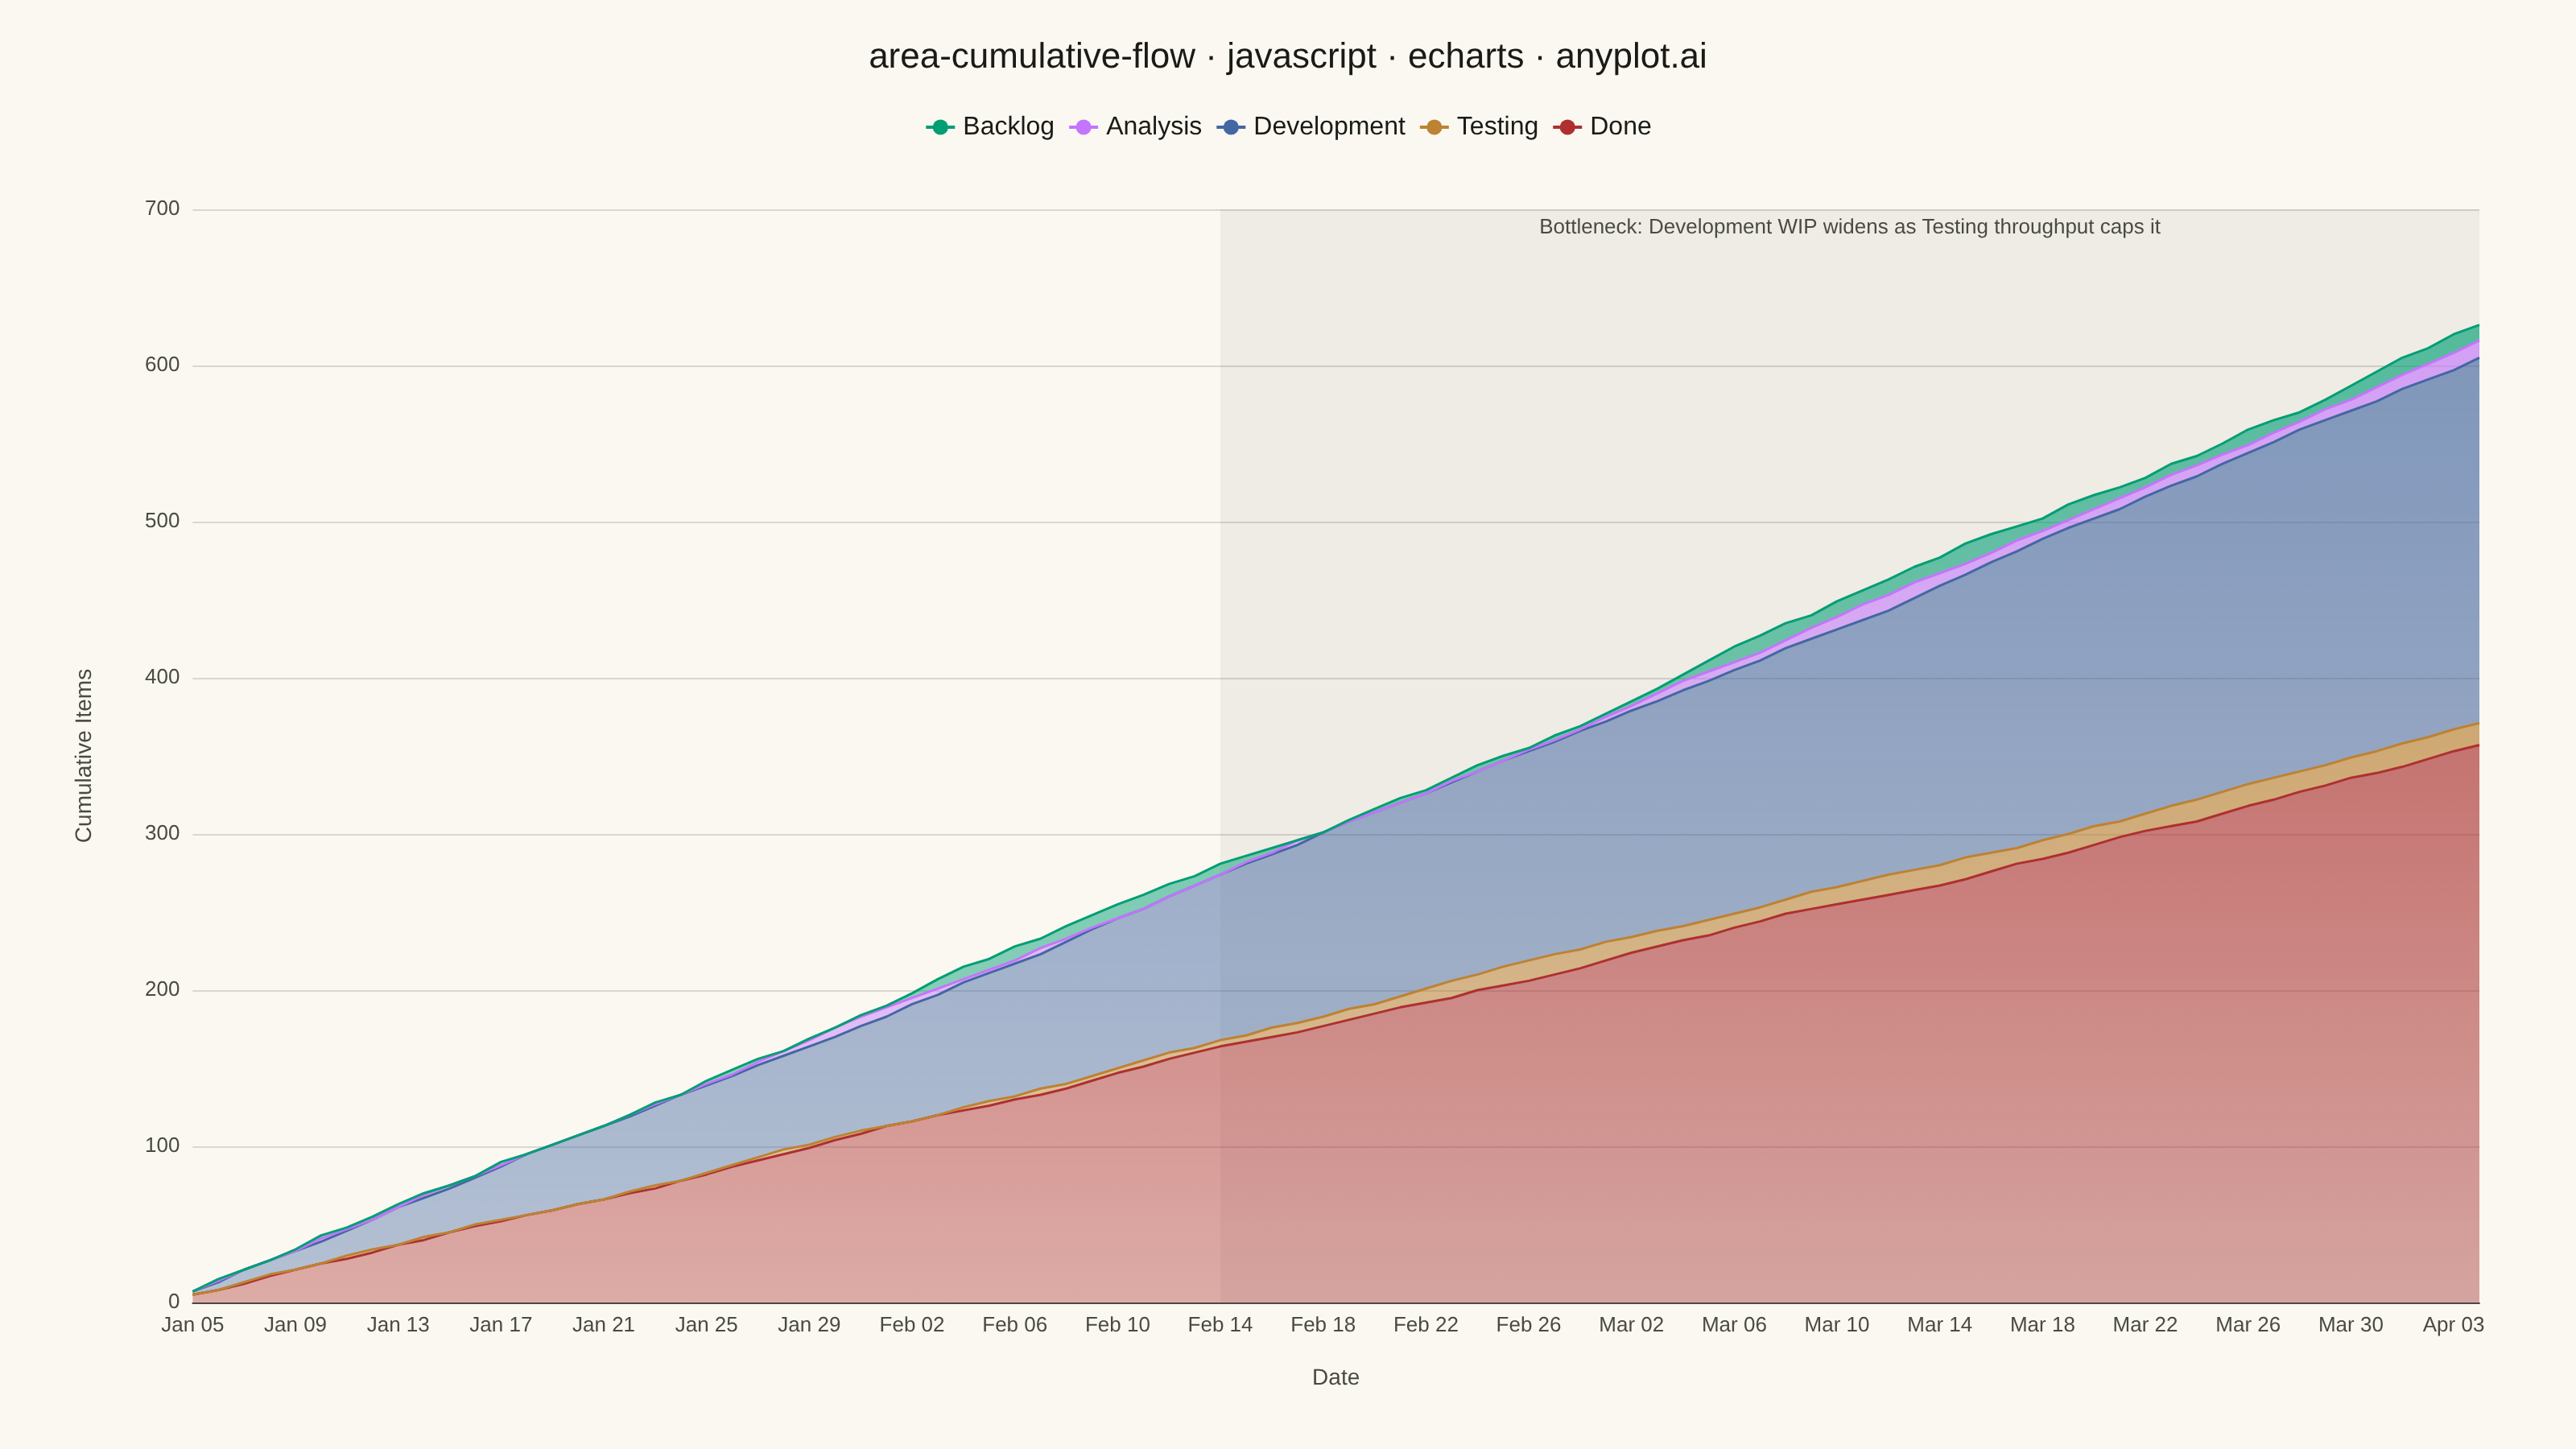
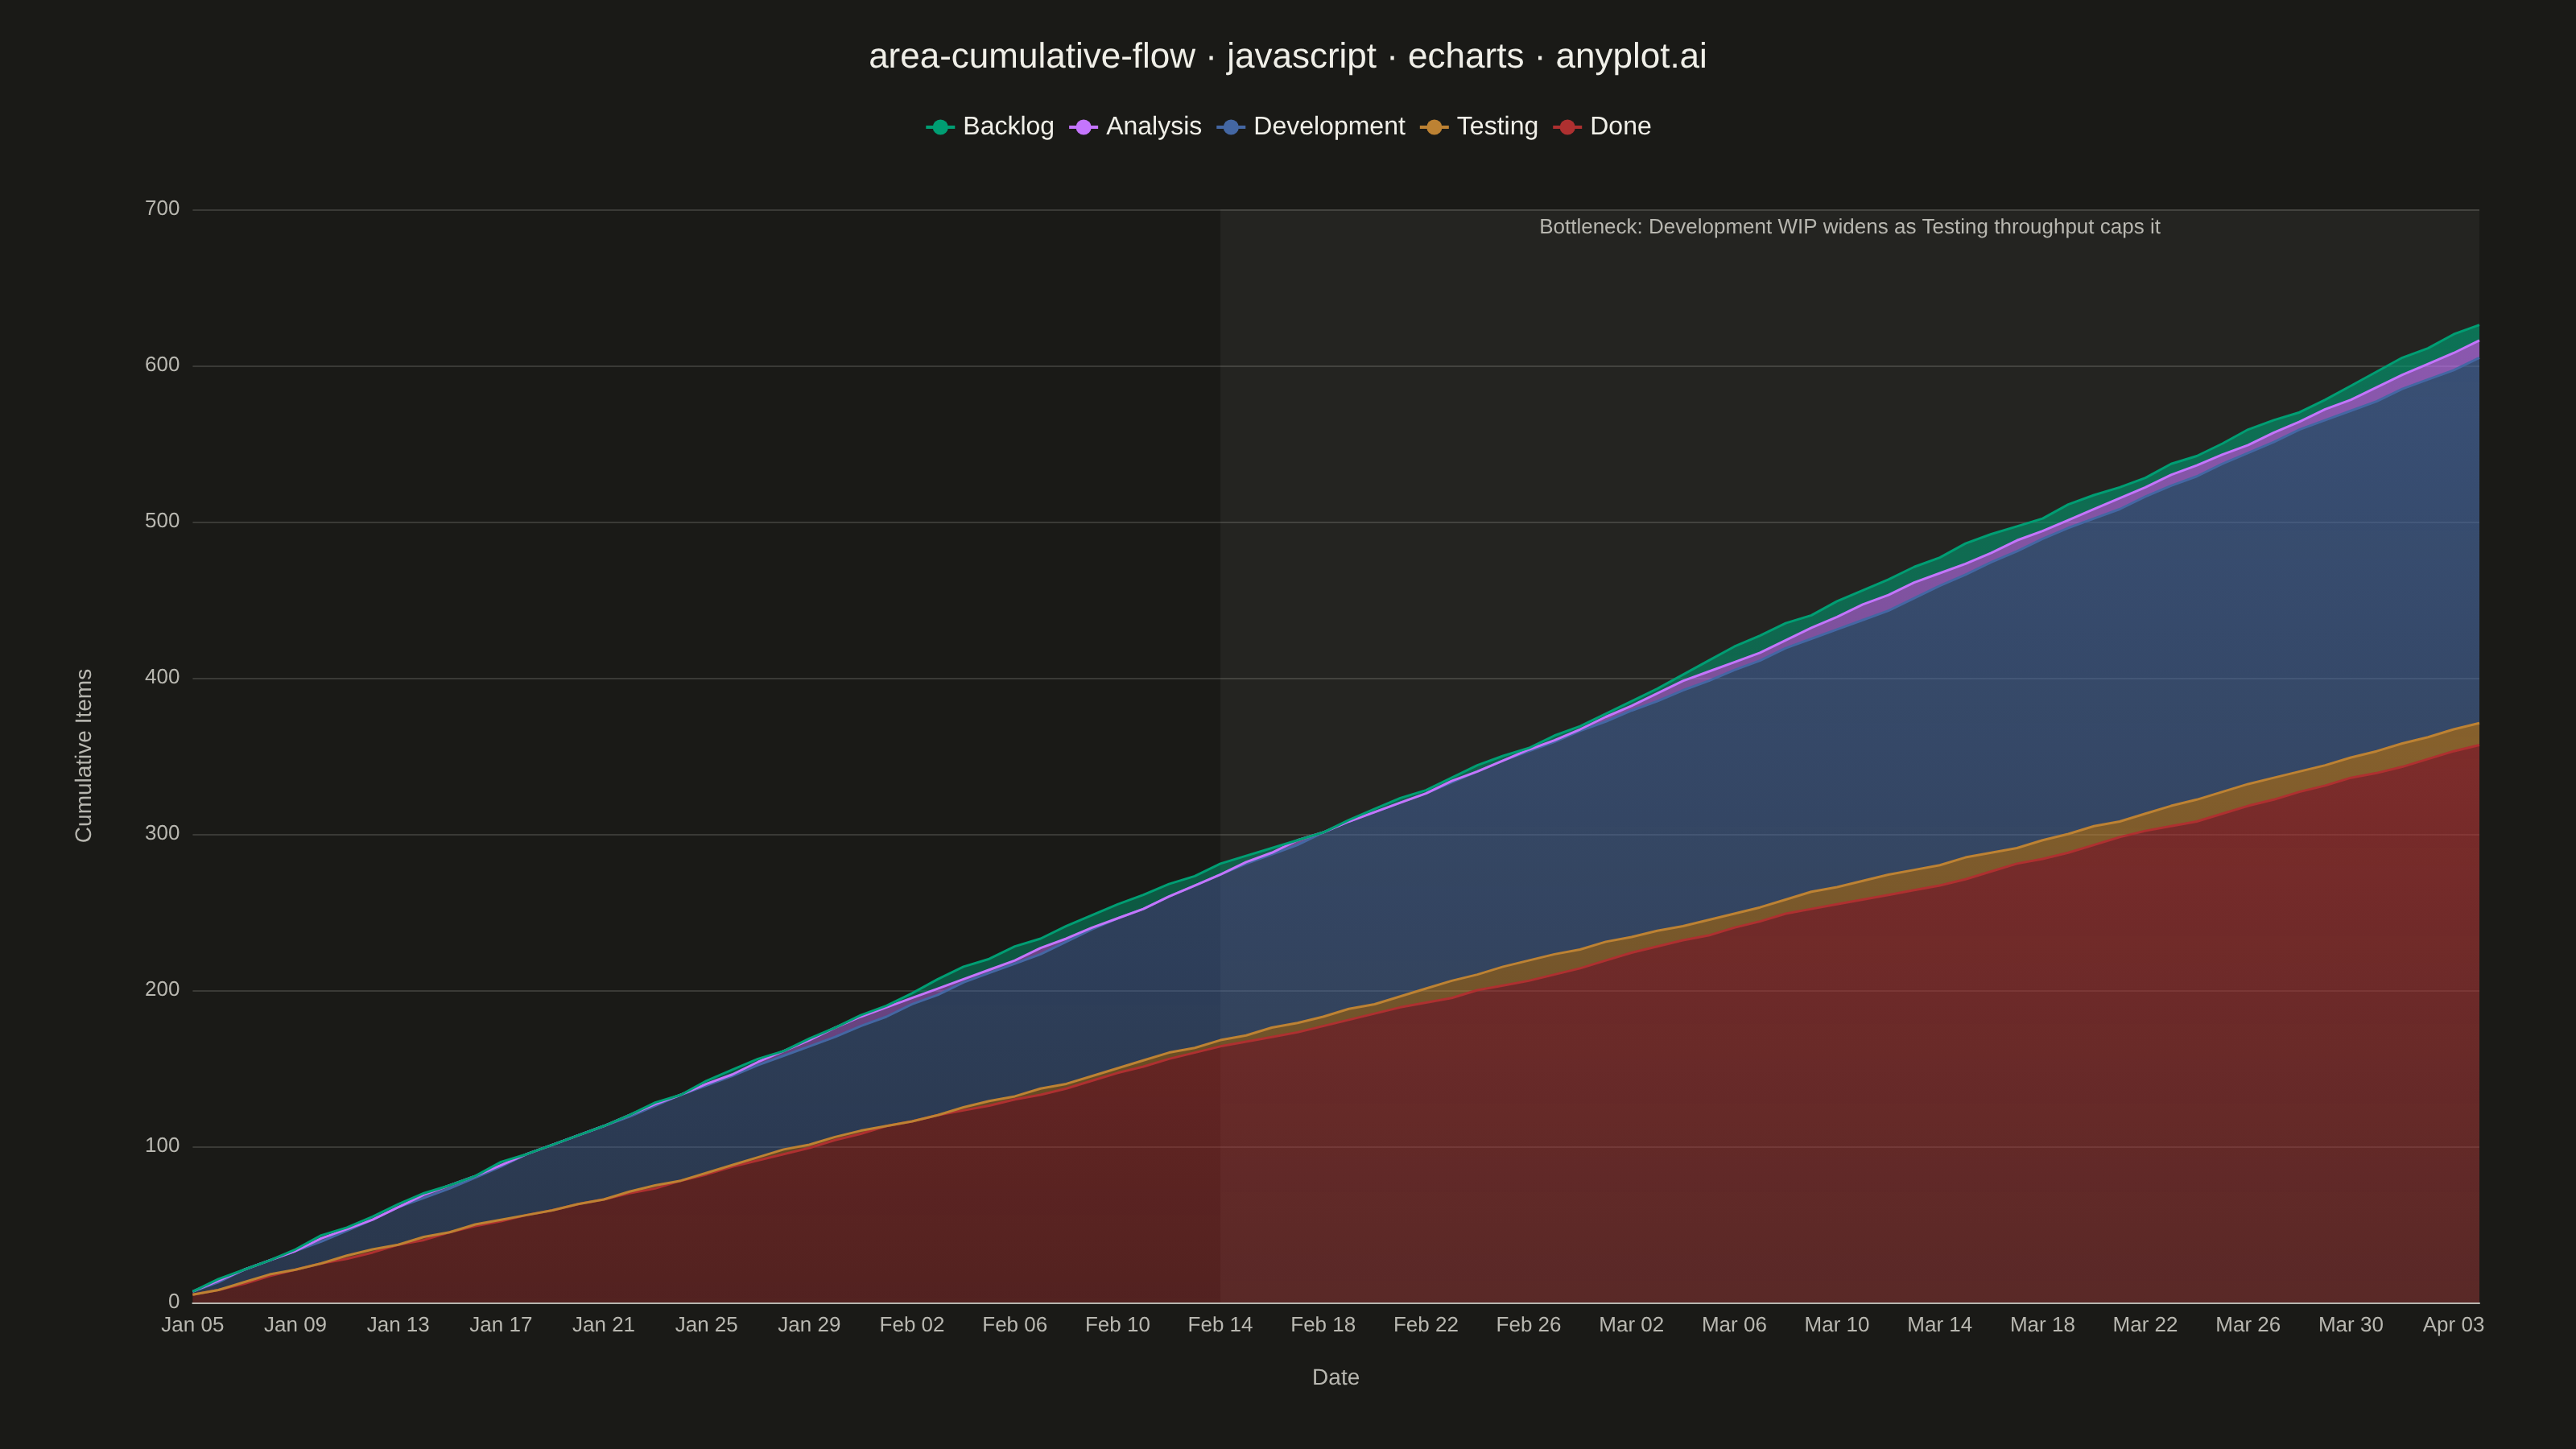
A cumulative flow diagram (CFD) displays the cumulative count of items in each workflow stage as stacked areas over time. Each band represents a stage (e.g., Backlog, In Progress, Done), and the vertical distance between two adjacent band boundaries shows the number of items currently in that stage (work-in-progress). This is a key visualization in Lean and Agile project management for identifying bottlenecks, monitoring throughput, and assessing flow efficiency across a delivery pipeline.
// anyplot.ai
// area-cumulative-flow: Cumulative Flow Diagram for Workflow Analytics
// Library: echarts 6.1.0 | JavaScript 22.23.2
// Quality: 94/100 | Created: 2026-08-18

const t = window.ANYPLOT_TOKENS;

// --- Data (in-memory, deterministic) ----------------------------------------
// Simple LCG so the sample data is reproducible without Math.random().
let seed = 42;
function rand() {
  seed = (seed * 1103515245 + 12345) & 0x7fffffff;
  return seed / 0x7fffffff;
}

const DAYS = 90;
const MONTHS = ["Jan", "Feb", "Mar", "Apr", "May", "Jun", "Jul", "Aug", "Sep", "Oct", "Nov", "Dec"];
const stageNames = ["Backlog", "Analysis", "Development", "Testing", "Done"];
// Daily throughput capacity limiting how many items can advance into each
// stage (Backlog has no upstream cap — it only receives new intake). Testing
// is deliberately the tightest gate, so a Development-stage queue builds up
// in front of it — the classic CFD bottleneck signature — while the other
// stages keep pace with their own upstream and stay comparatively narrow.
const capacity = [null, 7, 7, 4, 4];

const dates = [];
const cumulative = stageNames.map(() => []);
const startDate = new Date(Date.UTC(2026, 0, 5));

for (let d = 0; d < DAYS; d++) {
  const dt = new Date(startDate.getTime() + d * 86400000);
  dates.push(`${MONTHS[dt.getUTCMonth()]} ${String(dt.getUTCDate()).padStart(2, "0")}`);

  const intake = 5 + Math.floor(rand() * 5); // 5-9 new items entering Backlog
  cumulative[0].push(d === 0 ? intake : cumulative[0][d - 1] + intake);

  for (let s = 1; s < stageNames.length; s++) {
    const prevCount = d === 0 ? 0 : cumulative[s][d - 1];
    const advance = Math.max(capacity[s] + Math.floor(rand() * 3) - 1, 0);
    cumulative[s].push(Math.min(prevCount + advance, cumulative[s - 1][d]));
  }
}

// Band width (work-in-progress) per stage = its cumulative count minus the
// next stage's cumulative count — the quantity a CFD band actually encodes.
const wip = stageNames.map((name, i) =>
  cumulative[i].map((v, d) => v - (i + 1 < stageNames.length ? cumulative[i + 1][d] : 0))
);

const stageColor = {
  Backlog: t.palette[0],
  Analysis: t.palette[1],
  Development: t.palette[2],
  Testing: t.palette[3],
  Done: t.palette[4],
};

// Give each band a little depth: a vertical gradient fill (richer near the
// band's own boundary, softer toward the stack) instead of a flat opacity.
function hexToRgba(hex, alpha) {
  const n = parseInt(hex.slice(1), 16);
  return `rgba(${(n >> 16) & 255}, ${(n >> 8) & 255}, ${n & 255}, ${alpha})`;
}
function bandGradient(hex) {
  return new echarts.graphic.LinearGradient(0, 0, 0, 1, [
    { offset: 0, color: hexToRgba(hex, 0.92) },
    { offset: 1, color: hexToRgba(hex, 0.55) },
  ]);
}

// Development is the bottleneck stage: Testing's capacity is the tightest
// gate, so the Development band widens steadily as the run progresses.
// Highlight the back half of the run where that widening is unmistakable.
const bottleneckStartDay = Math.floor(DAYS * 0.45);

// --- Init --------------------------------------------------------------------
const chart = echarts.init(document.getElementById("container"));

// --- Option --------------------------------------------------------------------
// Stack bottom-to-top in series order: Done at the bottom (closest to the
// axis), Backlog on top — matching the spec's required stacking direction.
const stackOrder = ["Done", "Testing", "Development", "Analysis", "Backlog"];

chart.setOption({
  animation: false,
  backgroundColor: "transparent",
  title: {
    text: "area-cumulative-flow · javascript · echarts · anyplot.ai",
    left: "center",
    top: 20,
    textStyle: { color: t.ink, fontSize: 22, fontWeight: 500 },
  },
  tooltip: {
    trigger: "axis",
    axisPointer: { type: "cross" },
    valueFormatter: (value) => `${value} items`,
  },
  legend: {
    data: stageNames,
    top: 66,
    left: "center",
    textStyle: { color: t.ink, fontSize: 16 },
    itemWidth: 18,
    itemHeight: 12,
  },
  grid: {
    left: 90,
    right: 60,
    top: 130,
    bottom: 70,
    containLabel: true,
  },
  xAxis: {
    type: "category",
    data: dates,
    boundaryGap: false,
    name: "Date",
    nameLocation: "middle",
    nameGap: 40,
    nameTextStyle: { color: t.inkSoft, fontSize: 14 },
    axisLabel: { color: t.inkSoft, fontSize: 13 },
    axisLine: { lineStyle: { color: t.inkSoft } },
    axisTick: { show: false },
    splitLine: { show: false },
  },
  yAxis: {
    type: "value",
    name: "Cumulative Items",
    nameLocation: "middle",
    nameGap: 60,
    nameTextStyle: { color: t.inkSoft, fontSize: 14 },
    axisLabel: { color: t.inkSoft, fontSize: 13 },
    axisLine: { show: false },
    axisTick: { show: false },
    splitLine: { lineStyle: { color: t.grid } },
  },
  series: stackOrder.map((name) => ({
    name,
    type: "line",
    stack: "flow",
    data: wip[stageNames.indexOf(name)],
    symbol: "none",
    lineStyle: { width: 1.5, color: stageColor[name] },
    areaStyle: { color: bandGradient(stageColor[name]) },
    itemStyle: { color: stageColor[name] },
    emphasis: { focus: "series" },
    // Call out the widening Development band — the CFD's bottleneck signature
    // — with a labeled shaded window instead of leaving it only implicit in
    // the data.
    ...(name === "Development"
      ? {
          markArea: {
            silent: true,
            itemStyle: { color: t.ink, opacity: 0.05 },
            label: {
              show: true,
              position: "insideTop",
              color: t.inkSoft,
              fontSize: 13,
              formatter: "Bottleneck: Development WIP widens as Testing throughput caps it",
            },
            data: [[{ xAxis: dates[bottleneckStartDay] }, { xAxis: dates[dates.length - 1] }]],
          },
        }
      : {}),
  })),
});
Runnable source as JSON, for any HTTP client: https://api.anyplot.ai/specs/area-cumulative-flow/echarts/code. Any spec id and library id listed in llms-full.txt fit the same URL shape; every URL below is complete and callable.
{
  "spec_id": "area-cumulative-flow",
  "language": "javascript",
  "library": "echarts",
  "page": "https://anyplot.ai/area-cumulative-flow/javascript/echarts",
  "hub": "https://anyplot.ai/area-cumulative-flow",
  "code_json": "https://api.anyplot.ai/specs/area-cumulative-flow/echarts/code",
  "spec_json": "https://api.anyplot.ai/specs/area-cumulative-flow",
  "render_light_png": "https://storage.googleapis.com/anyplot-images/plots/area-cumulative-flow/javascript/echarts/plot-light.png",
  "render_dark_png": "https://storage.googleapis.com/anyplot-images/plots/area-cumulative-flow/javascript/echarts/plot-dark.png",
  "interactive_light_html": "https://storage.googleapis.com/anyplot-images/plots/area-cumulative-flow/javascript/echarts/plot-light.html",
  "interactive_dark_html": "https://storage.googleapis.com/anyplot-images/plots/area-cumulative-flow/javascript/echarts/plot-dark.html",
  "quality_score": 94.0,
  "license": "MIT",
  "guide": "https://anyplot.ai/llms.txt"
}
Part of Cumulative Flow Diagram for Workflow Analytics on anyplot.ai.