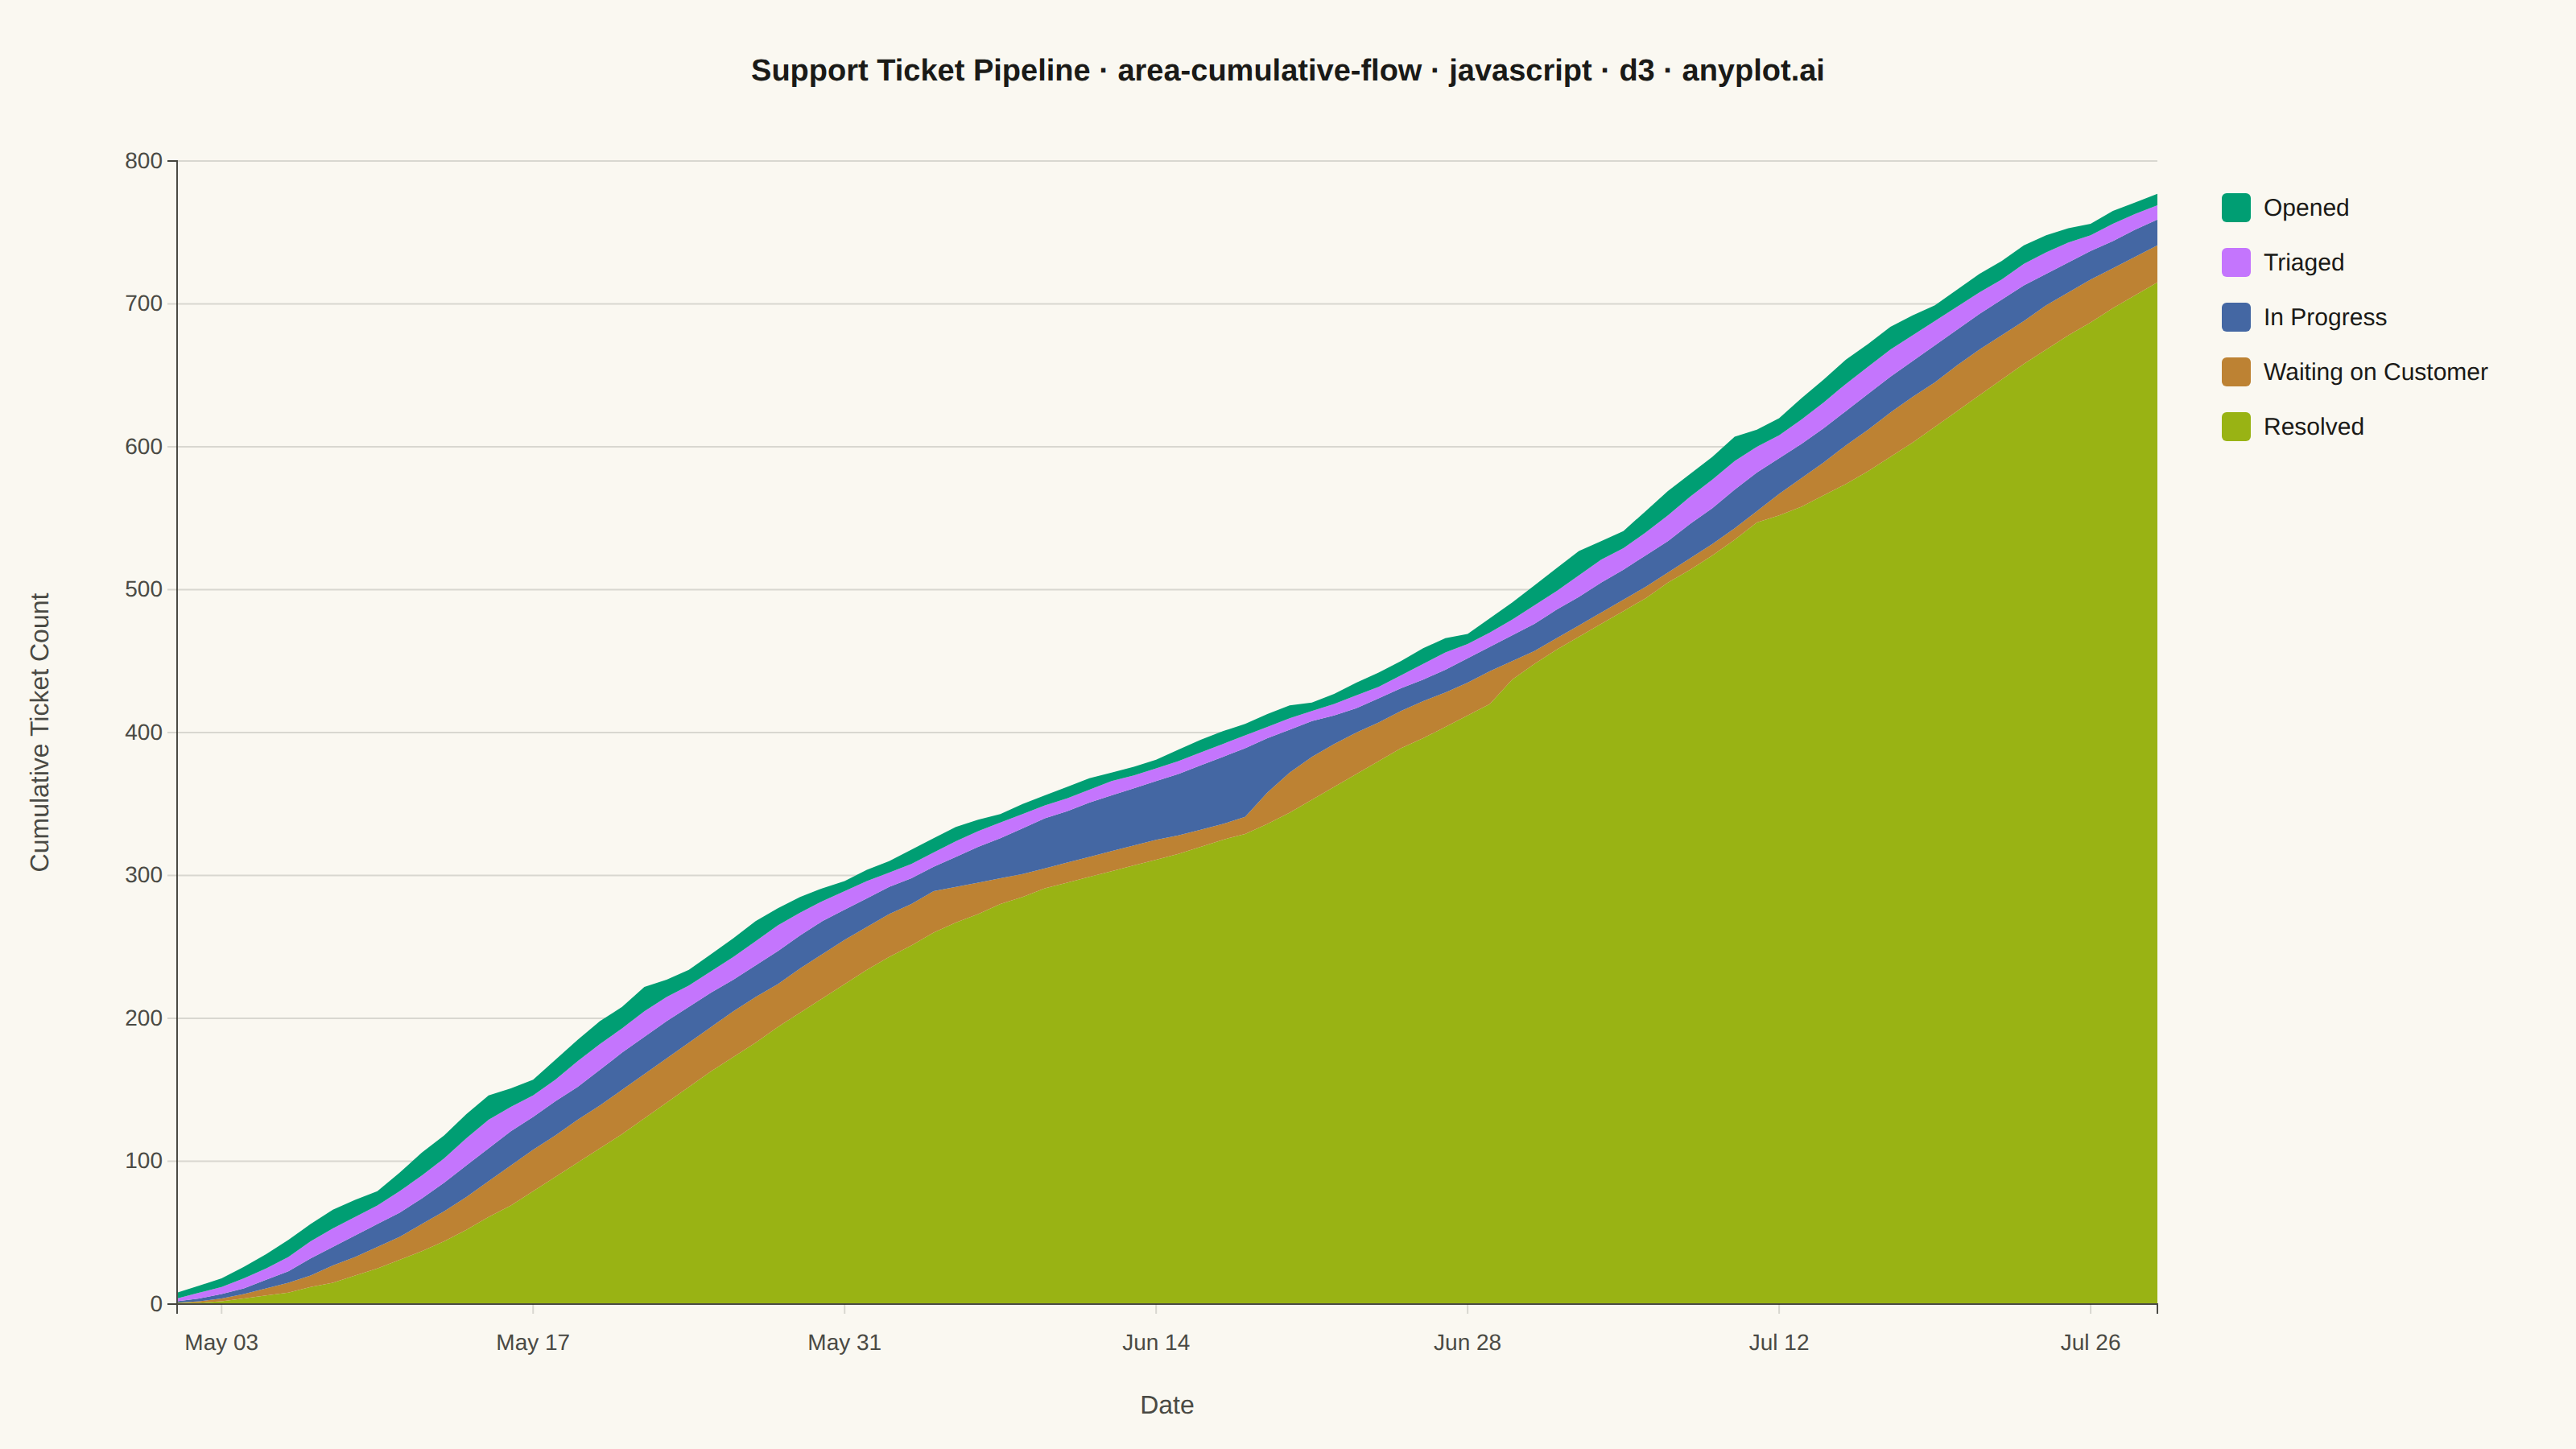
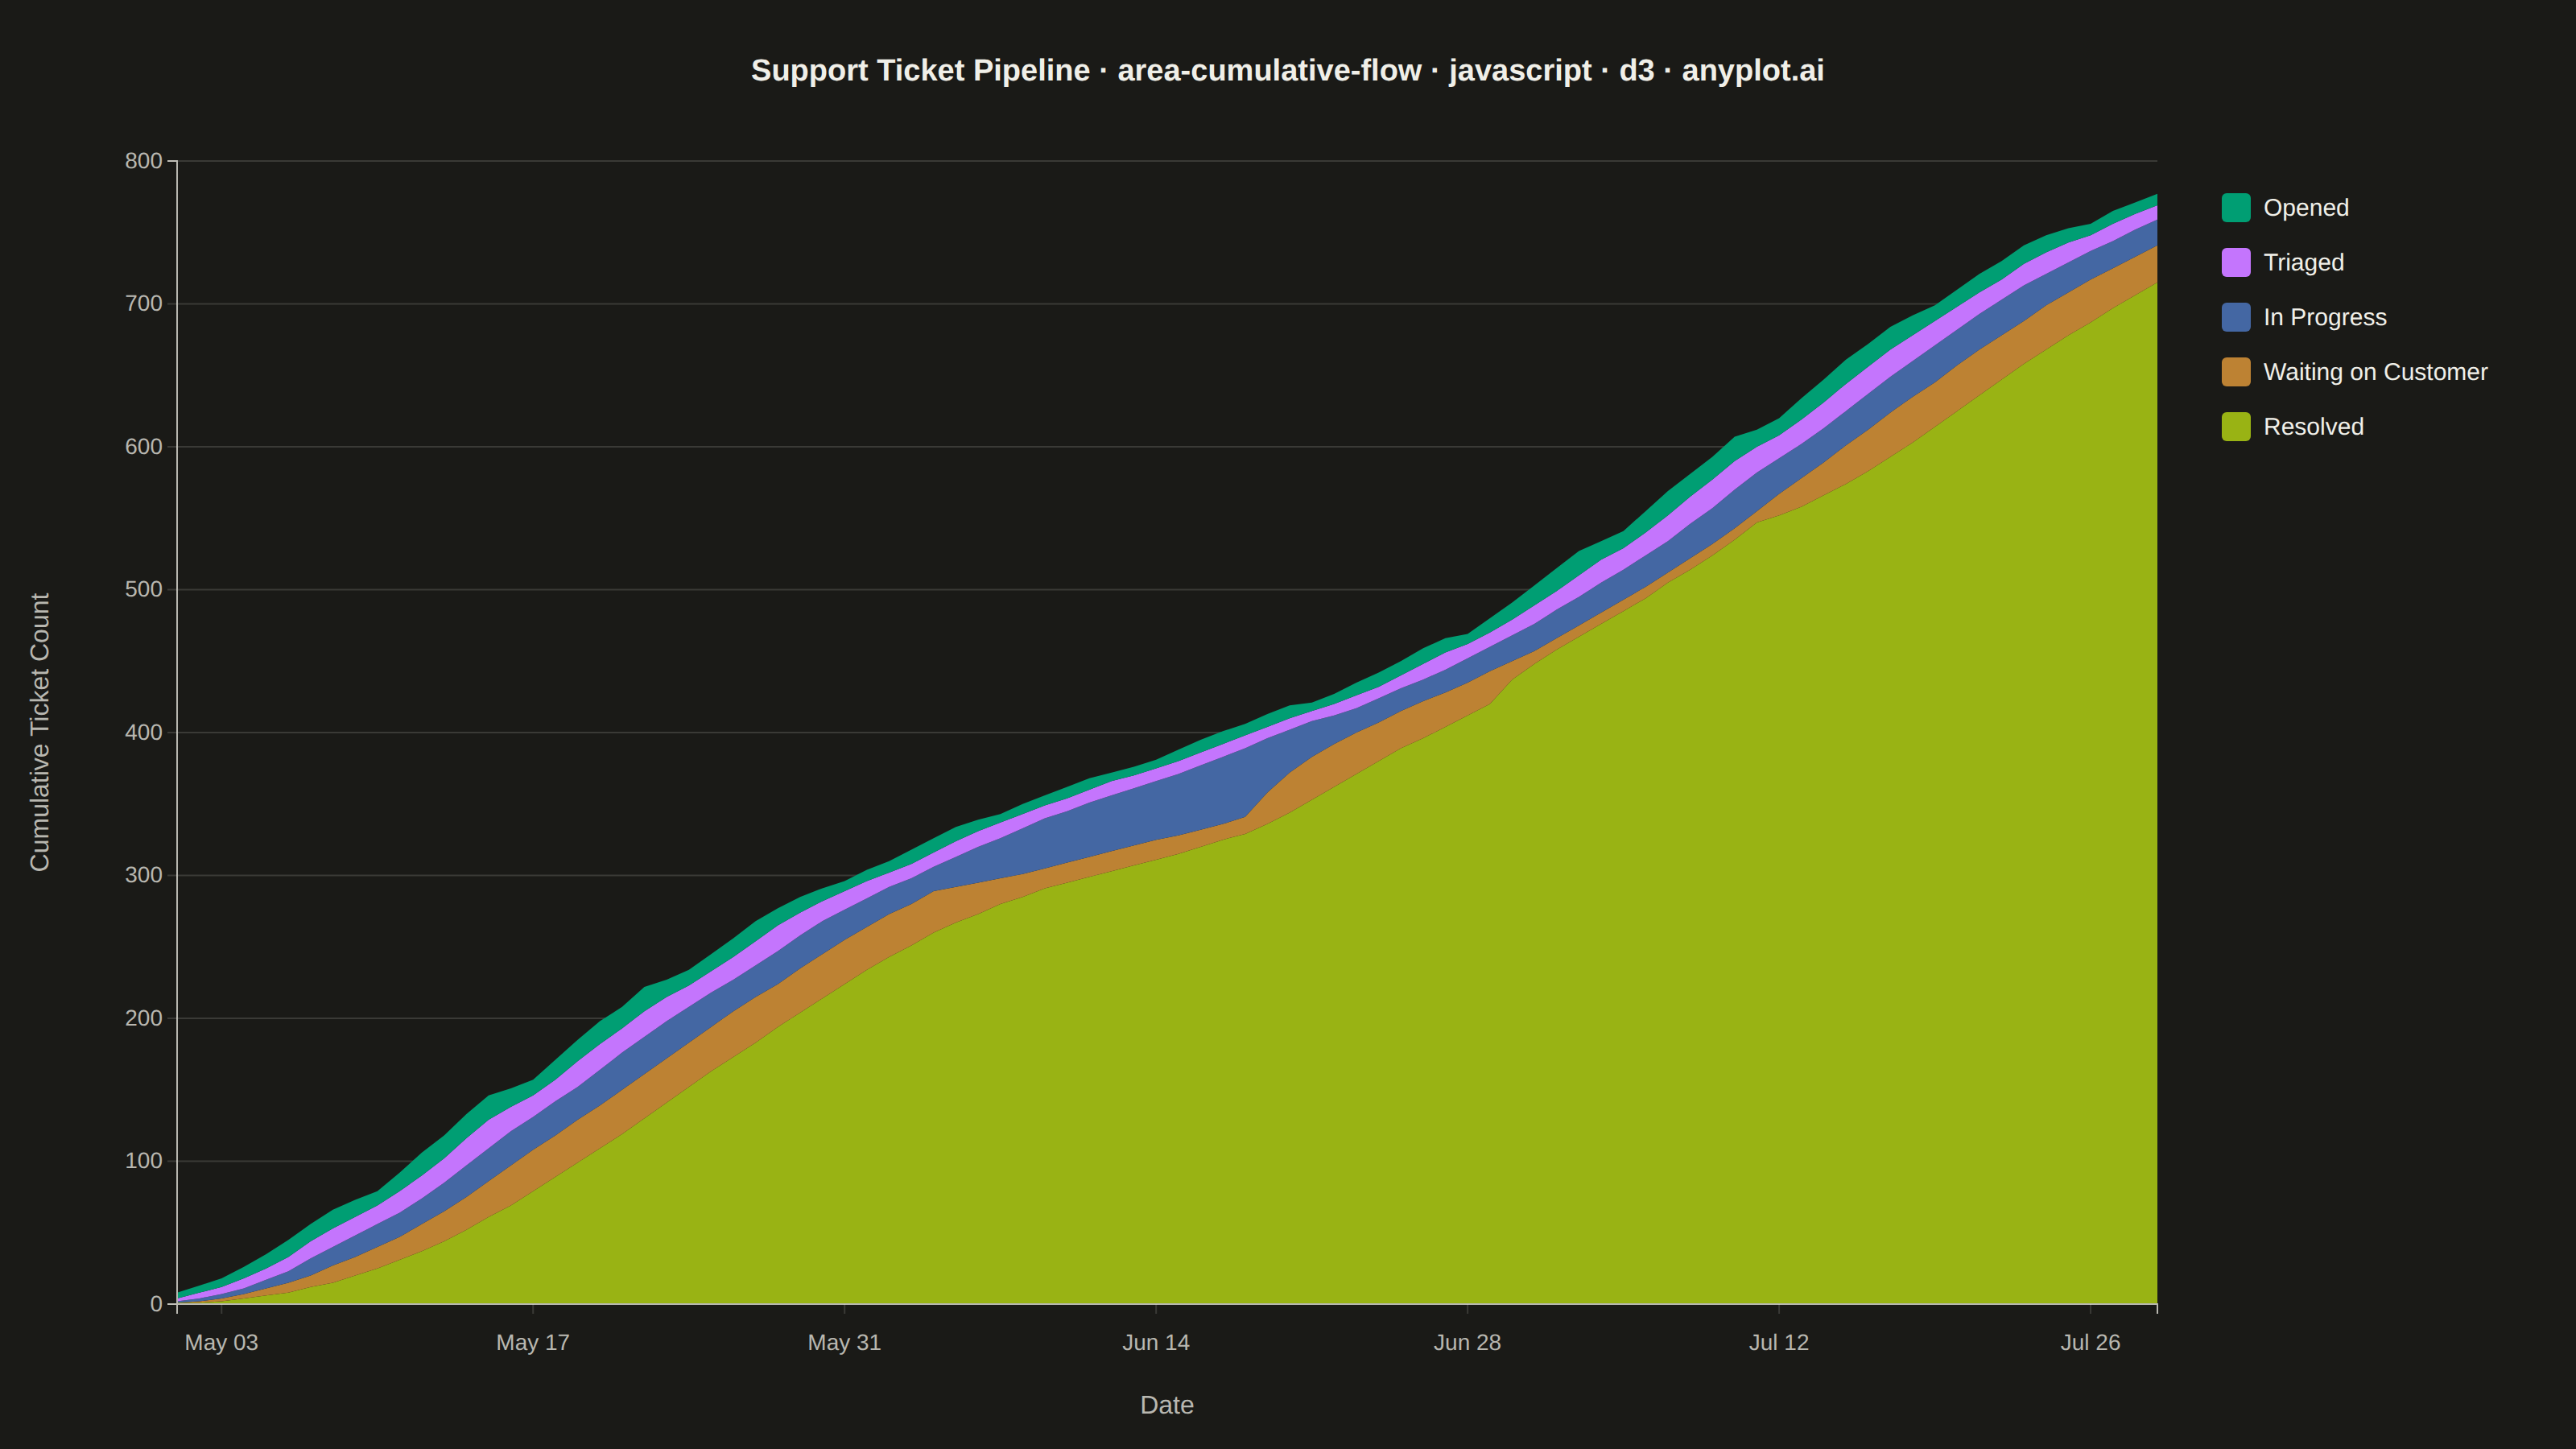
The same plot in 14 other libraries — JavaScript: Chart.js, Apache ECharts, Highcharts, MUI X Charts; Python: Altair, Bokeh, lets-plot, Matplotlib, Plotly, plotnine, Pygal, Seaborn; R: ggplot2; Julia: Makie.jl. Compare all 15 side by side: Cumulative Flow Diagram for Workflow Analytics in Python, R, Julia and JavaScript.
A cumulative flow diagram (CFD) displays the cumulative count of items in each workflow stage as stacked areas over time. Each band represents a stage (e.g., Backlog, In Progress, Done), and the vertical distance between two adjacent band boundaries shows the number of items currently in that stage (work-in-progress). This is a key visualization in Lean and Agile project management for identifying bottlenecks, monitoring throughput, and assessing flow efficiency across a delivery pipeline.
// anyplot.ai
// area-cumulative-flow: Cumulative Flow Diagram for Workflow Analytics
// Library: d3 7.9.0 | JavaScript 22.23.2
// Quality: 89/100 | Created: 2026-08-18

const t = window.ANYPLOT_TOKENS;
const { width, height } = window.ANYPLOT_SIZE;
const margin = { top: 100, right: 260, bottom: 90, left: 110 };
const iw = width - margin.left - margin.right;
const ih = height - margin.top - margin.bottom;

// --- Data (in-memory, deterministic) ----------------------------------------
// Support-ticket lifecycle over a 90-day window. Each stage's value is the
// CUMULATIVE count of tickets that have entered or passed through that stage
// by the given day — earliest stage (Opened) is always >= every later stage.
let seed = 20260818;
function lcg() {
  seed = (seed * 1664525 + 1013904223) % 4294967296;
  return seed / 4294967296;
}

const stages = ["Opened", "Triaged", "In Progress", "Waiting on Customer", "Resolved"];
const advanceRate = [0.42, 0.38, 0.3, 0.24]; // fraction of the gap to the prior stage that advances per day
const days = 90;
const startDate = new Date(2026, 4, 1);

const dates = Array.from({ length: days }, (_, i) => {
  const d = new Date(startDate);
  d.setDate(d.getDate() + i);
  return d;
});

// Deliberate bottleneck: the In-Progress -> Waiting-on-Customer transition
// slows sharply for two weeks (reviewers overloaded), so the "In Progress"
// band visibly widens. Deliberate drain: the Waiting-on-Customer -> Resolved
// transition speeds up afterward (a backlog-clearing push), so the "Waiting
// on Customer" band visibly narrows. This demonstrates the CFD's signature
// bottleneck-spotting use case called out in the spec.
function effectiveRate(idx, day) {
  if (idx === 2 && day >= 35 && day < 49) return advanceRate[idx] * 0.28;
  if (idx === 3 && day >= 60 && day < 72) return Math.min(0.85, advanceRate[idx] * 2.3);
  return advanceRate[idx];
}

// Daily new-ticket arrivals: a base rate with a weekly dip (weekends) plus noise.
const cumulative = stages.map(() => new Array(days).fill(0));
for (let i = 0; i < days; i += 1) {
  const dow = dates[i].getDay();
  const weekendDamp = dow === 0 || dow === 6 ? 0.4 : 1;
  const arrivals = Math.round((7 + 4 * Math.sin(i / 9)) * weekendDamp + lcg() * 4);
  cumulative[0][i] = (i === 0 ? 0 : cumulative[0][i - 1]) + Math.max(0, arrivals);

  for (let s = 1; s < stages.length; s += 1) {
    const prevDayOwn = i === 0 ? 0 : cumulative[s][i - 1];
    const gap = cumulative[s - 1][i] - prevDayOwn;
    const advance = Math.floor(gap * effectiveRate(s - 1, i) + lcg() * 1.5);
    cumulative[s][i] = prevDayOwn + Math.max(0, Math.min(gap, advance));
  }
}

// --- Colors --------------------------------------------------------------------
// Canonical ordinal assignment (positions 1-4) for the four in-flight stages,
// but "Resolved" — the dominant, positive-outcome stage — is reassigned away
// from position 5 (matte red, the reserved bad/error semantic anchor) to lime
// (position 8), so a wall of the dominant color doesn't read as "a pile of
// problems".
const colorIndex = { Opened: 0, Triaged: 1, "In Progress": 2, "Waiting on Customer": 3, Resolved: 7 };
const color = d3.scaleOrdinal().domain(stages).range(stages.map((s) => t.palette[colorIndex[s]]));

// --- Stack (per-stage WIP, stacked bottom-to-top in reverse workflow order) ----
// Each stage's plotted band value is its work-in-progress (WIP) — the count
// currently sitting in that stage — not its raw cumulative count. WIP for an
// in-flight stage is the gap between its cumulative count and the next
// stage's; the terminal stage's WIP is its full cumulative count (tickets
// that have finished and stay in the "Resolved" pool).
const stackData = dates.map((date, i) => ({
  date,
  Opened: cumulative[0][i] - cumulative[1][i],
  Triaged: cumulative[1][i] - cumulative[2][i],
  "In Progress": cumulative[2][i] - cumulative[3][i],
  "Waiting on Customer": cumulative[3][i] - cumulative[4][i],
  Resolved: cumulative[4][i],
}));

// Stage order top-to-bottom per spec: Opened (earliest) on top, Resolved
// (latest) on bottom. d3.stack() lays keys bottom-first, so pass the reverse.
const stackKeys = [...stages].reverse();
const series = d3.stack().keys(stackKeys)(stackData);

// --- SVG mount ---------------------------------------------------------------
const svg = d3.select("#container").append("svg").attr("width", width).attr("height", height);
const g = svg.append("g").attr("transform", `translate(${margin.left},${margin.top})`);

// --- Scales --------------------------------------------------------------------
const x = d3.scaleTime().domain(d3.extent(dates)).range([0, iw]);
const y = d3
  .scaleLinear()
  .domain([0, d3.max(cumulative[0])])
  .nice()
  .range([ih, 0]);

// --- Gridlines -----------------------------------------------------------------
g.append("g")
  .attr("class", "grid")
  .call(d3.axisLeft(y).tickSize(-iw).tickFormat(""))
  .call((sel) => sel.select(".domain").remove())
  .selectAll("line")
  .attr("stroke", t.grid);

// --- Bands ---------------------------------------------------------------------
const area = d3
  .area()
  .x((d, i) => x(dates[i]))
  .y0((d) => y(d[0]))
  .y1((d) => y(d[1]));

g.selectAll("path.band")
  .data(series)
  .join("path")
  .attr("class", "band")
  .attr("fill", (d) => color(d.key))
  .attr("d", (d) => area(d));

// --- Axes ------------------------------------------------------------------
const xAxis = g
  .append("g")
  .attr("transform", `translate(0,${ih})`)
  .call(d3.axisBottom(x).ticks(d3.timeWeek.every(2)).tickFormat(d3.timeFormat("%b %d")));
const yAxis = g.append("g").call(d3.axisLeft(y).ticks(6));

for (const ax of [xAxis, yAxis]) {
  ax.selectAll("text").attr("fill", t.inkSoft).style("font-size", "14px");
  ax.selectAll("line").attr("stroke", t.grid);
  ax.select(".domain").attr("stroke", t.inkSoft);
}
xAxis.selectAll("text").attr("dy", "1.4em");

// --- Axis labels -------------------------------------------------------------
g.append("text")
  .attr("x", iw / 2)
  .attr("y", ih + 68)
  .attr("text-anchor", "middle")
  .attr("fill", t.inkSoft)
  .style("font-size", "16px")
  .text("Date");

g.append("text")
  .attr("transform", "rotate(-90)")
  .attr("x", -ih / 2)
  .attr("y", -80)
  .attr("text-anchor", "middle")
  .attr("fill", t.inkSoft)
  .style("font-size", "16px")
  .text("Cumulative Ticket Count");

// --- Legend (workflow order, top stage first) ---------------------------------
const legend = svg
  .append("g")
  .attr("transform", `translate(${margin.left + iw + 40}, ${margin.top + 20})`);

const legendRows = legend
  .selectAll("g")
  .data(stages)
  .join("g")
  .attr("transform", (_, i) => `translate(0, ${i * 34})`);

legendRows
  .append("rect")
  .attr("width", 18)
  .attr("height", 18)
  .attr("rx", 3)
  .attr("fill", (d) => color(d));

legendRows
  .append("text")
  .attr("x", 26)
  .attr("y", 14)
  .attr("fill", t.ink)
  .style("font-size", "15px")
  .text((d) => d);

// --- Title ---------------------------------------------------------------------
const title = "Support Ticket Pipeline · area-cumulative-flow · javascript · d3 · anyplot.ai";
const titleFontSize = Math.max(16, Math.round(22 * Math.min(1, 67 / title.length)));
svg
  .append("text")
  .attr("x", width / 2)
  .attr("y", 50)
  .attr("text-anchor", "middle")
  .attr("fill", t.ink)
  .style("font-size", `${titleFontSize}px`)
  .style("font-weight", "600")
  .text(title);
Runnable source as JSON, for any HTTP client: https://api.anyplot.ai/specs/area-cumulative-flow/d3/code. Any spec id and library id listed in llms-full.txt fit the same URL shape; every URL below is complete and callable.
{
  "spec_id": "area-cumulative-flow",
  "language": "javascript",
  "library": "d3",
  "page": "https://anyplot.ai/area-cumulative-flow/javascript/d3",
  "hub": "https://anyplot.ai/area-cumulative-flow",
  "code_json": "https://api.anyplot.ai/specs/area-cumulative-flow/d3/code",
  "spec_json": "https://api.anyplot.ai/specs/area-cumulative-flow",
  "render_light_png": "https://storage.googleapis.com/anyplot-images/plots/area-cumulative-flow/javascript/d3/plot-light.png",
  "render_dark_png": "https://storage.googleapis.com/anyplot-images/plots/area-cumulative-flow/javascript/d3/plot-dark.png",
  "interactive_light_html": "https://storage.googleapis.com/anyplot-images/plots/area-cumulative-flow/javascript/d3/plot-light.html",
  "interactive_dark_html": "https://storage.googleapis.com/anyplot-images/plots/area-cumulative-flow/javascript/d3/plot-dark.html",
  "quality_score": 89.0,
  "license": "MIT",
  "guide": "https://anyplot.ai/llms.txt"
}
Part of Cumulative Flow Diagram for Workflow Analytics on anyplot.ai.