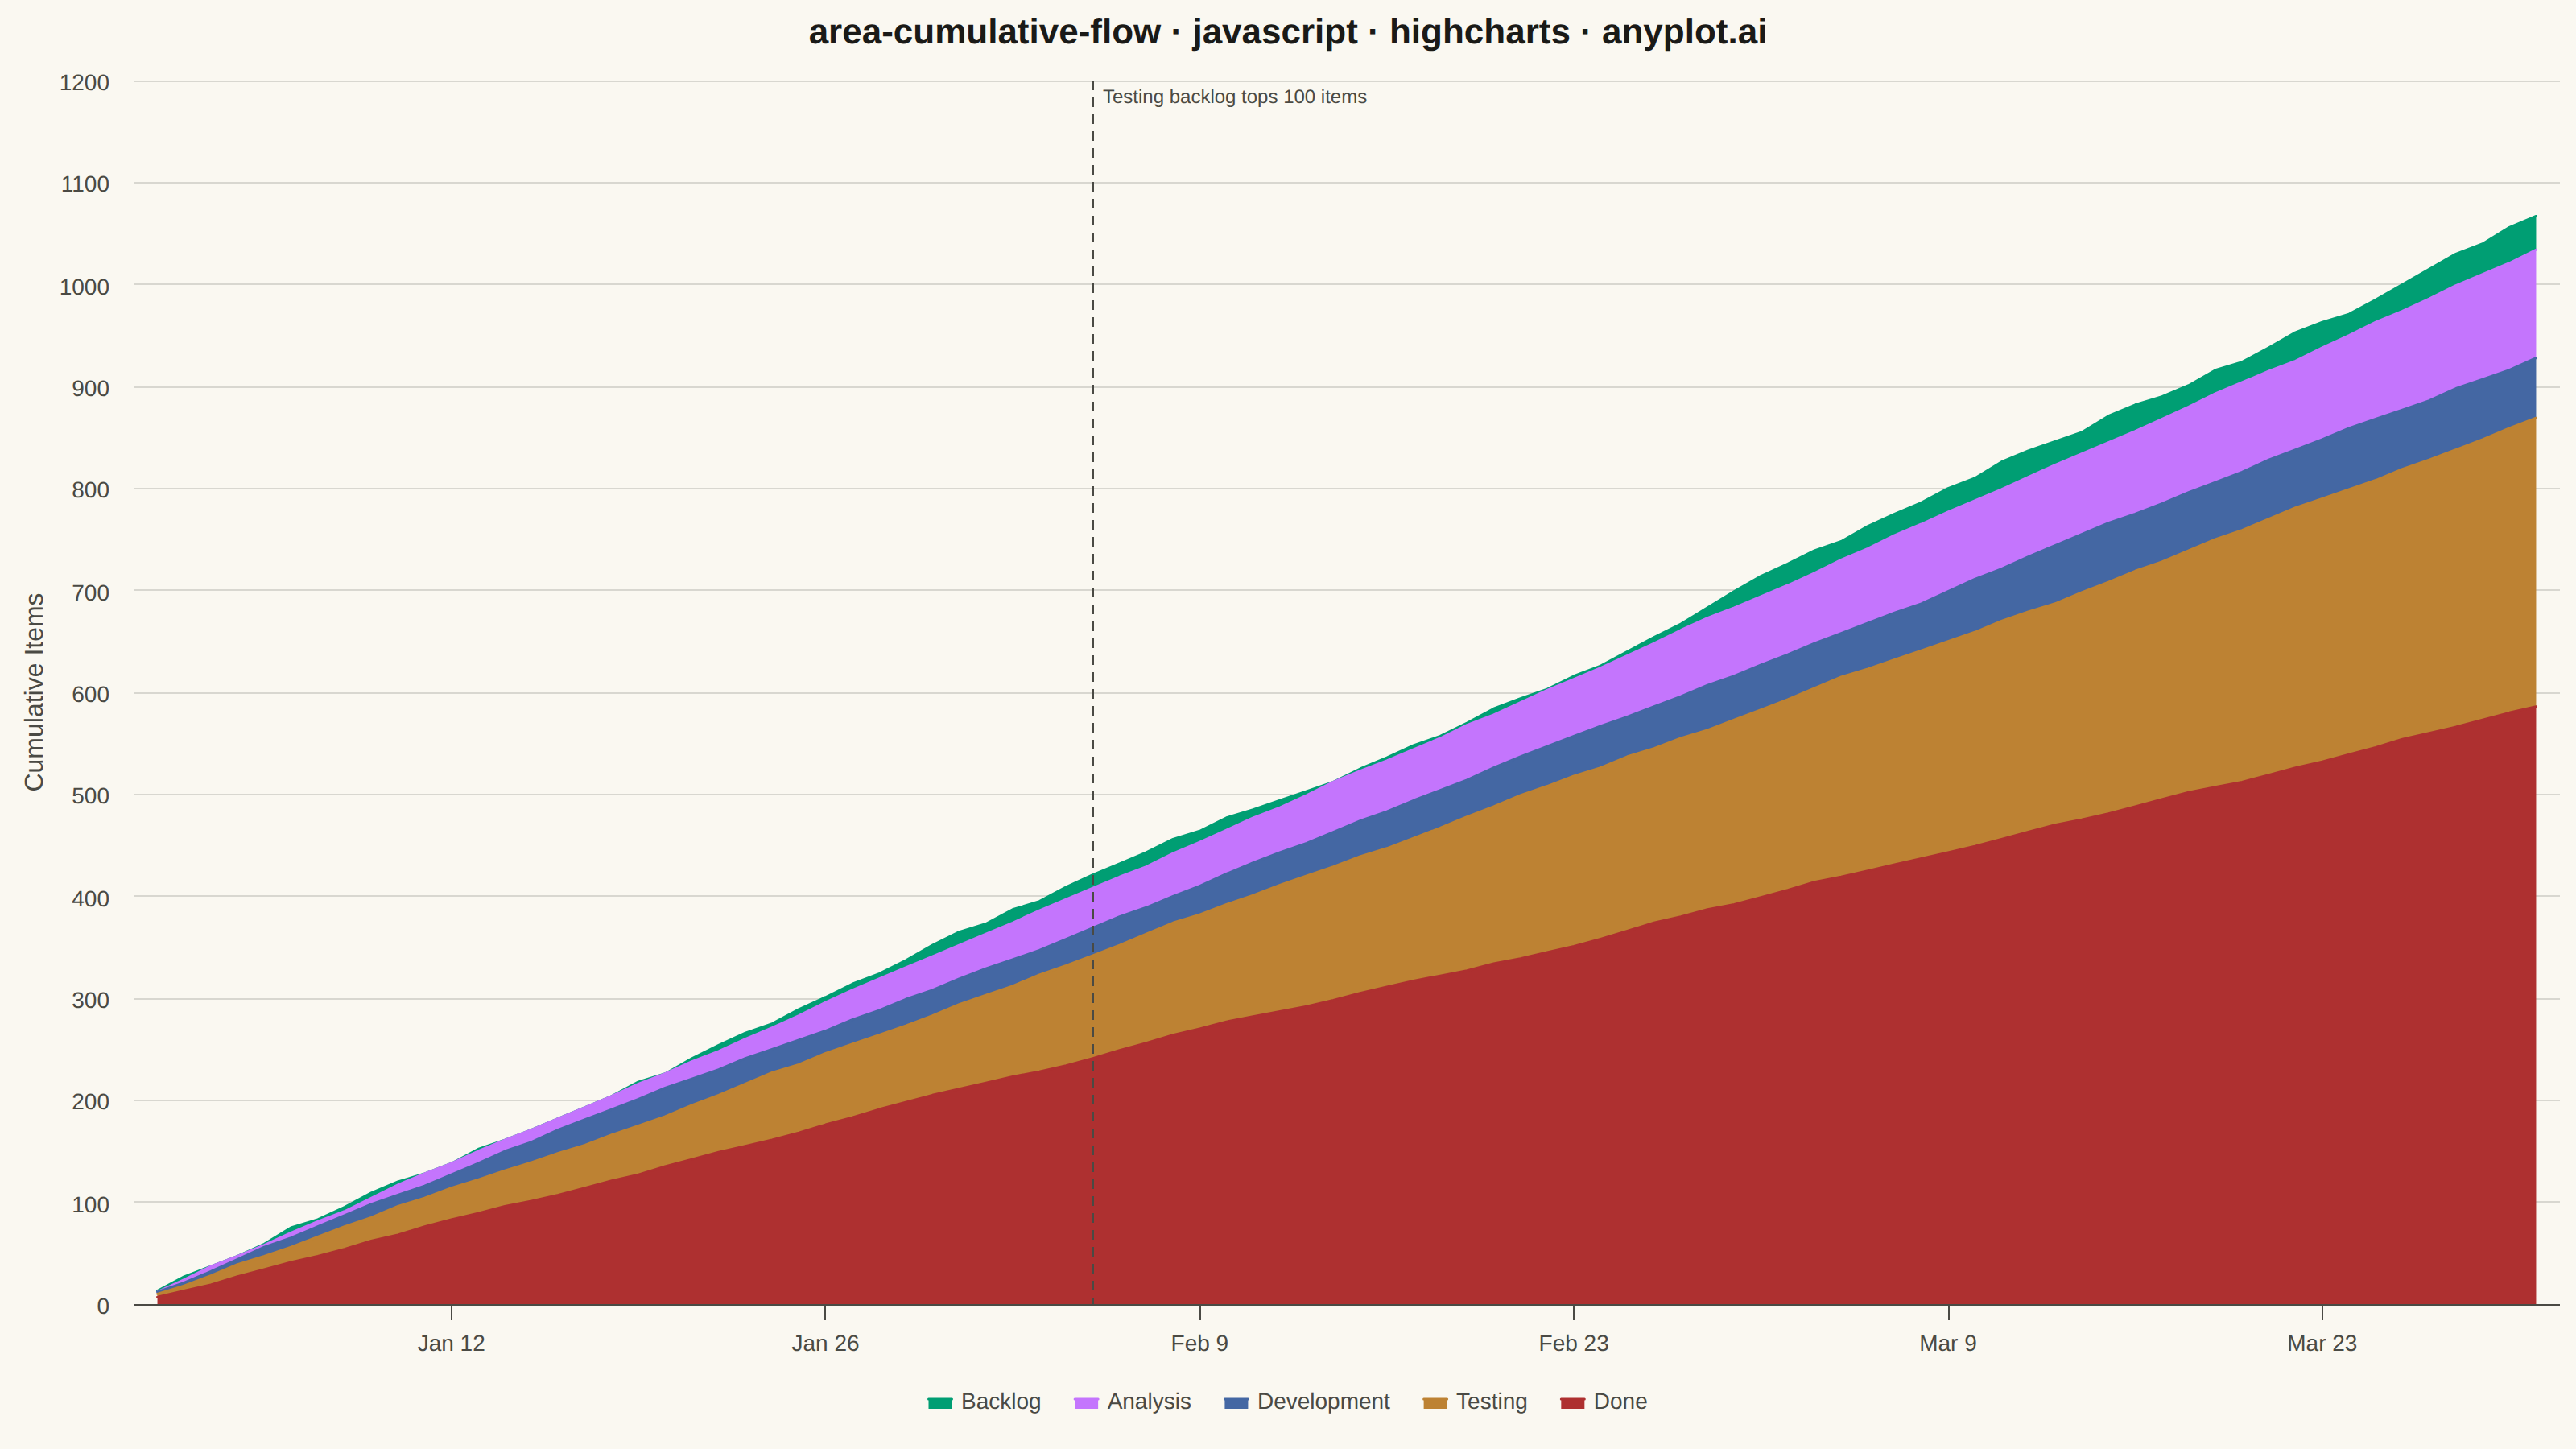
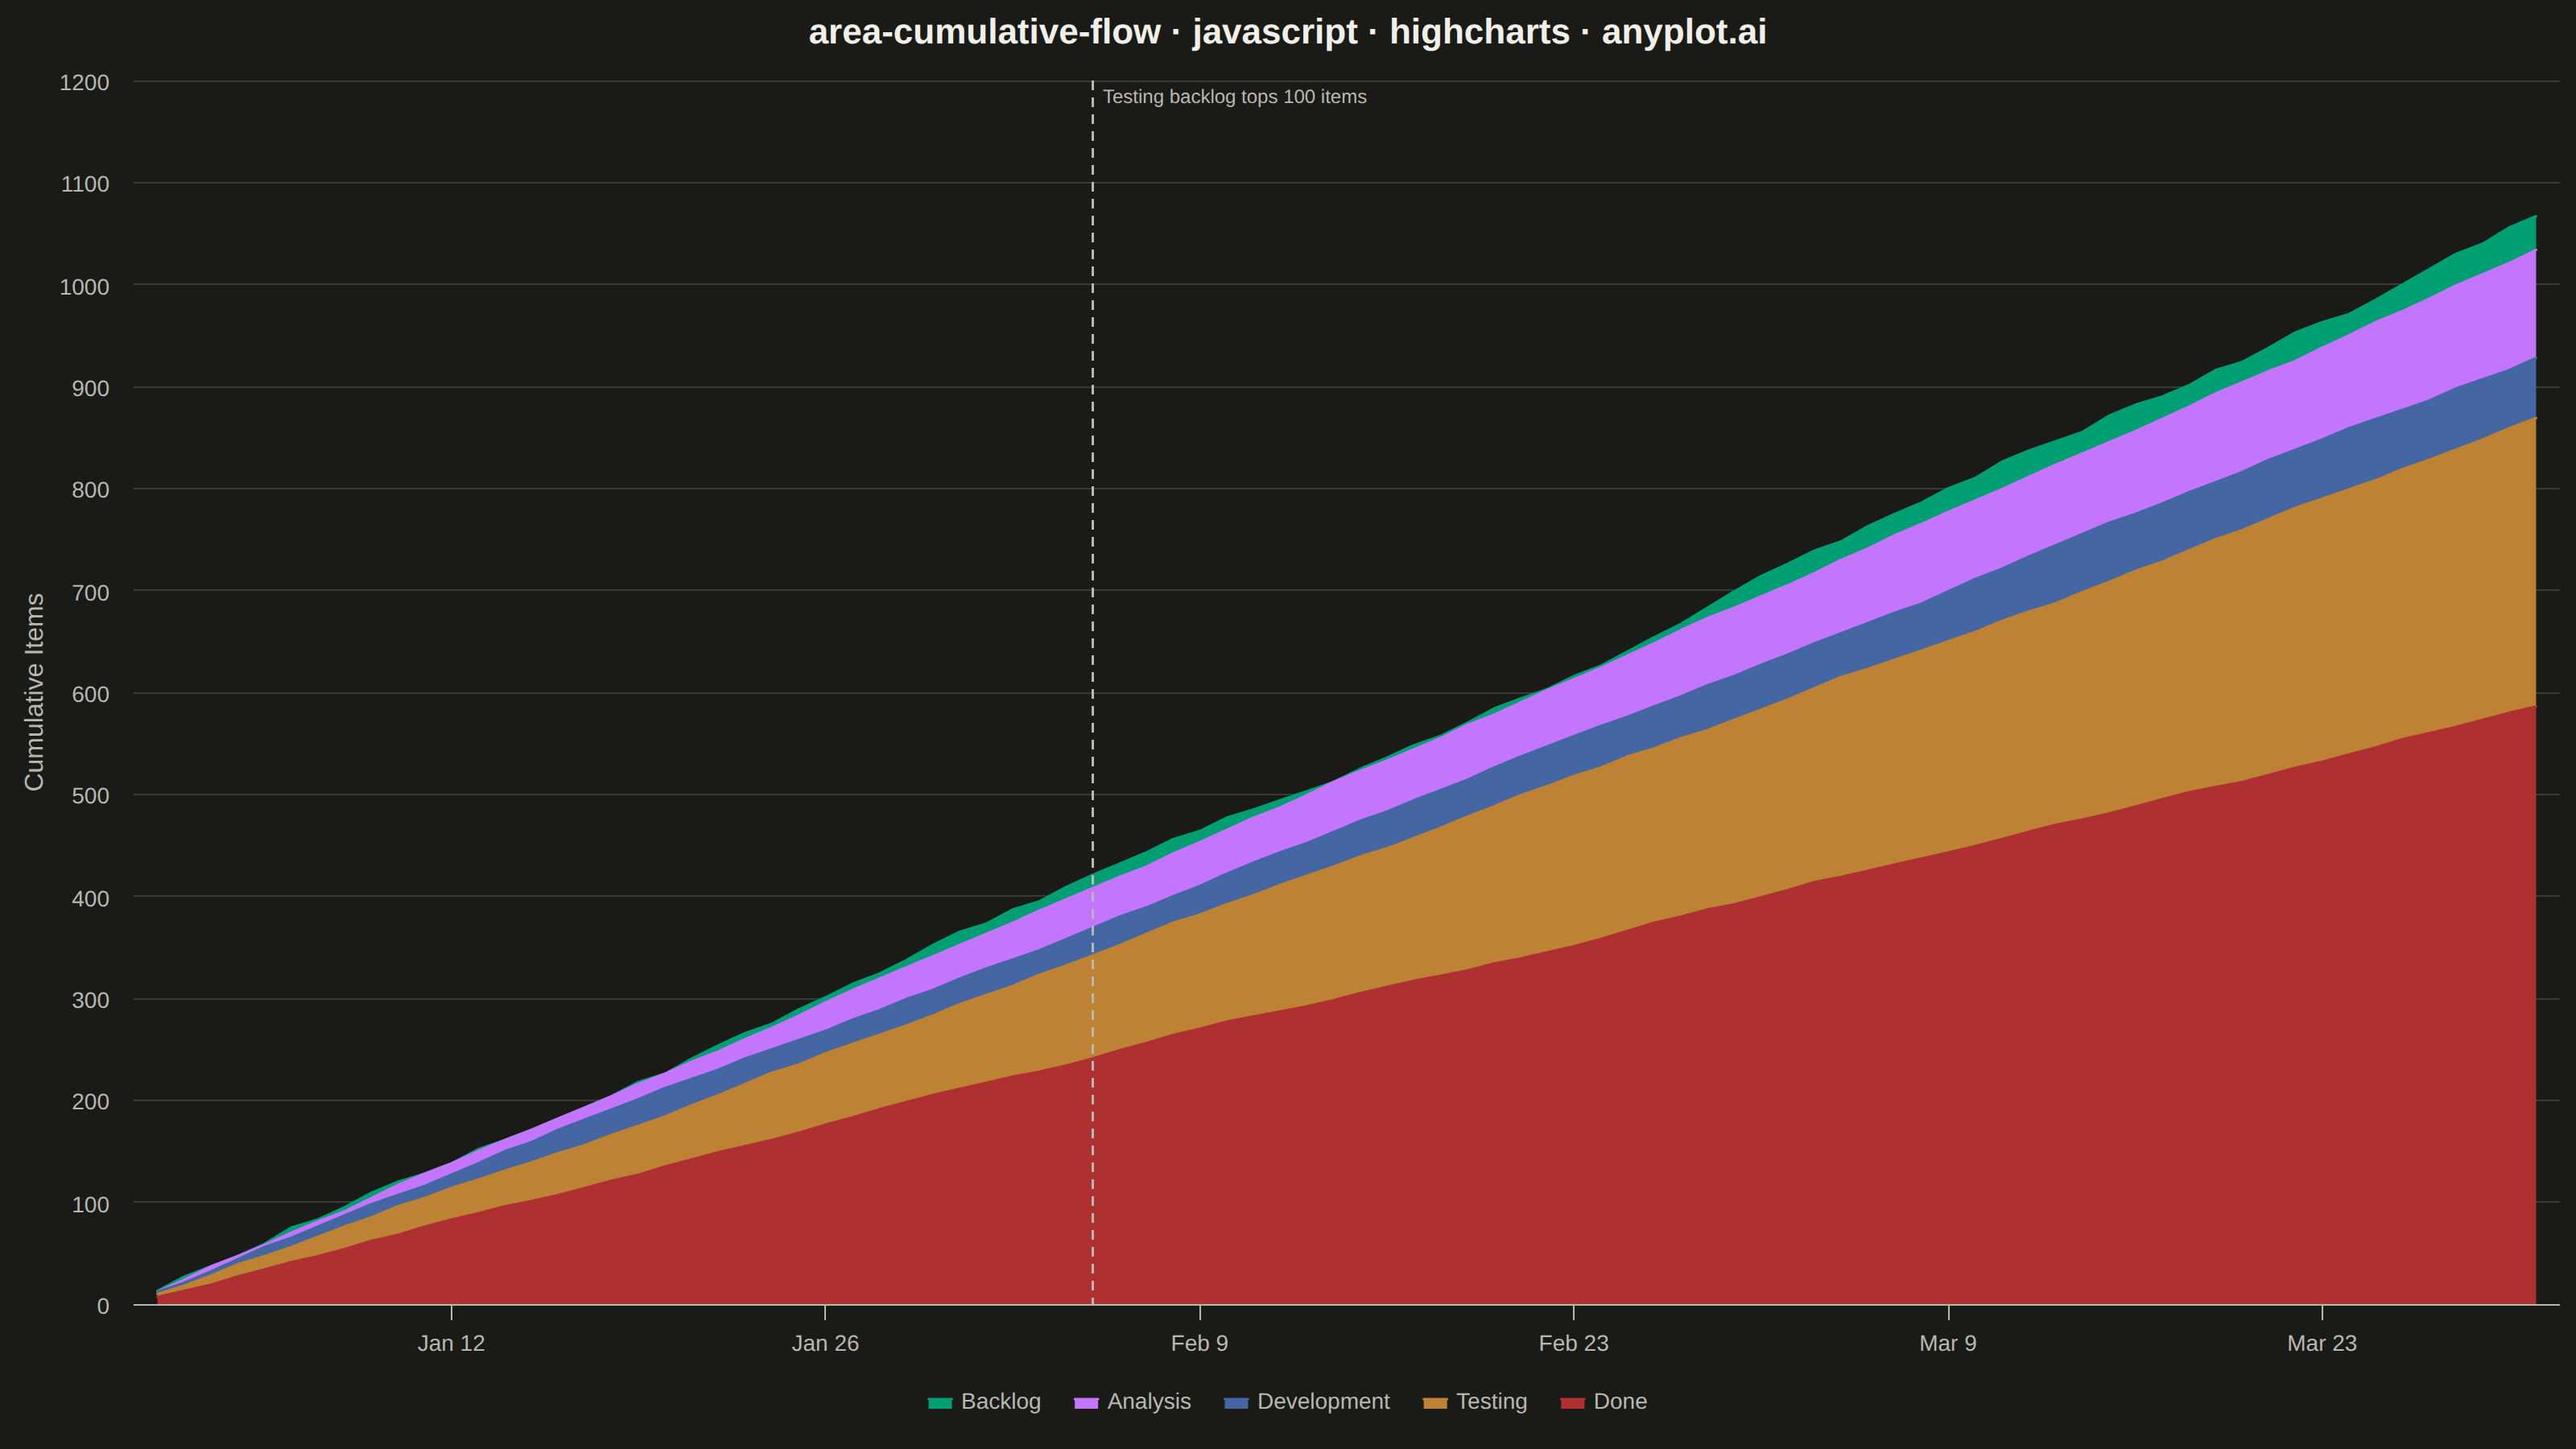
The same plot in 14 other libraries — JavaScript: Chart.js, D3.js, Apache ECharts, MUI X Charts; Python: Altair, Bokeh, lets-plot, Matplotlib, Plotly, plotnine, Pygal, Seaborn; R: ggplot2; Julia: Makie.jl. Compare all 15 side by side: Cumulative Flow Diagram for Workflow Analytics in Python, R, Julia and JavaScript.
A cumulative flow diagram (CFD) displays the cumulative count of items in each workflow stage as stacked areas over time. Each band represents a stage (e.g., Backlog, In Progress, Done), and the vertical distance between two adjacent band boundaries shows the number of items currently in that stage (work-in-progress). This is a key visualization in Lean and Agile project management for identifying bottlenecks, monitoring throughput, and assessing flow efficiency across a delivery pipeline.
// anyplot.ai
// area-cumulative-flow: Cumulative Flow Diagram for Workflow Analytics
// Library: highcharts 12.6.0 | JavaScript 22.23.2
// Quality: 85/100 | Created: 2026-08-18

const t = window.ANYPLOT_TOKENS;

// --- Data (in-memory, deterministic) ----------------------------------------
// Kanban delivery pipeline: cumulative item counts per stage over 90 days.
// Each stage's exit capacity is a little tighter than the one before it, so
// every band keeps a readable minimum WIP; Testing's exit rate (into Done) is
// the most undersized relative to its inflow, so its band widens the most
// over time — the dominant bottleneck a CFD is meant to surface.
const DAYS = 90;
const STAGES = ["Backlog", "Analysis", "Development", "Testing", "Done"];
const CAPACITIES = [Infinity, 11, 10, 9, 6];
const DAY_MS = 24 * 3600 * 1000;
const START = Date.UTC(2026, 0, 1);

let seed = 42;
function lcg() {
  seed = (seed * 1103515245 + 12345) % 2147483648;
  return seed / 2147483648;
}

const cumulative = STAGES.map(() => new Array(DAYS).fill(0));
for (let day = 0; day < DAYS; day++) {
  const arrivals = 8 + Math.round(lcg() * 8);
  cumulative[0][day] = (day === 0 ? 0 : cumulative[0][day - 1]) + arrivals;

  for (let stage = 1; stage < STAGES.length; stage++) {
    const prevDay = day === 0 ? 0 : cumulative[stage][day - 1];
    const available = cumulative[stage - 1][day] - prevDay;
    const capacityNoise = Math.round(lcg() * 3) - 1;
    const throughput = Math.max(0, Math.min(available, CAPACITIES[stage] + capacityNoise));
    cumulative[stage][day] = prevDay + throughput;
  }
}

// WIP per stage = the gap between two adjacent cumulative curves (the count
// currently sitting in that stage). Stacking these additively reconstructs
// the cumulative-flow bands: Done (terminal, no next stage) is its own raw
// cumulative count.
const wip = STAGES.map((name, i) =>
  cumulative[i].map((value, day) => value - (i + 1 < STAGES.length ? cumulative[i + 1][day] : 0))
);

// Mark the day the Testing WIP band first crosses 100 items — the point
// where the bottleneck stops being a minor lag and becomes a visible pileup.
const bottleneckDay = wip[3].findIndex((value) => value >= 100);
const bottleneckX = START + bottleneckDay * DAY_MS;

// Highcharts stacks the *last* series in the array against the axis, so
// natural workflow order (Backlog first) already puts Backlog's band at the
// top of the stack and Done's band at the bottom, as the spec requires.
const series = STAGES.map((name, i) => ({
  name,
  type: "area",
  data: wip[i].map((value, day) => [START + day * DAY_MS, value]),
  color: t.palette[i],
  lineColor: t.palette[i],
  fillOpacity: 1,
  lineWidth: 1.5,
  marker: { enabled: false },
}));

// --- Chart -------------------------------------------------------------------
Highcharts.chart("container", {
  chart: { type: "area", backgroundColor: "transparent", animation: false,
           style: { fontFamily: "inherit" } },
  credits: { enabled: false },
  colors: t.palette,
  title: { text: "area-cumulative-flow · javascript · highcharts · anyplot.ai",
           style: { color: t.ink, fontSize: "22px", fontWeight: "600" } },
  xAxis: { type: "datetime", tickInterval: 14 * DAY_MS,
           lineColor: t.inkSoft, tickColor: t.inkSoft,
           labels: { style: { color: t.inkSoft, fontSize: "14px" } },
           plotLines: [{ value: bottleneckX, color: t.inkSoft, width: 1.5, dashStyle: "Dash",
                          zIndex: 5,
                          label: { text: "Testing backlog tops 100 items", rotation: 0,
                                   x: 6, y: 14,
                                   style: { color: t.inkSoft, fontSize: "12px" } } }] },
  yAxis: { title: { text: "Cumulative Items", style: { color: t.inkSoft, fontSize: "16px" } },
           min: 0, gridLineColor: t.grid,
           labels: { style: { color: t.inkSoft, fontSize: "14px" } } },
  legend: { itemStyle: { color: t.inkSoft, fontSize: "14px" },
            itemHoverStyle: { color: t.ink } },
  tooltip: { shared: true, xDateFormat: "%b %e, %Y",
             backgroundColor: t.elevatedBg, borderColor: t.grid,
             style: { color: t.ink, fontSize: "13px" } },
  plotOptions: { series: { animation: false, stacking: "normal" } },
  series,
});
Runnable source as JSON, for any HTTP client: https://api.anyplot.ai/specs/area-cumulative-flow/highcharts/code. Any spec id and library id listed in llms-full.txt fit the same URL shape; every URL below is complete and callable.
{
  "spec_id": "area-cumulative-flow",
  "language": "javascript",
  "library": "highcharts",
  "page": "https://anyplot.ai/area-cumulative-flow/javascript/highcharts",
  "hub": "https://anyplot.ai/area-cumulative-flow",
  "code_json": "https://api.anyplot.ai/specs/area-cumulative-flow/highcharts/code",
  "spec_json": "https://api.anyplot.ai/specs/area-cumulative-flow",
  "render_light_png": "https://storage.googleapis.com/anyplot-images/plots/area-cumulative-flow/javascript/highcharts/plot-light.png",
  "render_dark_png": "https://storage.googleapis.com/anyplot-images/plots/area-cumulative-flow/javascript/highcharts/plot-dark.png",
  "interactive_light_html": "https://storage.googleapis.com/anyplot-images/plots/area-cumulative-flow/javascript/highcharts/plot-light.html",
  "interactive_dark_html": "https://storage.googleapis.com/anyplot-images/plots/area-cumulative-flow/javascript/highcharts/plot-dark.html",
  "quality_score": 85.0,
  "license": "MIT",
  "guide": "https://anyplot.ai/llms.txt"
}
Part of Cumulative Flow Diagram for Workflow Analytics on anyplot.ai.