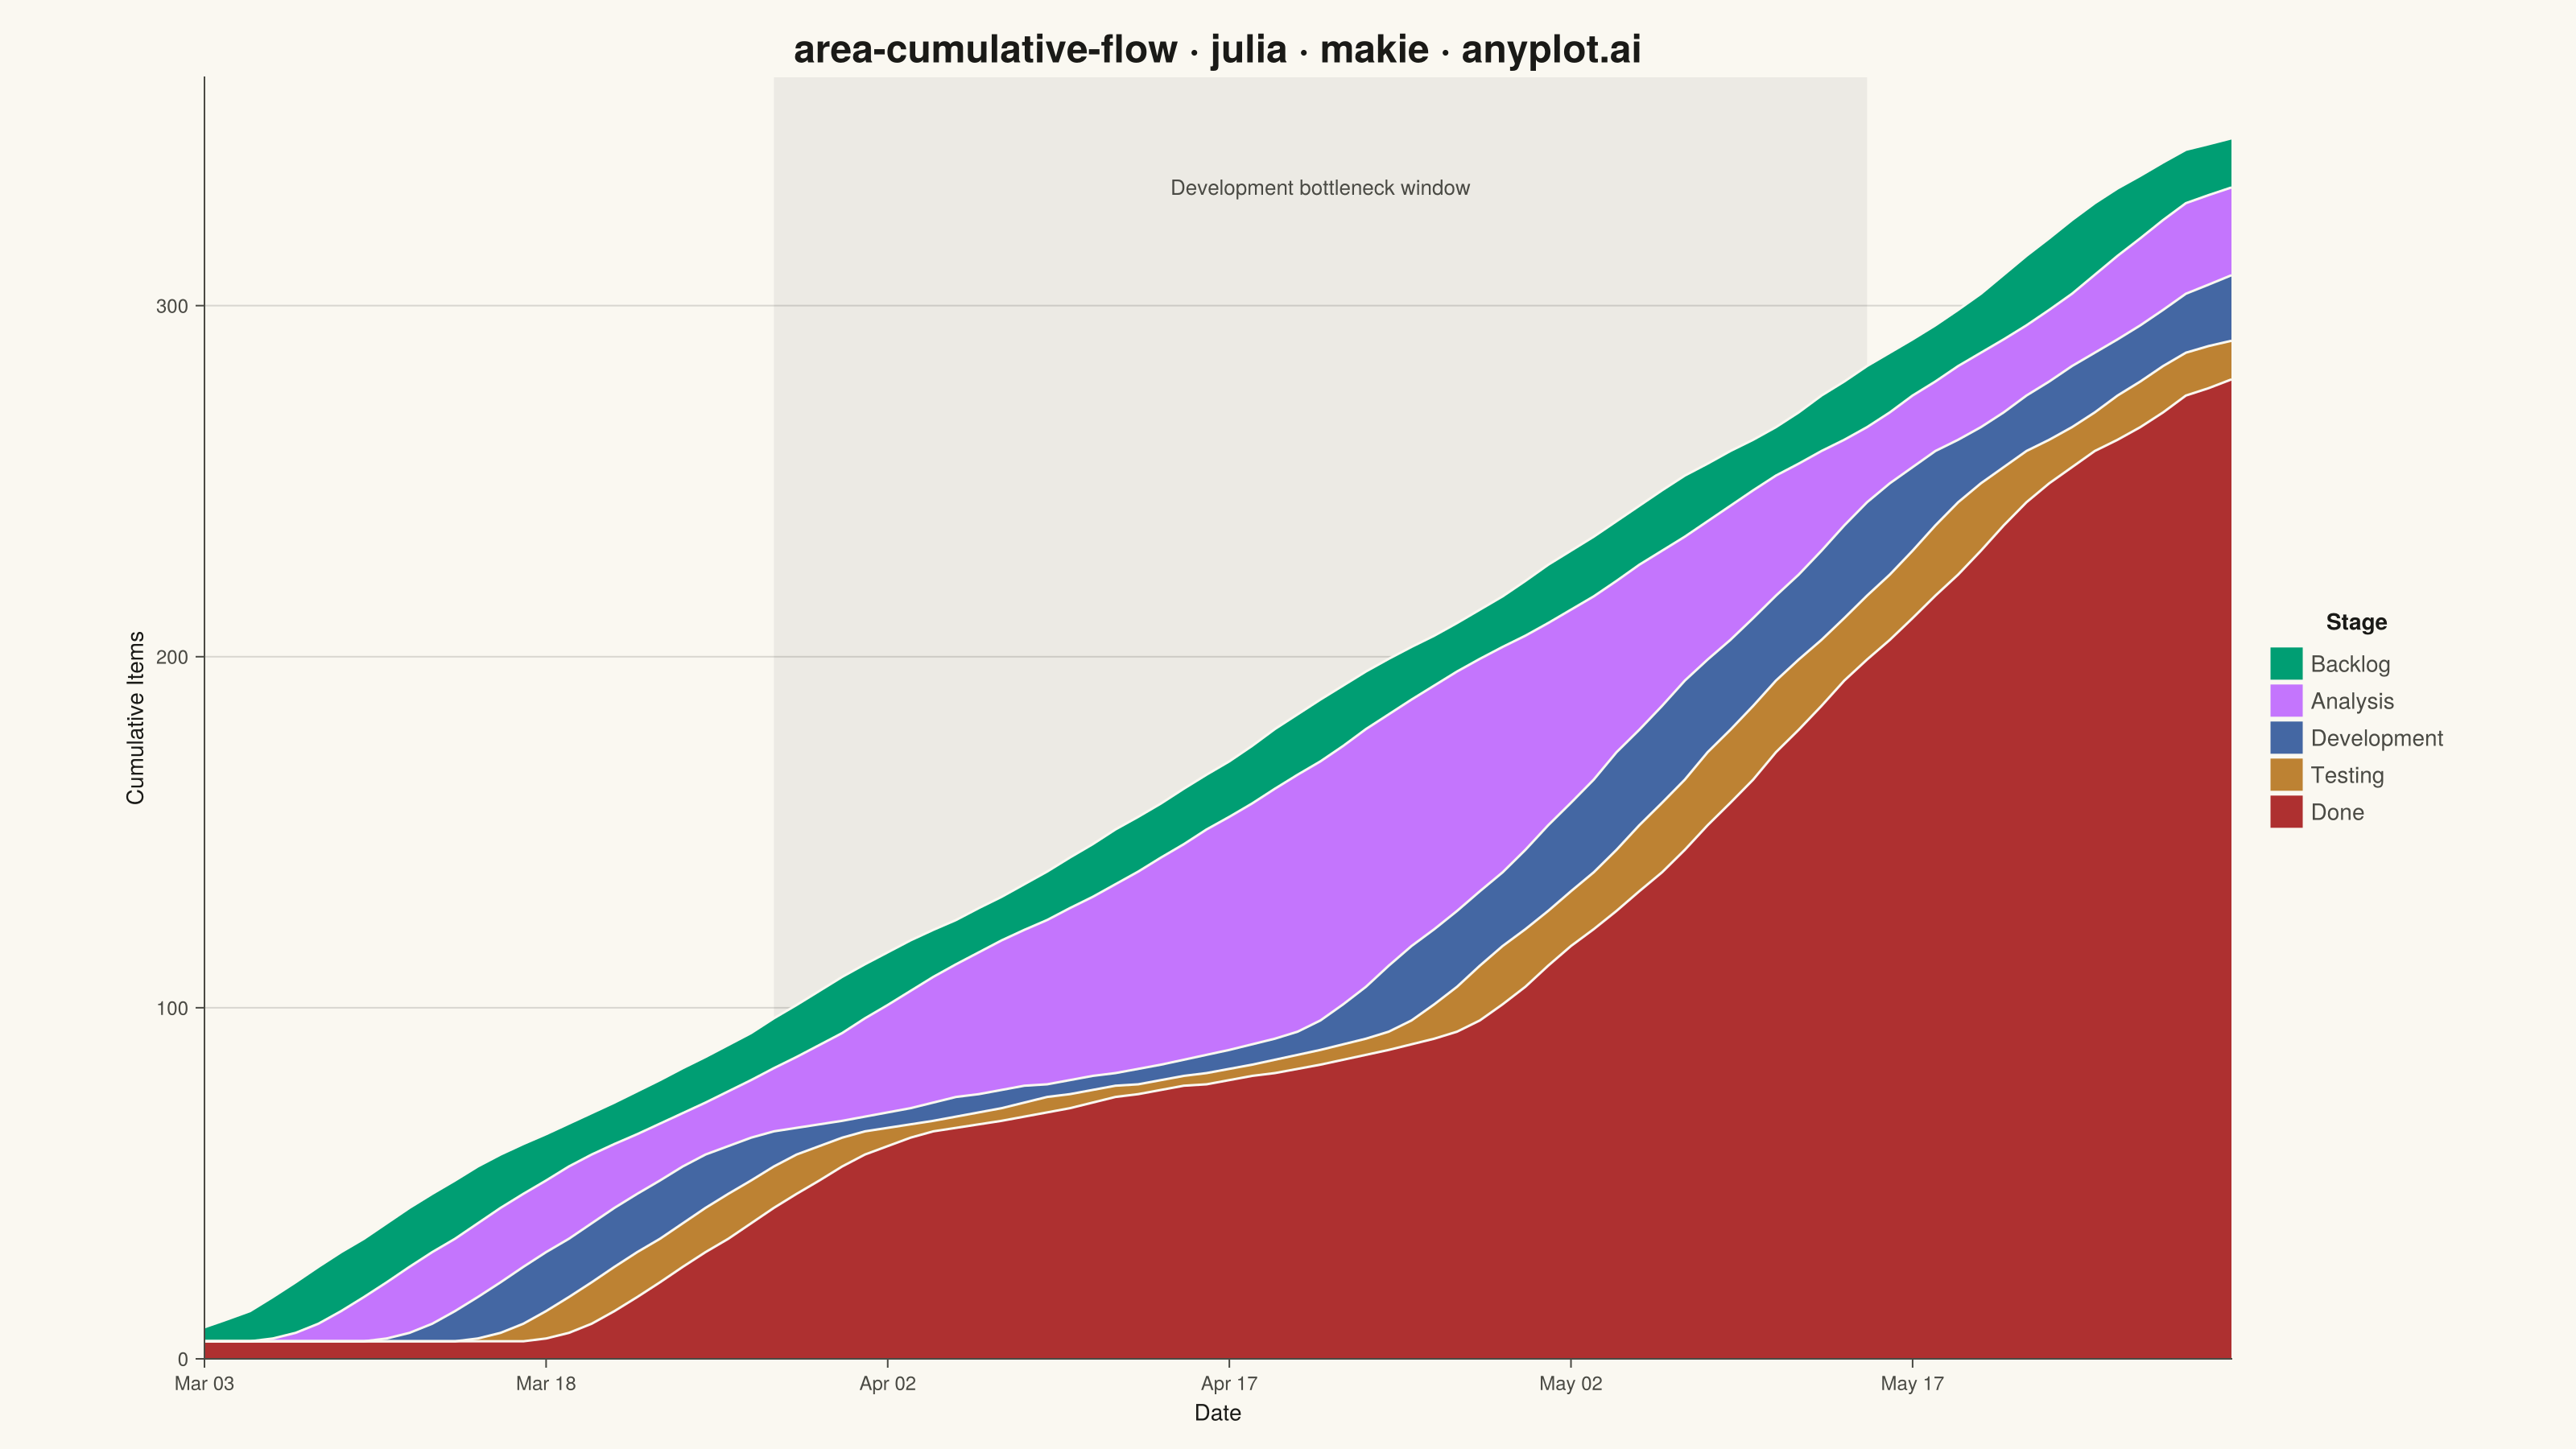
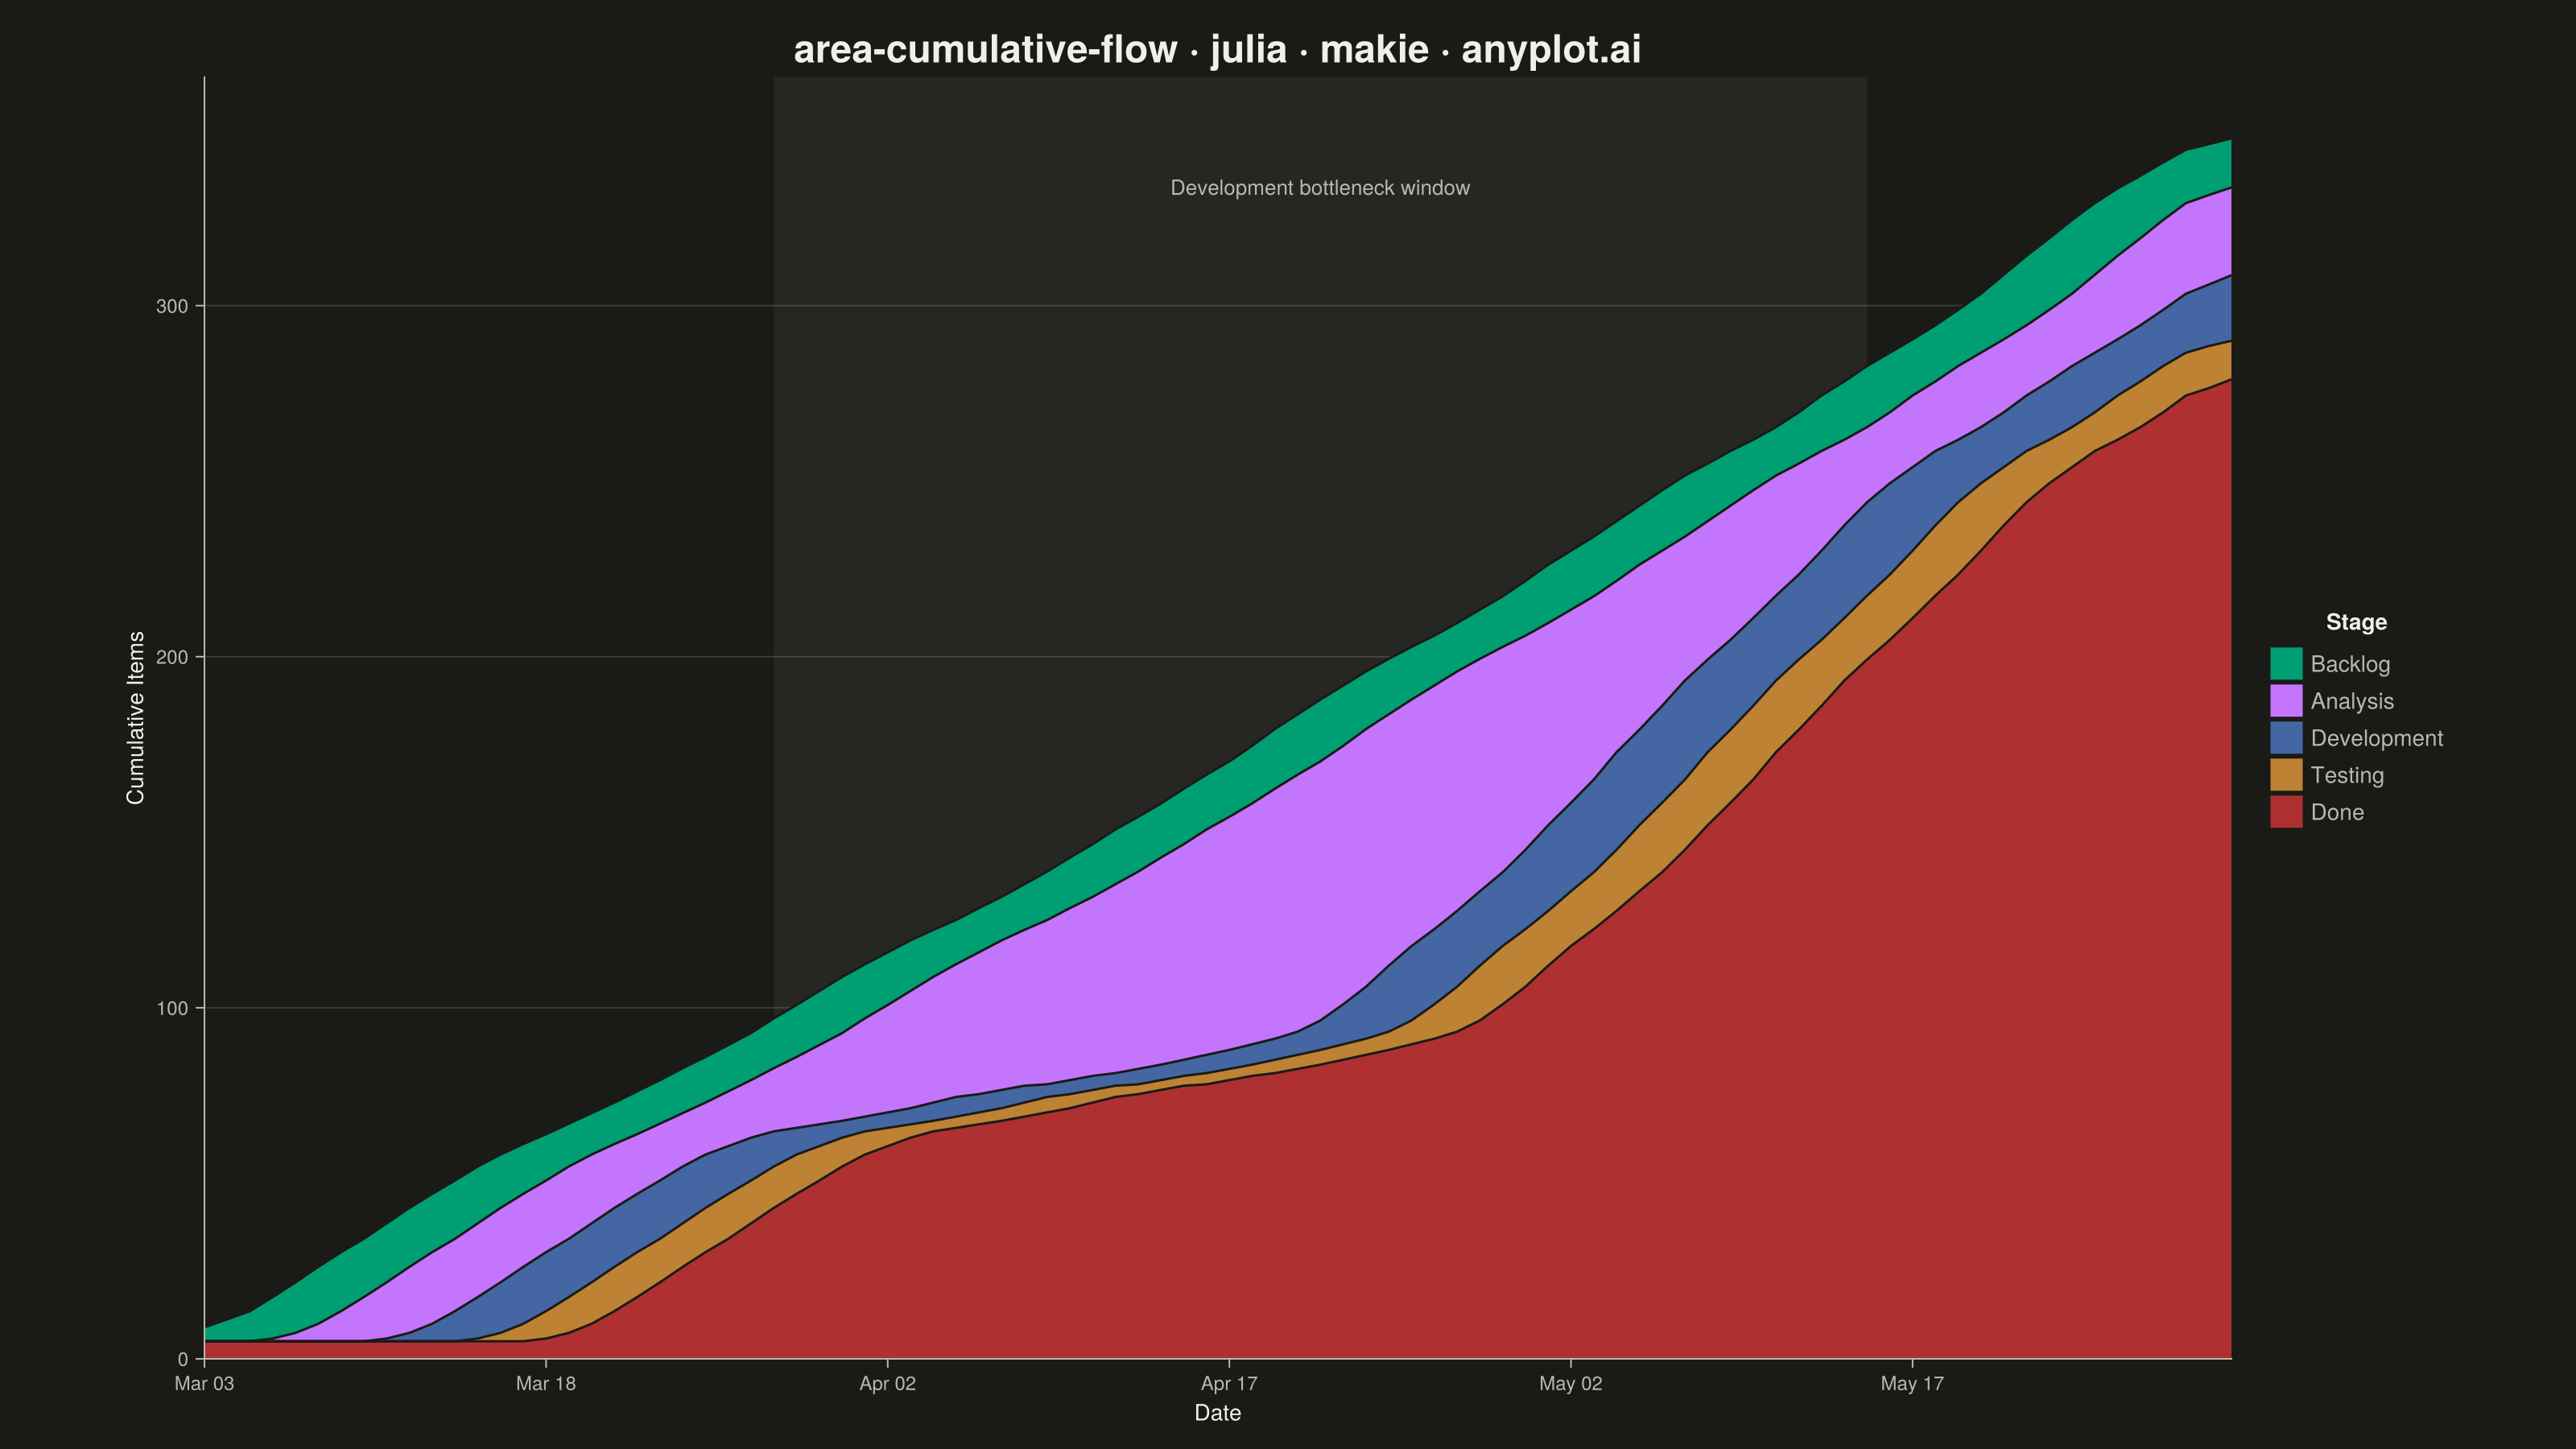
The same plot in 14 other libraries — Python: Altair, Bokeh, lets-plot, Matplotlib, Plotly, plotnine, Pygal, Seaborn; R: ggplot2; JavaScript: Chart.js, D3.js, Apache ECharts, Highcharts, MUI X Charts. Compare all 15 side by side: Cumulative Flow Diagram for Workflow Analytics in Python, R, Julia and JavaScript.
A cumulative flow diagram (CFD) displays the cumulative count of items in each workflow stage as stacked areas over time. Each band represents a stage (e.g., Backlog, In Progress, Done), and the vertical distance between two adjacent band boundaries shows the number of items currently in that stage (work-in-progress). This is a key visualization in Lean and Agile project management for identifying bottlenecks, monitoring throughput, and assessing flow efficiency across a delivery pipeline.
# anyplot.ai
# area-cumulative-flow: Cumulative Flow Diagram for Workflow Analytics
# Library: makie 0.21.9 | Julia 1.11.9
# Quality: 95/100 | Created: 2026-08-19

using CairoMakie
using Colors
using Random
using Dates

Random.seed!(42)

# Theme tokens (see prompts/default-style-guide.md "Theme-adaptive Chrome")
const THEME    = get(ENV, "ANYPLOT_THEME", "light")
const PAGE_BG  = THEME == "light" ? colorant"#FAF8F1" : colorant"#1A1A17"
const ELEV_BG  = THEME == "light" ? colorant"#FFFDF6" : colorant"#242420"
const INK      = THEME == "light" ? colorant"#1A1A17" : colorant"#F0EFE8"
const INK_SOFT = THEME == "light" ? colorant"#4A4A44" : colorant"#B8B7B0"

# Imprint categorical palette — position 1 (#009E73) is always the first series
const IMPRINT_PALETTE = [
    colorant"#009E73",  # 1 — brand green
    colorant"#C475FD",  # 2 — lavender
    colorant"#4467A3",  # 3 — blue
    colorant"#BD8233",  # 4 — ochre
    colorant"#AE3030",  # 5 — matte red
]

# Data — 90-day Kanban board with a Backlog -> Analysis -> Development ->
# Testing -> Done pipeline. Each stage's cumulative curve is the arrival
# curve re-sampled at a dwell-time offset, so the vertical gap between two
# adjacent curves is exactly the WIP for the stage in between. Development
# carries a time-varying dwell that bulges mid-range (a hiring crunch) and
# drains by the end — the widening/narrowing bottleneck signal a CFD is
# meant to surface.
n_days = 90
start_date = Date(2024, 3, 3)
dates = start_date .+ Day.(0:(n_days - 1))
day_index = 1:n_days
t = collect(1:n_days)

daily_arrivals = rand(2:6, n_days)
backlog_cum = cumsum(daily_arrivals)

dwell_backlog = 4
analysis_cum = backlog_cum[clamp.(t .- dwell_backlog, 1, n_days)]

crunch = clamp.(1 .- abs.(t .- 50) ./ 25, 0.0, 1.0)
dwell_development = round.(Int, 5 .+ 16 .* crunch)
development_cum = analysis_cum[clamp.(t .- dwell_development, 1, n_days)]

dwell_testing = 4
testing_cum = development_cum[clamp.(t .- dwell_testing, 1, n_days)]

dwell_done = 3
done_cum = testing_cum[clamp.(t .- dwell_done, 1, n_days)]

zero_cum = zeros(Int, n_days)

# A short centered moving average softens the day-to-day arrival noise into
# a smoother band silhouette. Averaging is linear, so it preserves both the
# non-decreasing property of each curve and the ordering between adjacent
# curves (their pointwise-non-negative difference stays non-negative once
# averaged) — the CFD's monotonicity and stacking guarantees survive intact.
function smooth_curve(x::AbstractVector{<:Real}, window::Int)
    n = length(x)
    half = window ÷ 2
    return [sum(x[max(1, i - half):min(n, i + half)]) /
            (min(n, i + half) - max(1, i - half) + 1) for i in 1:n]
end

backlog_smooth     = smooth_curve(backlog_cum, 5)
analysis_smooth    = smooth_curve(analysis_cum, 5)
development_smooth = smooth_curve(development_cum, 5)
testing_smooth     = smooth_curve(testing_cum, 5)
done_smooth        = smooth_curve(done_cum, 5)
zero_smooth        = Float64.(zero_cum)

# Plot
fig = Figure(
    resolution      = (1600, 900),
    fontsize        = 14,
    backgroundcolor = PAGE_BG,
)

ax = Axis(
    fig[1, 1];
    title              = "area-cumulative-flow · julia · makie · anyplot.ai",
    titlesize          = 24,
    titlecolor         = INK,
    xlabel             = "Date",
    ylabel             = "Cumulative Items",
    xlabelsize         = 14,
    ylabelsize         = 14,
    xlabelcolor        = INK,
    ylabelcolor        = INK,
    xticklabelsize     = 12,
    yticklabelsize     = 12,
    xticklabelcolor    = INK_SOFT,
    yticklabelcolor    = INK_SOFT,
    xtickcolor         = INK_SOFT,
    ytickcolor         = INK_SOFT,
    backgroundcolor    = PAGE_BG,
    topspinevisible    = false,
    rightspinevisible  = false,
    leftspinecolor     = INK_SOFT,
    bottomspinecolor   = INK_SOFT,
    xgridvisible       = false,
    ygridcolor         = RGBAf(INK.r, INK.g, INK.b, 0.15),
)

# Makie-distinctive touch: shade + label the "hiring crunch" window behind
# the bands so the Development bottleneck reads at a glance, not just from
# band thickness. Drawn first so the stacked bands sit on top of it.
crunch_lo, crunch_hi = t[findfirst(>(0), crunch)], t[findlast(>(0), crunch)]
vspan!(ax, crunch_lo, crunch_hi; color = RGBAf(INK.r, INK.g, INK.b, 0.06))
text!(ax, t[argmax(crunch)], maximum(backlog_smooth) * 0.97;
      text = "Development bottleneck window", align = (:center, :top),
      color = INK_SOFT, fontsize = 13)

# Bands stacked with the earliest stage on top (per spec: Backlog above,
# Done below), drawn from the smoothed cumulative curves — the vertical
# thickness of each band is already the WIP for that stage since counts
# are monotonically non-decreasing downstream.
stage_lowers = (analysis_smooth, development_smooth, testing_smooth, done_smooth, zero_smooth)
stage_uppers = (backlog_smooth, analysis_smooth, development_smooth, testing_smooth, done_smooth)
stage_labels = ("Backlog", "Analysis", "Development", "Testing", "Done")

for i in 1:5
    band!(ax, day_index, stage_lowers[i], stage_uppers[i];
          color = IMPRINT_PALETTE[i], label = stage_labels[i])
end

# Thin page-background strokes crisp up the boundaries between bands
for curve in (backlog_smooth, analysis_smooth, development_smooth, testing_smooth, done_smooth)
    lines!(ax, day_index, curve; color = PAGE_BG, linewidth = 1.5)
end

xlims!(ax, 1, n_days)
ylims!(ax, 0, maximum(backlog_smooth) * 1.05)

tick_idx = 1:15:n_days
ax.xticks = (Float64.(collect(tick_idx)), Dates.format.(dates[tick_idx], "u dd"))

Legend(
    fig[1, 2], ax, "Stage";
    framevisible  = false,
    backgroundcolor = ELEV_BG,
    labelcolor    = INK_SOFT,
    titlecolor    = INK,
)
colsize!(fig.layout, 1, Relative(0.84))

# Save
save("plot-$(THEME).png", fig; px_per_unit = 2)
Runnable source as JSON, for any HTTP client: https://api.anyplot.ai/specs/area-cumulative-flow/makie/code. Any spec id and library id listed in llms-full.txt fit the same URL shape; every URL below is complete and callable.
{
  "spec_id": "area-cumulative-flow",
  "language": "julia",
  "library": "makie",
  "page": "https://anyplot.ai/area-cumulative-flow/julia/makie",
  "hub": "https://anyplot.ai/area-cumulative-flow",
  "code_json": "https://api.anyplot.ai/specs/area-cumulative-flow/makie/code",
  "spec_json": "https://api.anyplot.ai/specs/area-cumulative-flow",
  "render_light_png": "https://storage.googleapis.com/anyplot-images/plots/area-cumulative-flow/julia/makie/plot-light.png",
  "render_dark_png": "https://storage.googleapis.com/anyplot-images/plots/area-cumulative-flow/julia/makie/plot-dark.png",
  "quality_score": 95.0,
  "license": "MIT",
  "guide": "https://anyplot.ai/llms.txt"
}
Part of Cumulative Flow Diagram for Workflow Analytics on anyplot.ai.