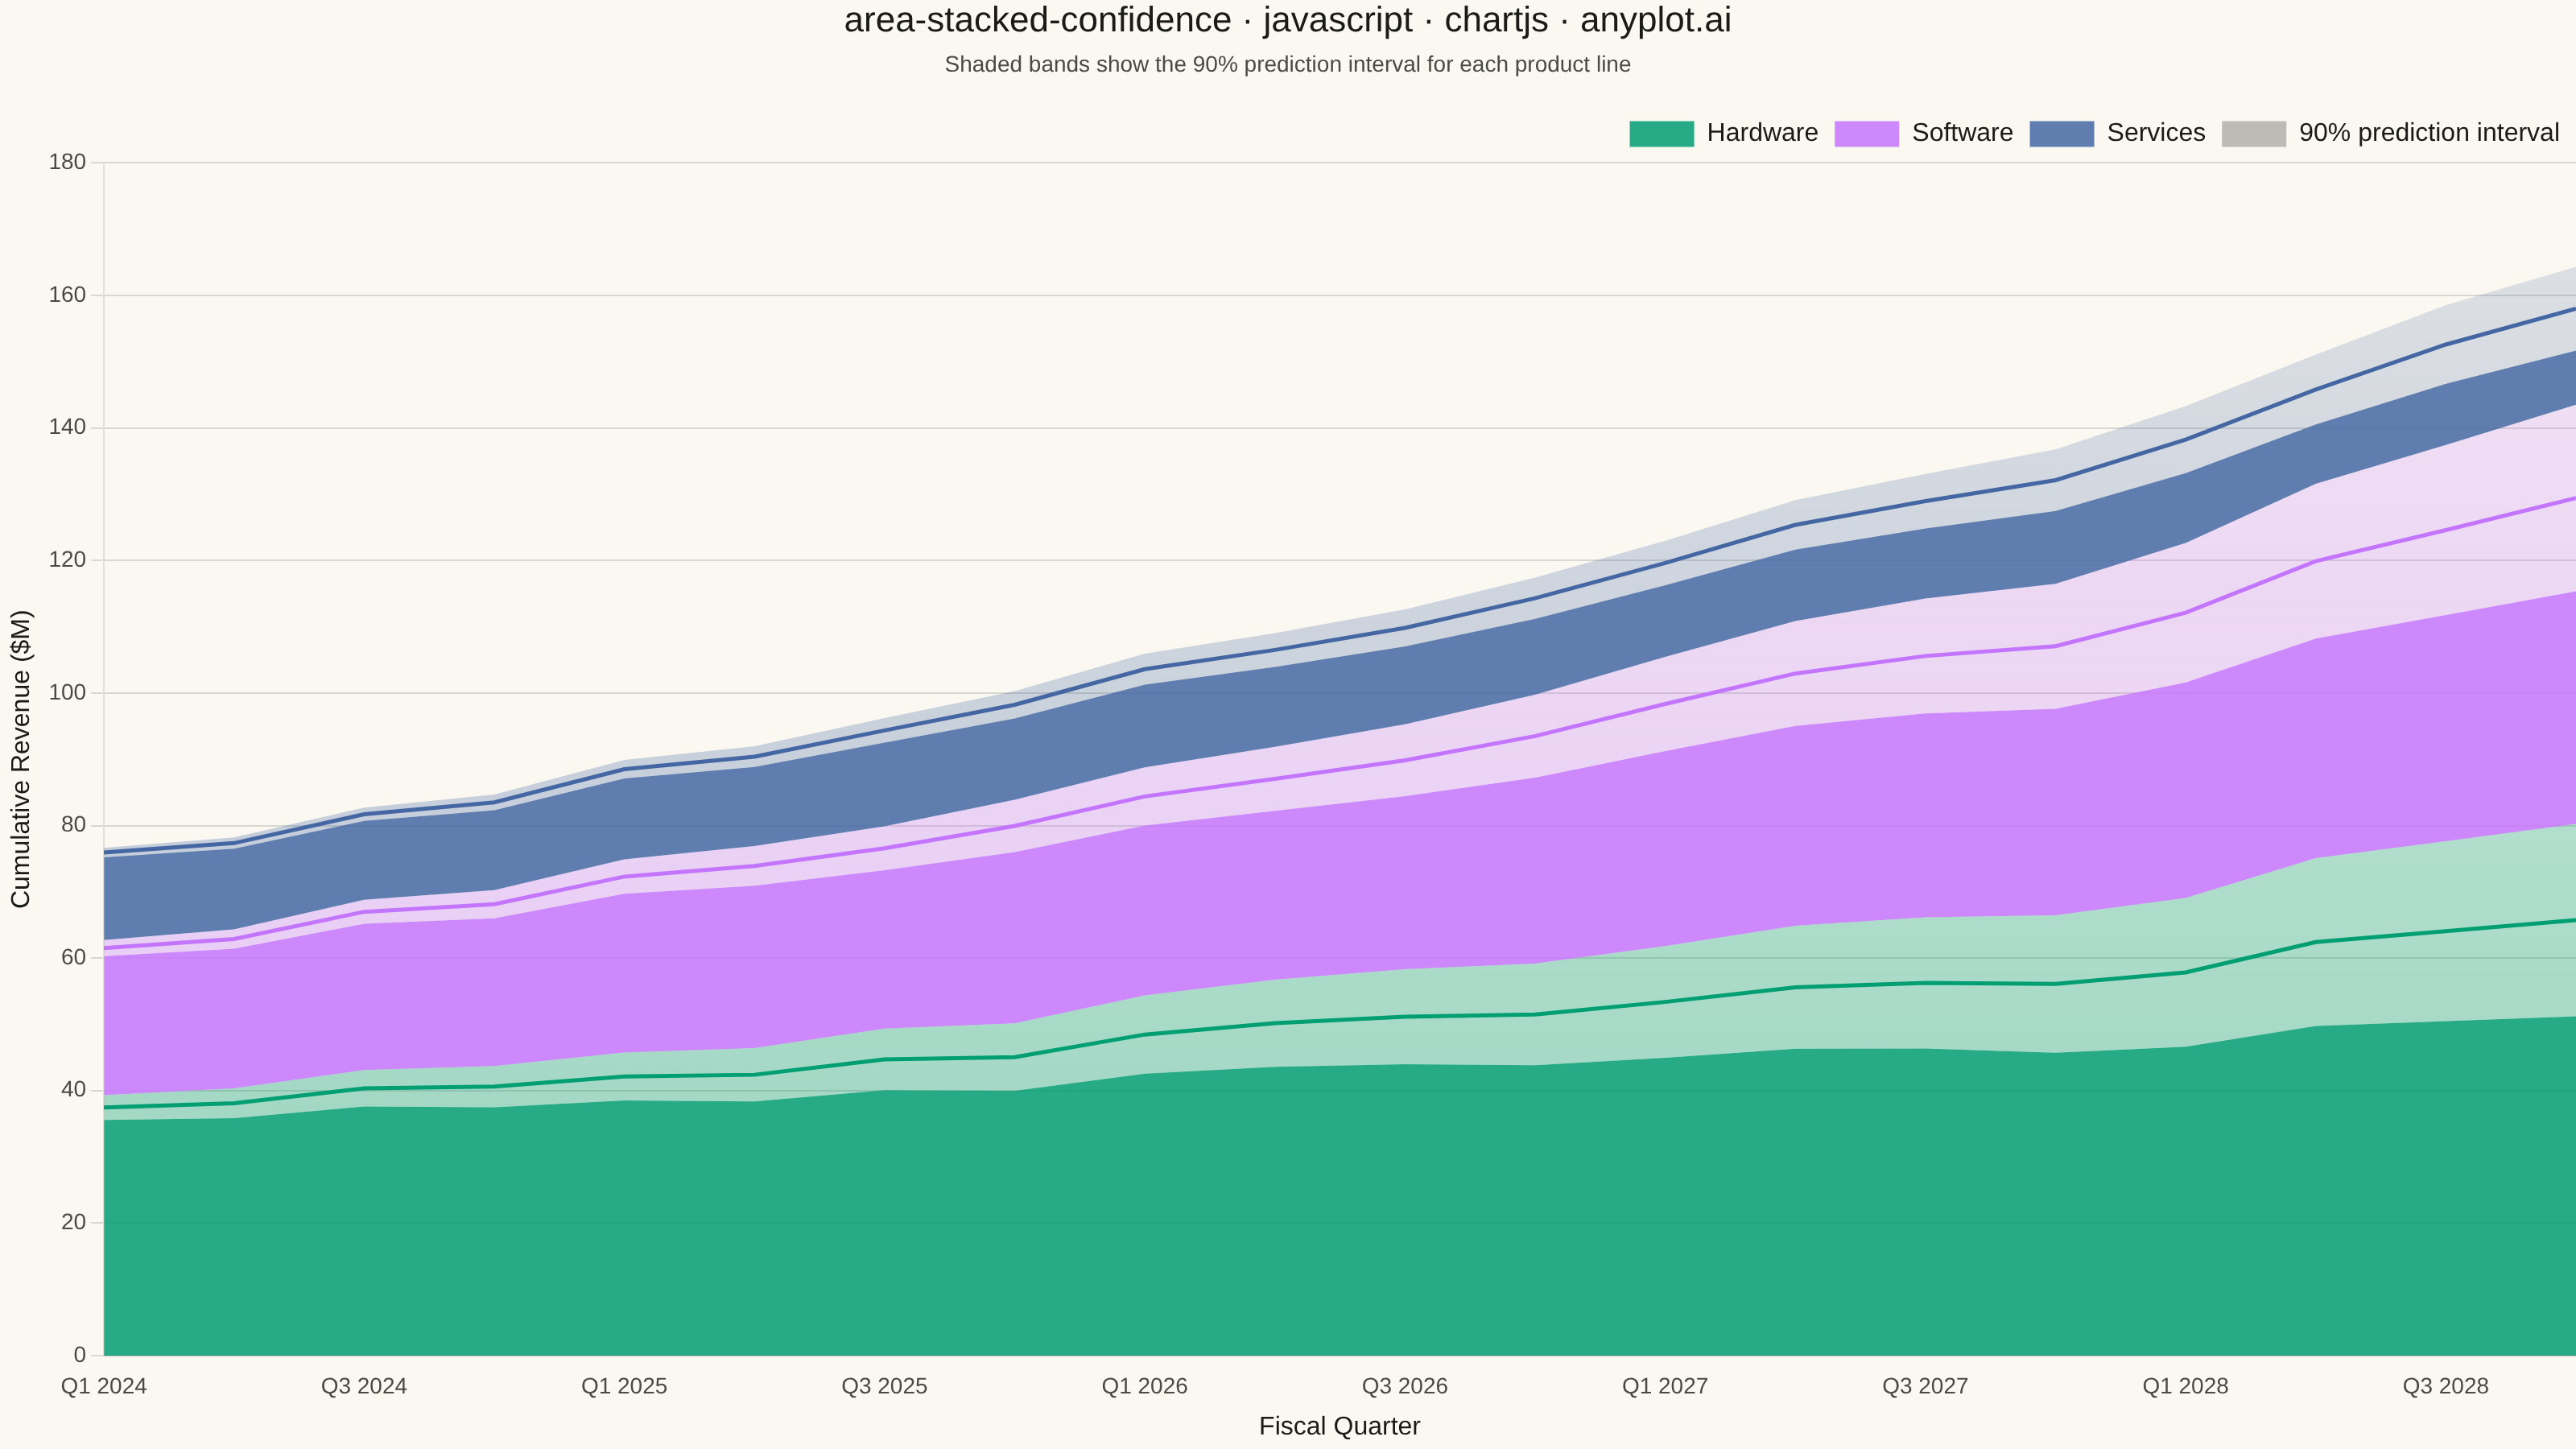
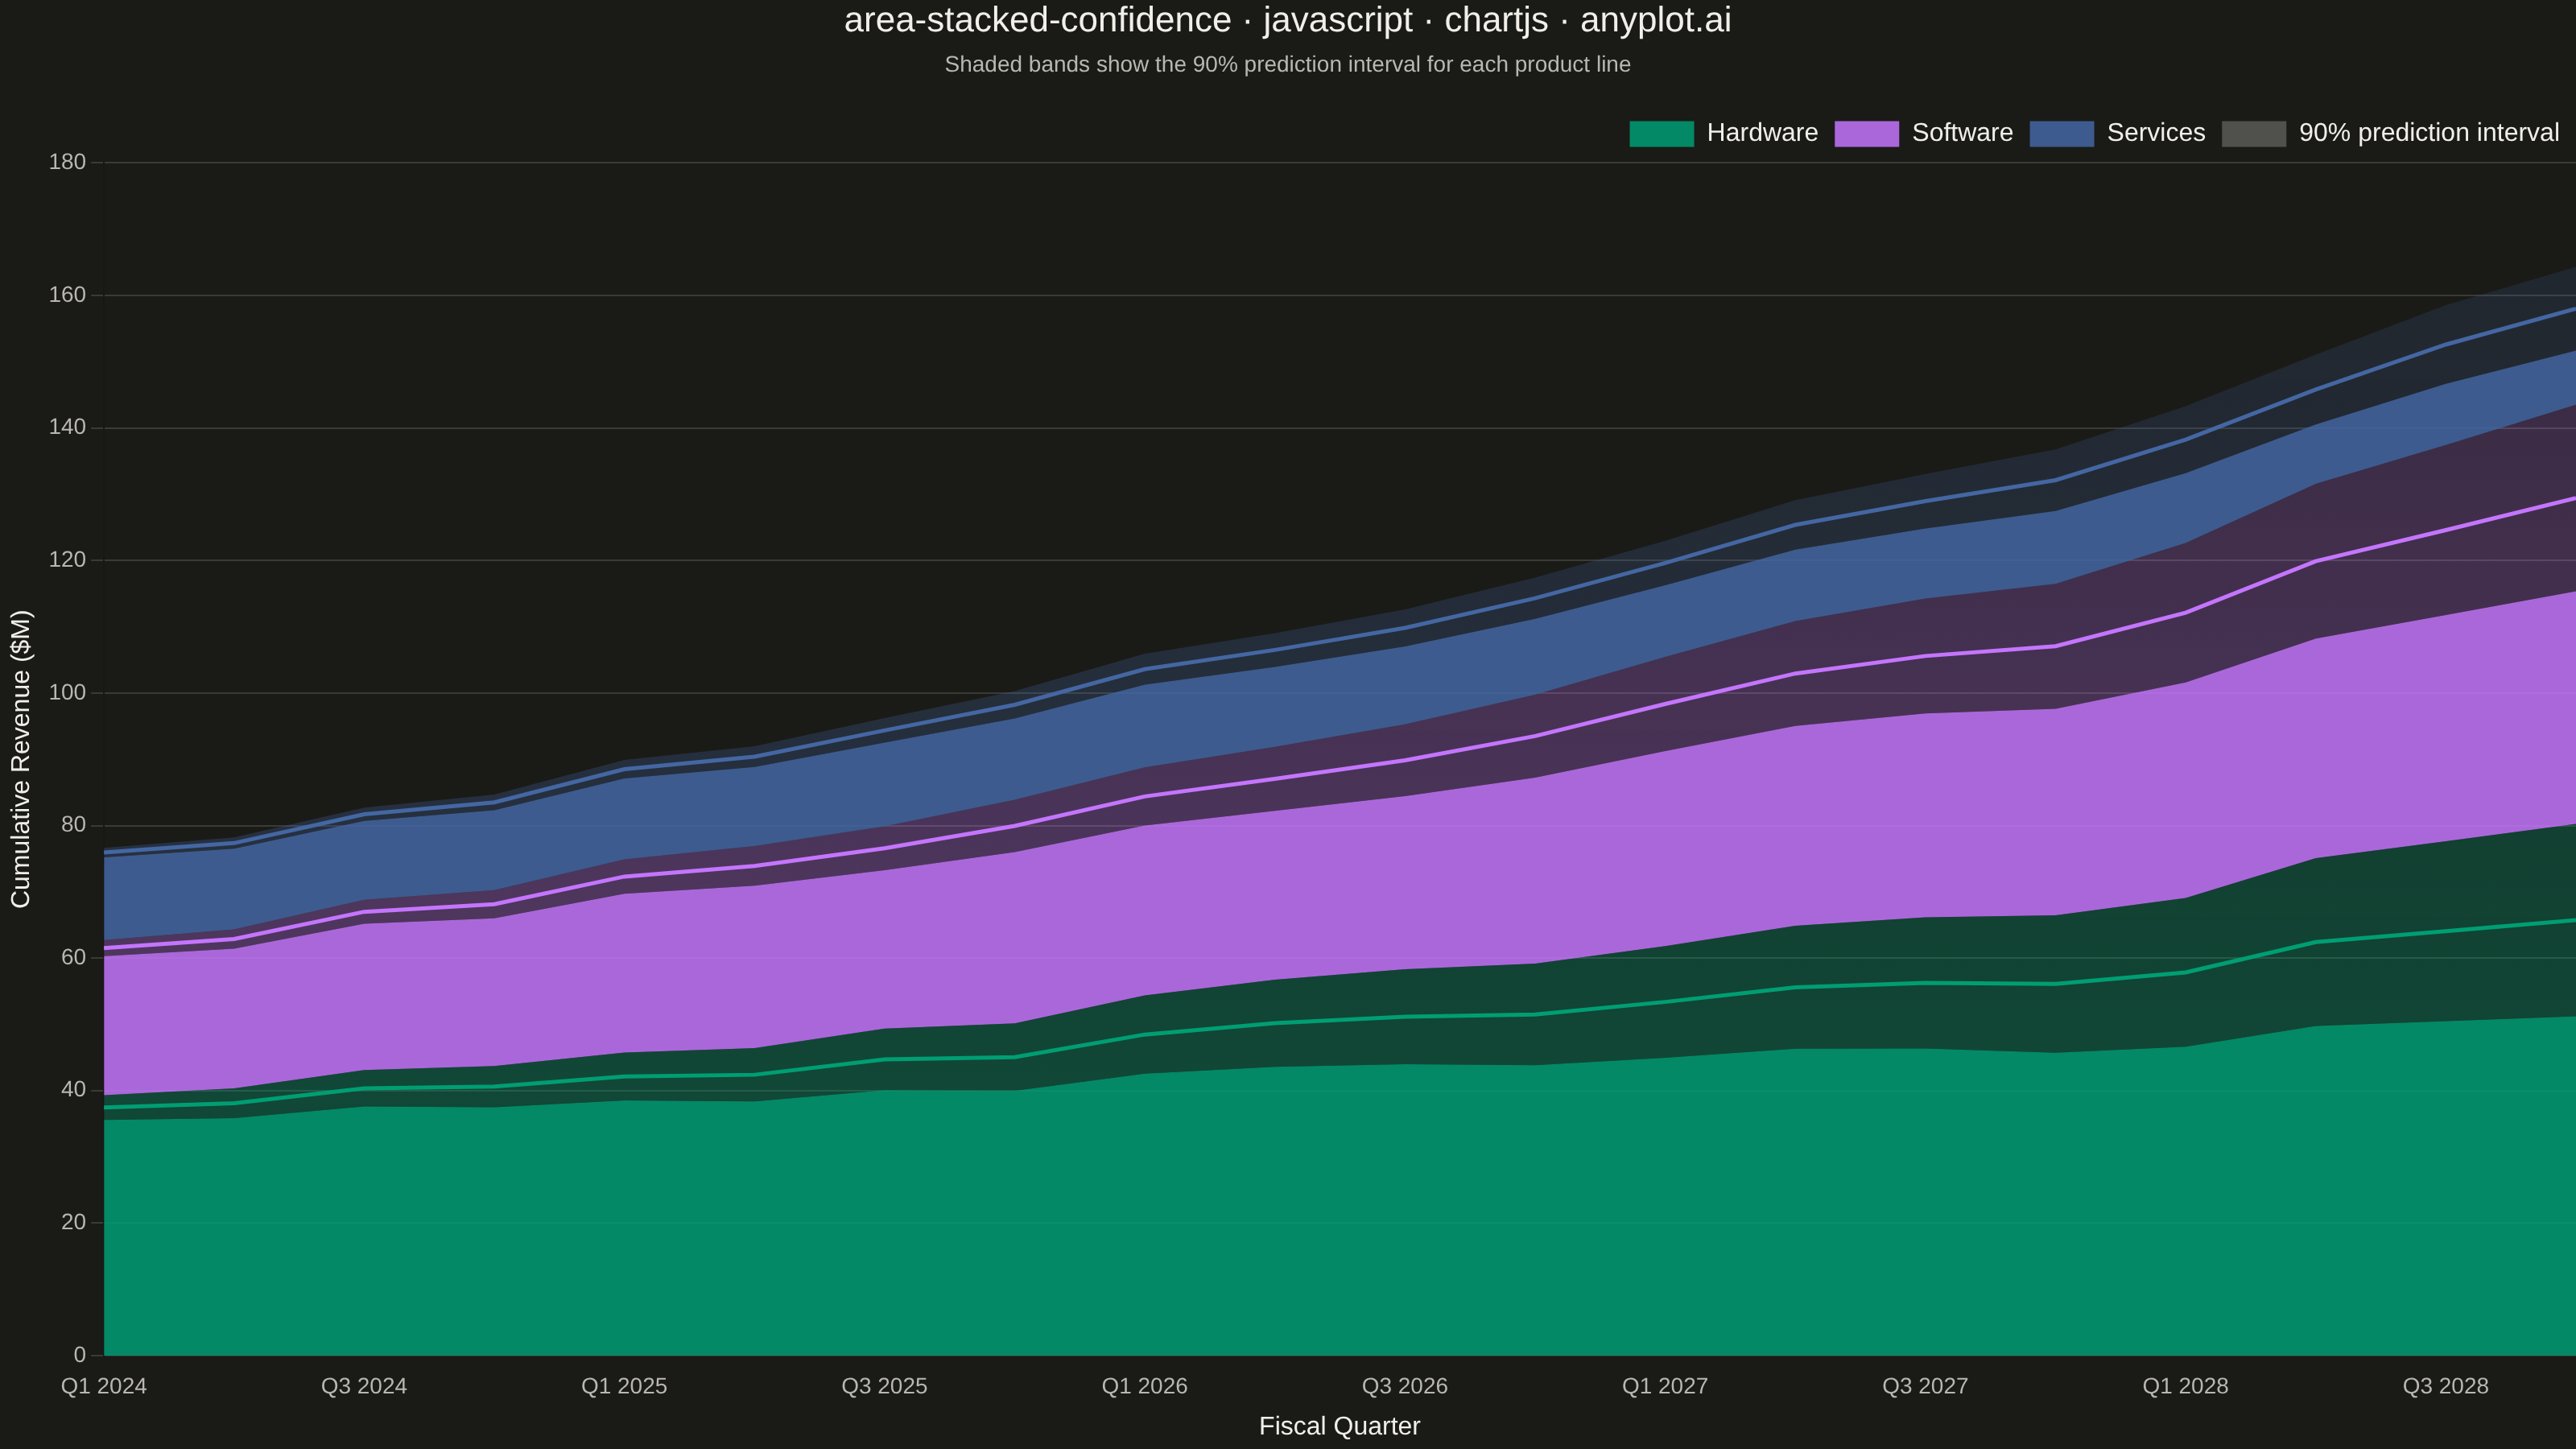
The same plot in 14 other libraries — JavaScript: D3.js, Apache ECharts, Highcharts, MUI X Charts; Python: Altair, Bokeh, lets-plot, Matplotlib, Plotly, plotnine, Pygal, Seaborn; R: ggplot2; Julia: Makie.jl. Compare all 15 side by side: Stacked Area Chart with Confidence Bands in Python, R, Julia and JavaScript.
A stacked area chart that displays multiple data series as cumulative areas, with each series surrounded by uncertainty or confidence bands. This visualization combines the composition insight of stacked areas with the statistical rigor of confidence intervals, making it ideal for showing how parts contribute to a whole while simultaneously communicating uncertainty in each component. The bands reveal where estimates are precise versus uncertain across the stacked series.
// anyplot.ai
// area-stacked-confidence: Stacked Area Chart with Confidence Bands
// Library: chartjs 4.4.7 | JavaScript 22.23.2
// Quality: 93/100 | Created: 2026-08-26

//# anyplot-orientation: landscape
const t = window.ANYPLOT_TOKENS;

// --- Reproducible pseudo-randomness (browser has no seeded RNG) ------------
function lcg(seed) {
  let state = seed;
  return () => {
    state = (state * 1664525 + 1013904223) % 4294967296;
    return state / 4294967296;
  };
}
const rand = lcg(42);

function hexToRgba(hex, alpha) {
  const r = parseInt(hex.slice(1, 3), 16);
  const g = parseInt(hex.slice(3, 5), 16);
  const b = parseInt(hex.slice(5, 7), 16);
  return `rgba(${r}, ${g}, ${b}, ${alpha})`;
}

// --- Data: quarterly revenue forecast by product line, with 90% prediction
// intervals that widen further into the forecast horizon -------------------
const quarterCount = 20;
const labels = Array.from({ length: quarterCount }, (_, q) => {
  const year = 2024 + Math.floor(q / 4);
  const quarter = (q % 4) + 1;
  return `Q${quarter} ${year}`;
});

const productLines = [
  { name: "Hardware", base: 38, growth: 0.028 },
  { name: "Software", base: 24, growth: 0.052 },
  { name: "Services", base: 14, growth: 0.038 },
];

// Central forecast values per product line, with mild multiplicative noise.
const centralValues = productLines.map((line) =>
  Array.from({ length: quarterCount }, (_, q) => {
    const trend = line.base * Math.pow(1 + line.growth, q);
    const noise = 1 + (rand() - 0.5) * 0.06;
    return trend * noise;
  })
);

// Prediction-interval half-width grows with forecast horizon (more
// uncertainty further out) and scales with the series' own magnitude.
const bandHalfWidths = centralValues.map((series) =>
  series.map((value, q) => value * (0.05 + 0.009 * q))
);

// Stack the central values, then carry the same cumulative base into each
// series' band so bounds stay consistent with the stack order (Notes).
const cumulativeBase = productLines.map(() => new Array(quarterCount).fill(0));
for (let q = 0; q < quarterCount; q += 1) {
  let running = 0;
  for (let i = 0; i < productLines.length; i += 1) {
    cumulativeBase[i][q] = running;
    running += centralValues[i][q];
  }
}

const cumulativeCentral = productLines.map((_, i) =>
  centralValues[i].map((value, q) => cumulativeBase[i][q] + value)
);
const cumulativeLower = productLines.map((_, i) =>
  centralValues[i].map((value, q) => cumulativeBase[i][q] + value - bandHalfWidths[i][q])
);
const cumulativeUpper = productLines.map((_, i) =>
  centralValues[i].map((value, q) => cumulativeBase[i][q] + value + bandHalfWidths[i][q])
);

// --- Mount -------------------------------------------------------------
const canvas = document.createElement("canvas");
document.getElementById("container").appendChild(canvas);

// A vertical gradient (per spec: "gradient fills from lower to upper bound")
// so each band tapers instead of reading as one flat alpha.
function bandGradient(hex) {
  return (ctx) => {
    const { chartArea, ctx: canvasCtx } = ctx.chart;
    if (!chartArea) return hexToRgba(hex, 0.3);
    const gradient = canvasCtx.createLinearGradient(0, chartArea.top, 0, chartArea.bottom);
    gradient.addColorStop(0, hexToRgba(hex, 0.15));
    gradient.addColorStop(1, hexToRgba(hex, 0.4));
    return gradient;
  };
}

// --- Datasets: each series is a solid "confident" slice from the previous
// series' band top up to this series' own lower bound, topped by a translucent
// band from lower to upper bound. Because the solid slice stops exactly where
// the band starts (and the next series' solid slice starts exactly where this
// band ends), the bands never bleed into a neighboring series' stacked region.
// The central value is kept as a plain border line on top for the visible
// stack boundary. ------------------------------------------------------------
const datasets = [];
let prevBandTop = "origin";

productLines.forEach((line, i) => {
  const solidIndex = datasets.length;
  datasets.push({
    label: line.name,
    data: cumulativeLower[i],
    borderWidth: 0,
    pointRadius: 0,
    backgroundColor: hexToRgba(t.palette[i], 0.85),
    fill: prevBandTop,
    isBand: false,
  });

  datasets.push({
    label: `${line.name} central`,
    data: cumulativeCentral[i],
    borderColor: t.palette[i],
    borderWidth: 2.5,
    pointRadius: 0,
    tension: 0,
    fill: false,
    isBand: true,
  });

  const bandTopIndex = datasets.length;
  datasets.push({
    label: `${line.name} interval`,
    data: cumulativeUpper[i],
    borderWidth: 0,
    pointRadius: 0,
    backgroundColor: bandGradient(t.palette[i]),
    fill: solidIndex,
    isBand: true,
  });

  prevBandTop = bandTopIndex;
});

// Legend-only entry so the bands' meaning doesn't rely solely on the subtitle.
datasets.push({
  label: "90% prediction interval",
  data: [],
  borderWidth: 0,
  pointRadius: 0,
  backgroundColor: hexToRgba(t.inkSoft, 0.35),
  fill: false,
  isBand: false,
});

// --- Chart -------------------------------------------------------------
new Chart(canvas, {
  type: "line",
  data: {
    labels,
    datasets,
  },
  options: {
    responsive: true,
    maintainAspectRatio: false,
    animation: false,
    interaction: { intersect: false },
    plugins: {
      title: {
        display: true,
        text: "area-stacked-confidence · javascript · chartjs · anyplot.ai",
        color: t.ink,
        font: { size: 22, weight: "500" },
        padding: { bottom: 6 },
      },
      subtitle: {
        display: true,
        text: "Shaded bands show the 90% prediction interval for each product line",
        color: t.inkSoft,
        font: { size: 14 },
        padding: { bottom: 16 },
      },
      legend: {
        position: "top",
        align: "end",
        labels: {
          color: t.ink,
          font: { size: 16 },
          filter: (item, data) => !data.datasets[item.datasetIndex].isBand,
        },
      },
      tooltip: { enabled: false },
    },
    scales: {
      x: {
        ticks: { color: t.inkSoft, font: { size: 14 }, maxRotation: 0, autoSkip: true, maxTicksLimit: 10 },
        grid: { display: false },
        title: { display: true, text: "Fiscal Quarter", color: t.ink, font: { size: 16 } },
      },
      y: {
        beginAtZero: true,
        ticks: { color: t.inkSoft, font: { size: 14 } },
        grid: { color: t.grid },
        title: { display: true, text: "Cumulative Revenue ($M)", color: t.ink, font: { size: 16 } },
      },
    },
  },
});
Runnable source as JSON, for any HTTP client: https://api.anyplot.ai/specs/area-stacked-confidence/chartjs/code. Any spec id and library id listed in llms-full.txt fit the same URL shape; every URL below is complete and callable.
{
  "spec_id": "area-stacked-confidence",
  "language": "javascript",
  "library": "chartjs",
  "page": "https://anyplot.ai/area-stacked-confidence/javascript/chartjs",
  "hub": "https://anyplot.ai/area-stacked-confidence",
  "code_json": "https://api.anyplot.ai/specs/area-stacked-confidence/chartjs/code",
  "spec_json": "https://api.anyplot.ai/specs/area-stacked-confidence",
  "render_light_png": "https://storage.googleapis.com/anyplot-images/plots/area-stacked-confidence/javascript/chartjs/plot-light.png",
  "render_dark_png": "https://storage.googleapis.com/anyplot-images/plots/area-stacked-confidence/javascript/chartjs/plot-dark.png",
  "interactive_light_html": "https://storage.googleapis.com/anyplot-images/plots/area-stacked-confidence/javascript/chartjs/plot-light.html",
  "interactive_dark_html": "https://storage.googleapis.com/anyplot-images/plots/area-stacked-confidence/javascript/chartjs/plot-dark.html",
  "quality_score": 93.0,
  "license": "MIT",
  "guide": "https://anyplot.ai/llms.txt"
}
Part of Stacked Area Chart with Confidence Bands on anyplot.ai.