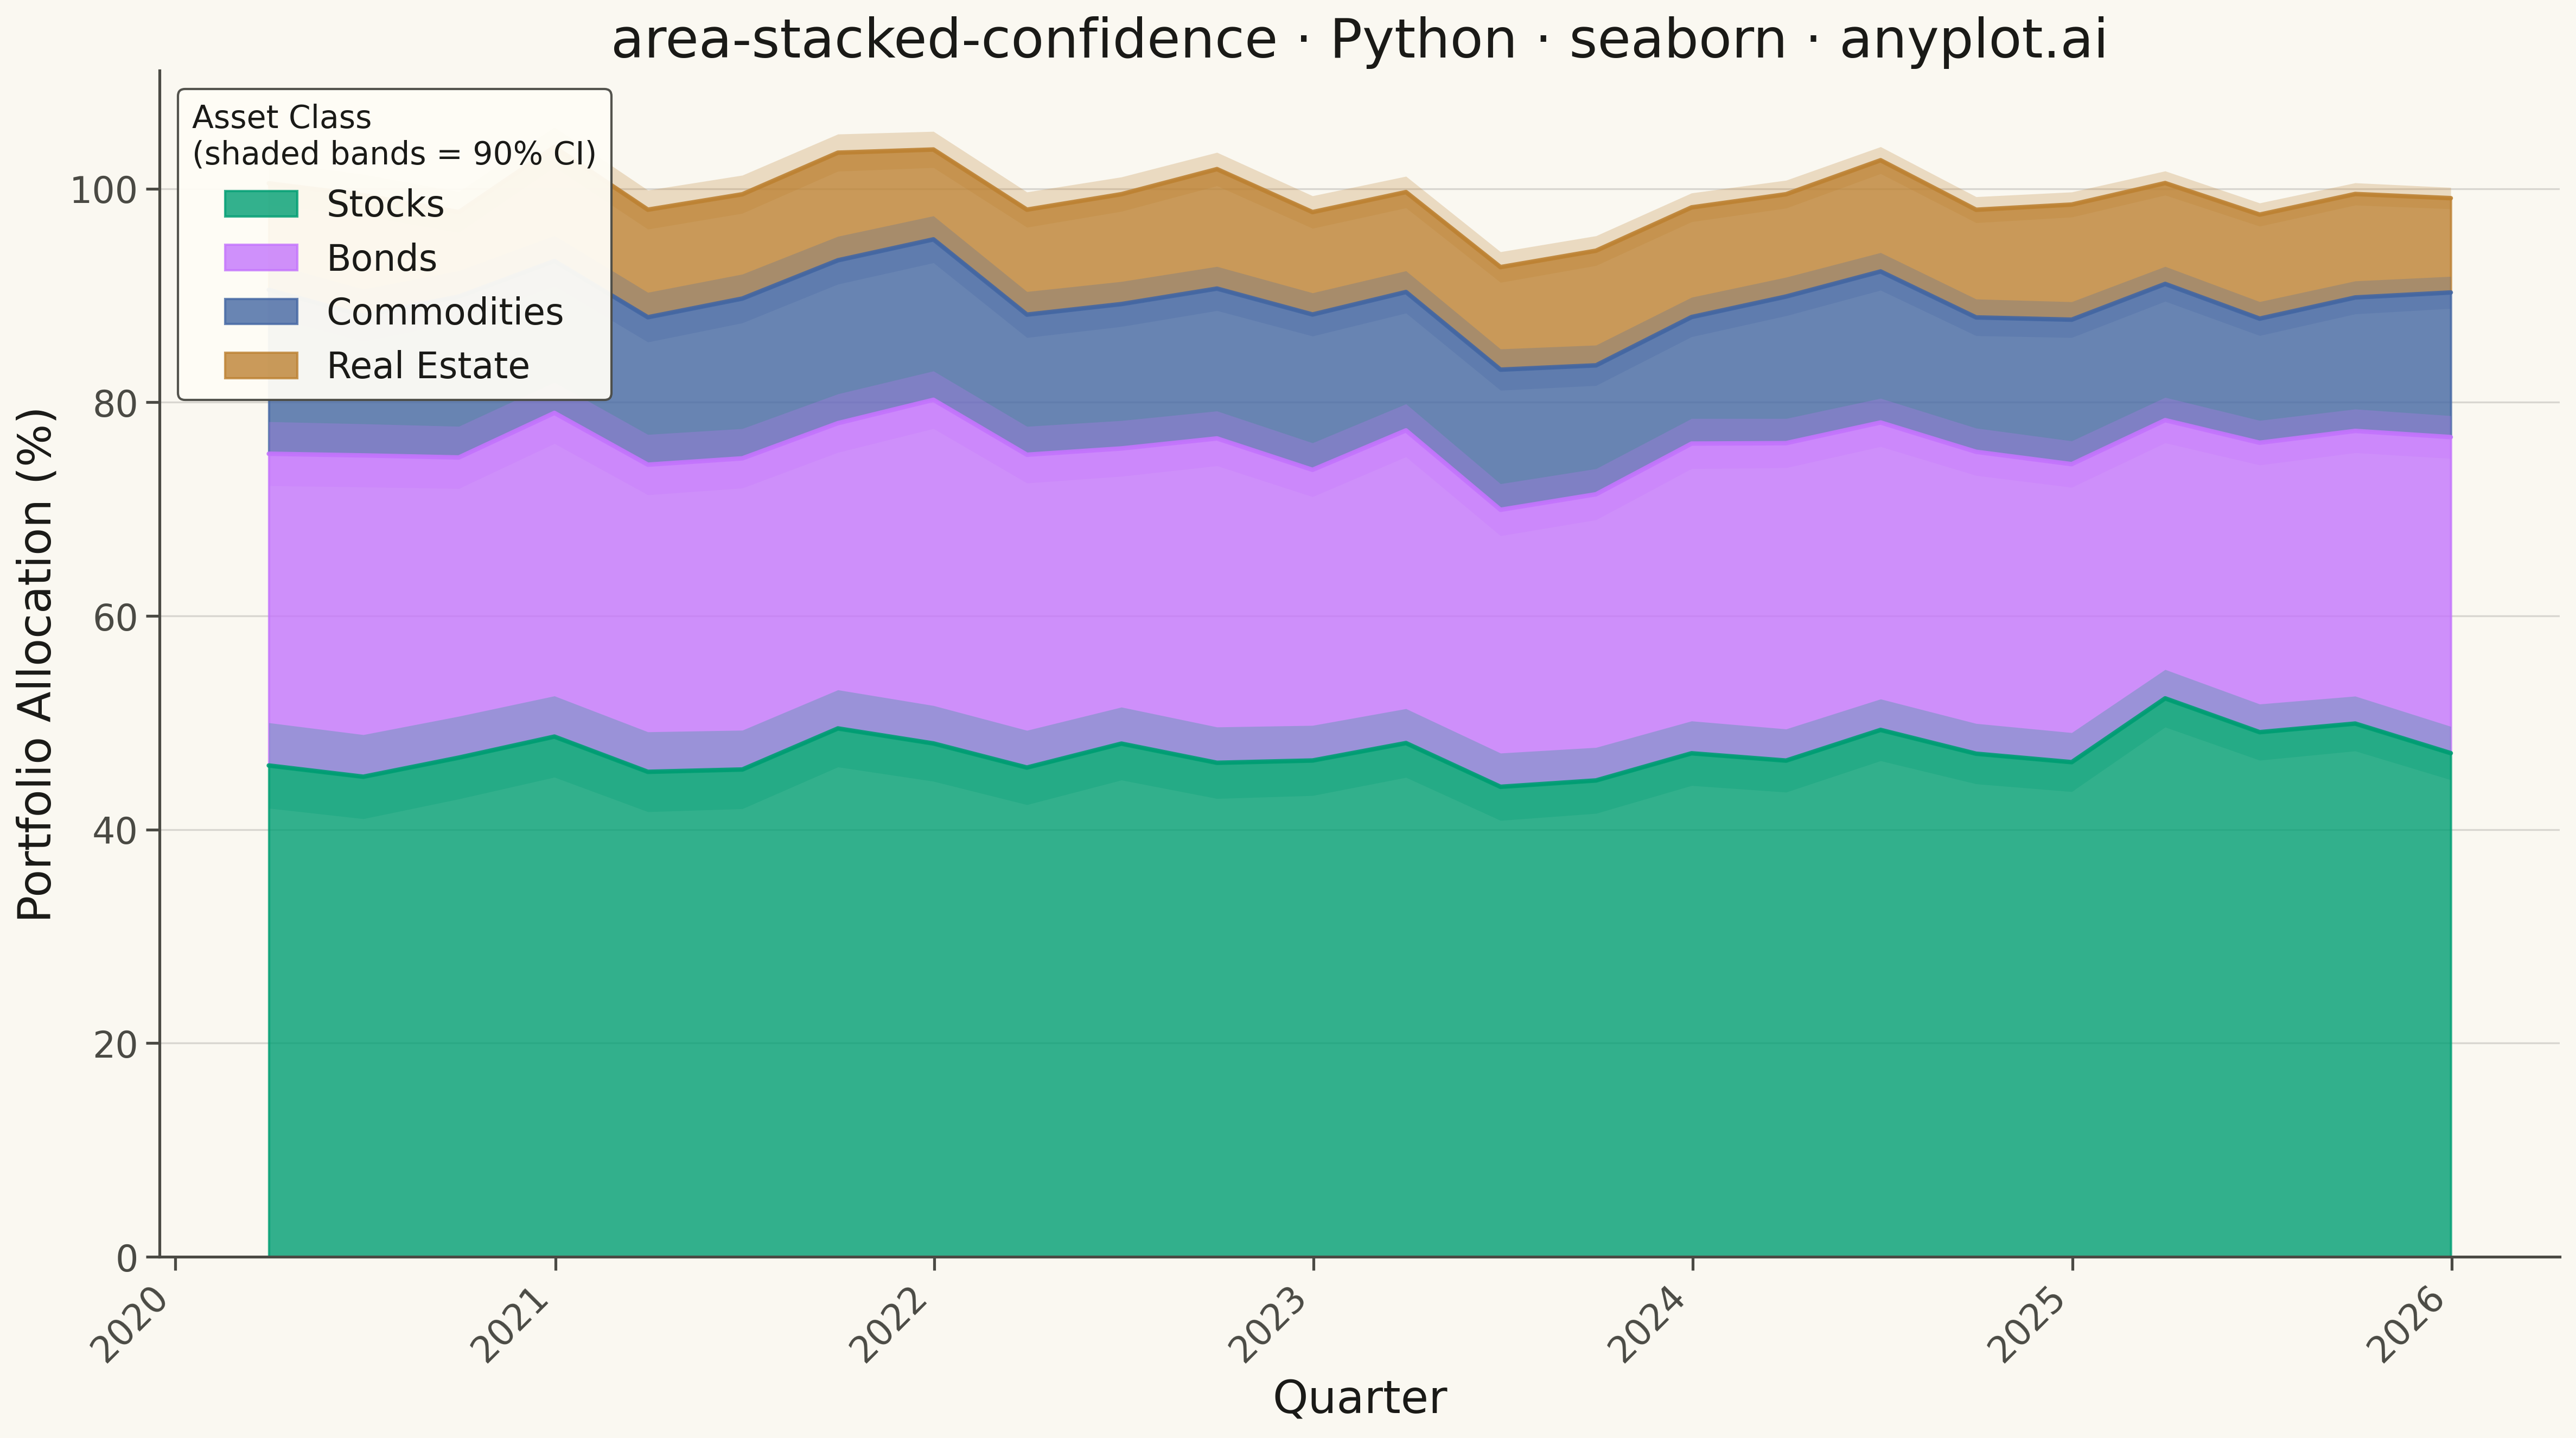
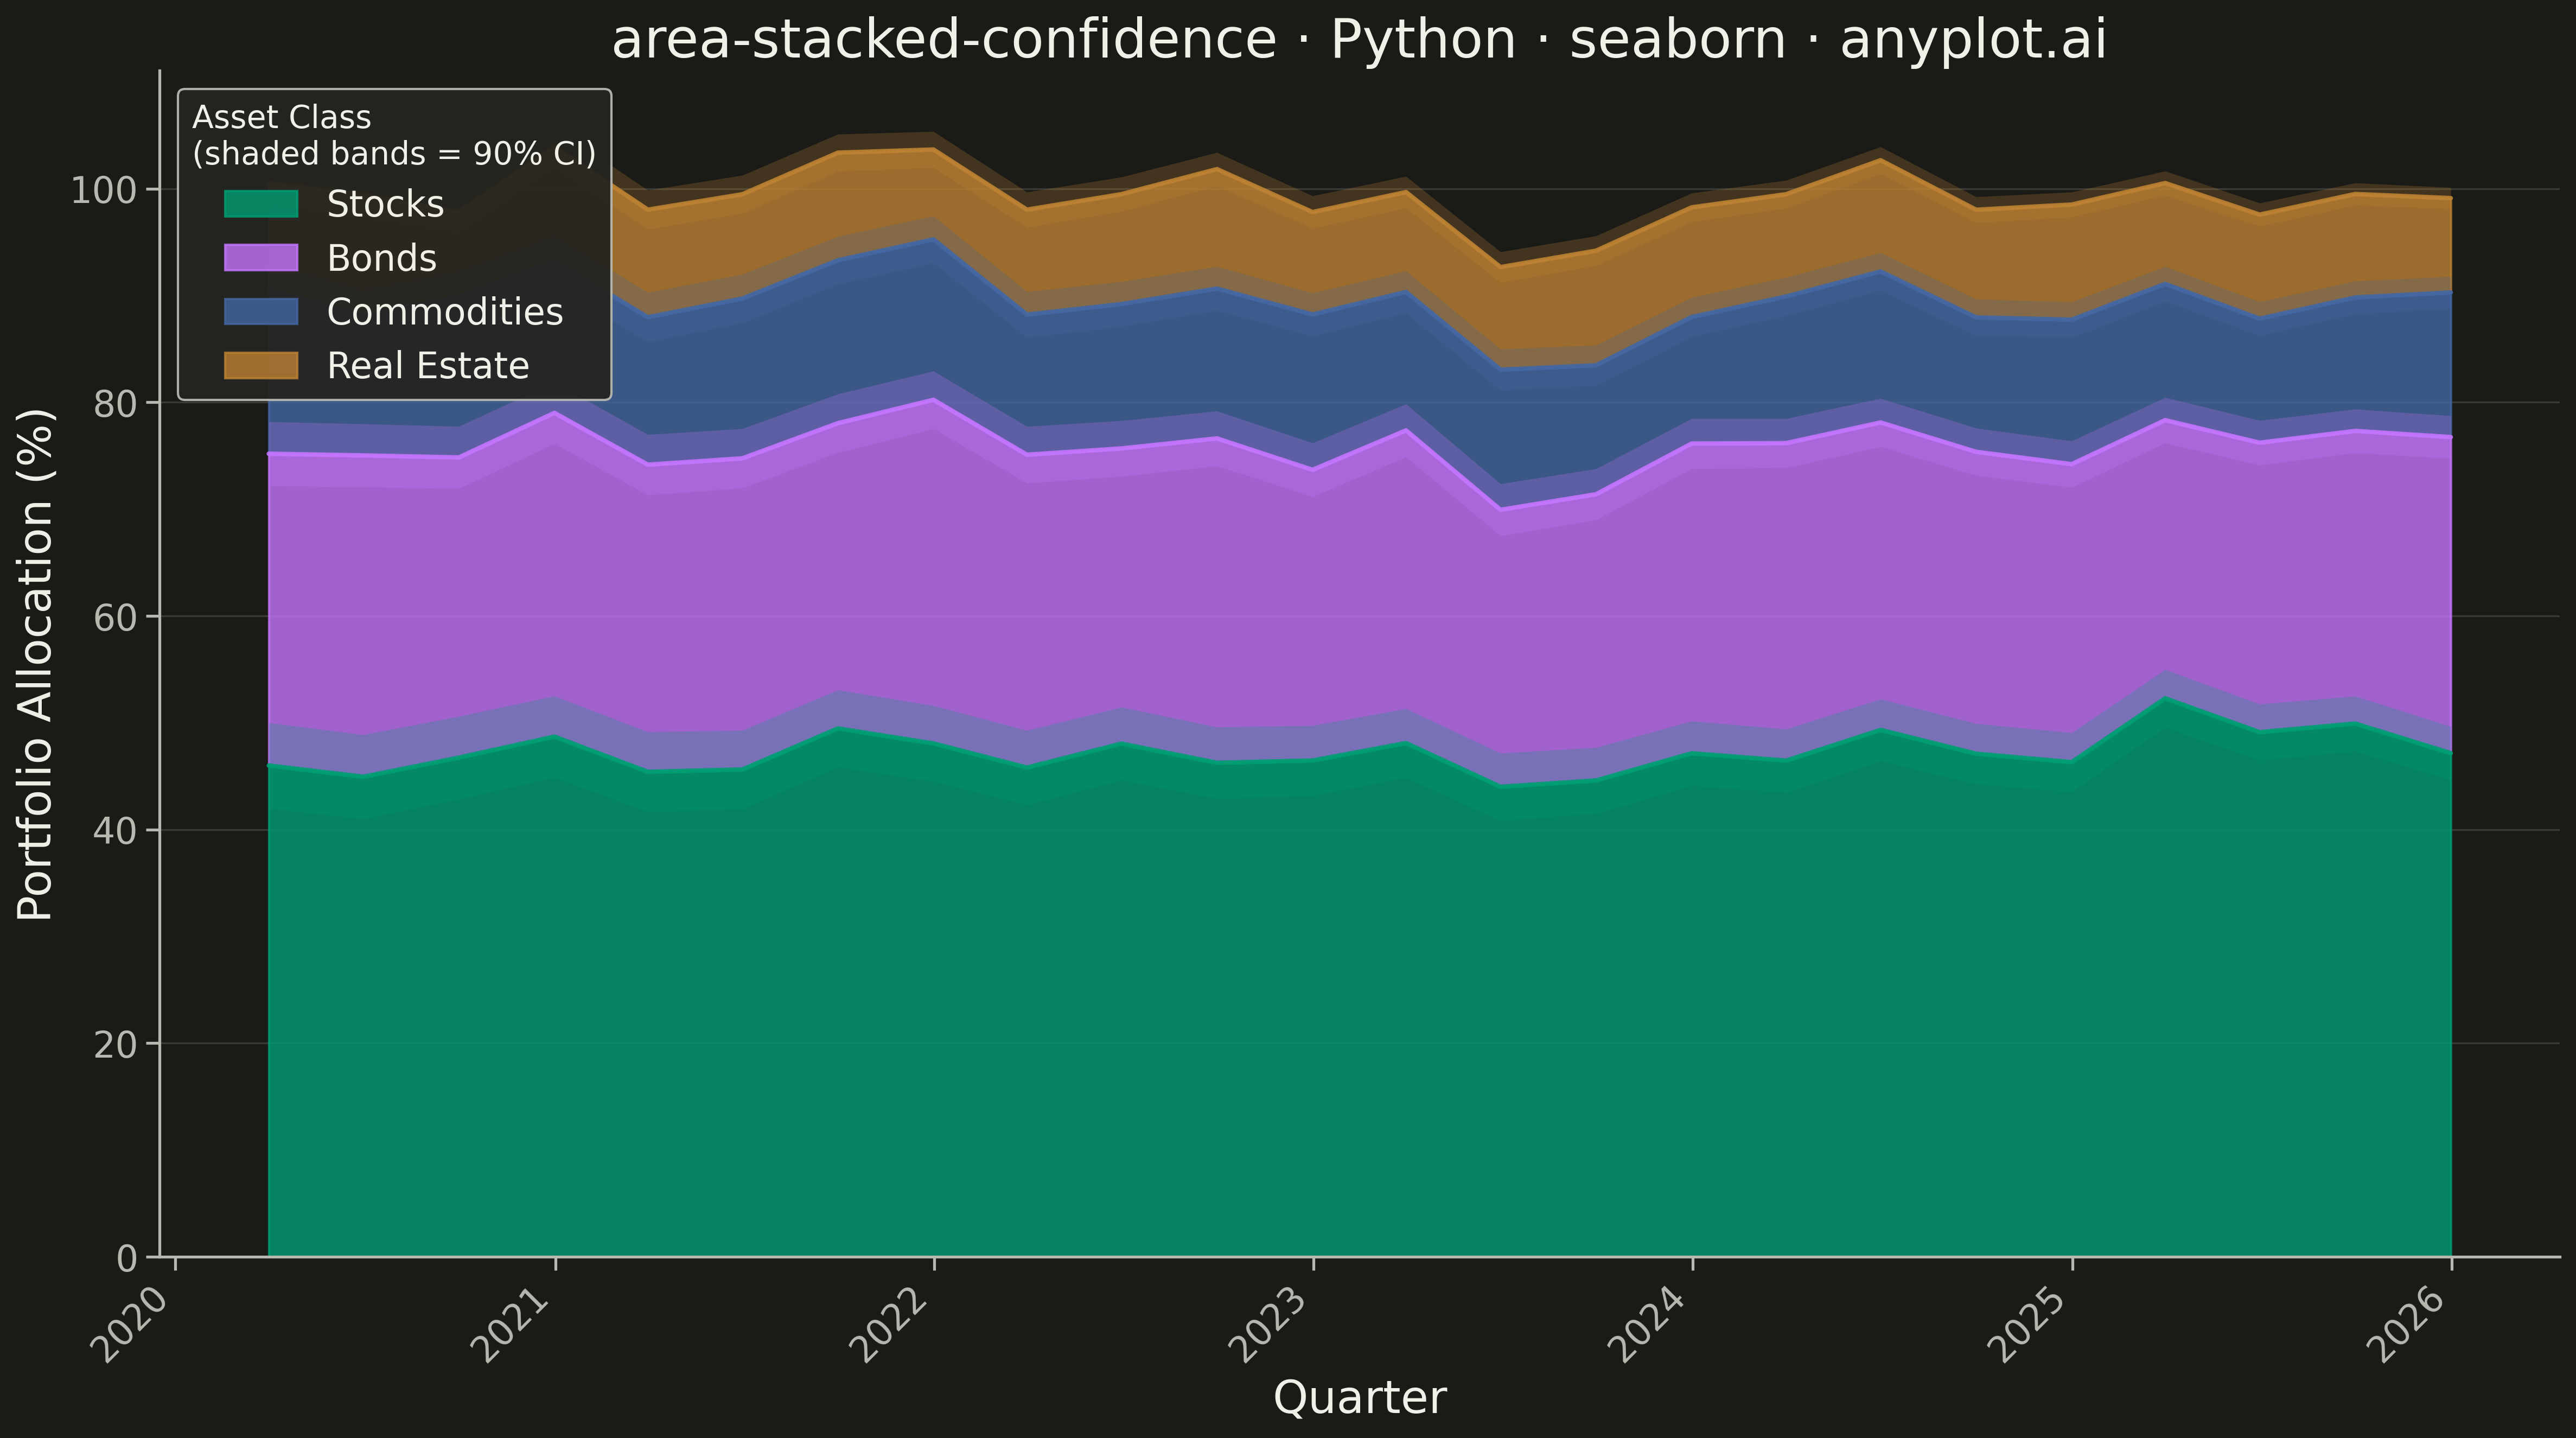
A stacked area chart that displays multiple data series as cumulative areas, with each series surrounded by uncertainty or confidence bands. This visualization combines the composition insight of stacked areas with the statistical rigor of confidence intervals, making it ideal for showing how parts contribute to a whole while simultaneously communicating uncertainty in each component. The bands reveal where estimates are precise versus uncertain across the stacked series.
""" anyplot.ai
area-stacked-confidence: Stacked Area Chart with Confidence Bands
Library: seaborn 0.13.2 | Python 3.13.13
Quality: 91/100 | Updated: 2026-05-18
"""

import os

import matplotlib.pyplot as plt
import numpy as np
import pandas as pd
import seaborn as sns


# Theme tokens
THEME = os.getenv("ANYPLOT_THEME", "light")
PAGE_BG = "#FAF8F1" if THEME == "light" else "#1A1A17"
ELEVATED_BG = "#FFFDF6" if THEME == "light" else "#242420"
INK = "#1A1A17" if THEME == "light" else "#F0EFE8"
INK_SOFT = "#4A4A44" if THEME == "light" else "#B8B7B0"

# Okabe-Ito palette - first series always #009E73
IMPRINT = ["#009E73", "#C475FD", "#4467A3", "#BD8233"]
COLORS = {"stocks": IMPRINT[0], "bonds": IMPRINT[1], "commodities": IMPRINT[2], "real_estate": IMPRINT[3]}

# Data - Portfolio allocation over 6 years with confidence bands
np.random.seed(42)

quarters = pd.date_range("2020-01-01", periods=24, freq="QE")
n = len(quarters)

# Base values for each asset class (in % of portfolio)
stocks_base = np.linspace(45, 50, n) + np.random.randn(n) * 2
bonds_base = np.linspace(30, 28, n) + np.random.randn(n) * 1.5
commodities_base = np.linspace(15, 12, n) + np.random.randn(n) * 1
real_estate_base = np.linspace(10, 10, n) + np.random.randn(n) * 0.8

# Uncertainty in allocation estimates (tighter in recent years)
stocks_uncertainty = np.linspace(4, 2.5, n)
bonds_uncertainty = np.linspace(3, 2, n)
commodities_uncertainty = np.linspace(2.5, 1.5, n)
real_estate_uncertainty = np.linspace(2, 1, n)

# Create cumulative stacks for central values (bottom to top: Stocks, Bonds, Commodities, Real Estate)
stocks_cumsum = stocks_base
bonds_cumsum = stocks_base + bonds_base
commodities_cumsum = stocks_base + bonds_base + commodities_base
real_estate_cumsum = stocks_base + bonds_base + commodities_base + real_estate_base

# Confidence bands for each layer (stacked properly)
# Stocks band (bottom layer)
stocks_lower = stocks_base - stocks_uncertainty
stocks_upper = stocks_base + stocks_uncertainty

# Bonds band (cumulative from stocks)
bonds_lower_cumsum = stocks_cumsum + (bonds_base - bonds_uncertainty)
bonds_upper_cumsum = stocks_cumsum + (bonds_base + bonds_uncertainty)

# Commodities band (cumulative from bonds)
commodities_lower_cumsum = bonds_cumsum + (commodities_base - commodities_uncertainty)
commodities_upper_cumsum = bonds_cumsum + (commodities_base + commodities_uncertainty)

# Real Estate band (cumulative from commodities)
real_estate_lower_cumsum = commodities_cumsum + (real_estate_base - real_estate_uncertainty)
real_estate_upper_cumsum = commodities_cumsum + (real_estate_base + real_estate_uncertainty)

# Set theme
sns.set_theme(
    style="ticks",
    rc={
        "figure.facecolor": PAGE_BG,
        "axes.facecolor": PAGE_BG,
        "axes.edgecolor": INK_SOFT,
        "axes.labelcolor": INK,
        "text.color": INK,
        "xtick.color": INK_SOFT,
        "ytick.color": INK_SOFT,
        "grid.color": INK,
        "grid.alpha": 0.10,
        "legend.facecolor": ELEVATED_BG,
        "legend.edgecolor": INK_SOFT,
    },
)

# Create plot
fig, ax = plt.subplots(figsize=(16, 9))

# Plot from top to bottom for proper layering (back to front)
# Real Estate confidence band (top layer, drawn first to be in background)
ax.fill_between(
    quarters, real_estate_lower_cumsum, real_estate_upper_cumsum, color=COLORS["real_estate"], alpha=0.25, linewidth=0
)

# Real Estate main area
ax.fill_between(
    quarters, commodities_cumsum, real_estate_cumsum, color=COLORS["real_estate"], alpha=0.8, label="Real Estate"
)

# Commodities confidence band
ax.fill_between(
    quarters, commodities_lower_cumsum, commodities_upper_cumsum, color=COLORS["commodities"], alpha=0.25, linewidth=0
)

# Commodities main area
ax.fill_between(quarters, bonds_cumsum, commodities_cumsum, color=COLORS["commodities"], alpha=0.8, label="Commodities")

# Bonds confidence band
ax.fill_between(quarters, bonds_lower_cumsum, bonds_upper_cumsum, color=COLORS["bonds"], alpha=0.25, linewidth=0)

# Bonds main area
ax.fill_between(quarters, stocks_cumsum, bonds_cumsum, color=COLORS["bonds"], alpha=0.8, label="Bonds")

# Stocks confidence band
ax.fill_between(quarters, stocks_lower, stocks_upper, color=COLORS["stocks"], alpha=0.25, linewidth=0)

# Stocks main area (bottom layer)
ax.fill_between(quarters, 0, stocks_cumsum, color=COLORS["stocks"], alpha=0.8, label="Stocks")

# Add lines for central values to show boundaries
ax.plot(quarters, stocks_cumsum, color=COLORS["stocks"], linewidth=2, alpha=0.9)
ax.plot(quarters, bonds_cumsum, color=COLORS["bonds"], linewidth=2, alpha=0.9)
ax.plot(quarters, commodities_cumsum, color=COLORS["commodities"], linewidth=2, alpha=0.9)
ax.plot(quarters, real_estate_cumsum, color=COLORS["real_estate"], linewidth=2, alpha=0.9)

# Styling
ax.set_xlabel("Quarter", fontsize=20, color=INK)
ax.set_ylabel("Portfolio Allocation (%)", fontsize=20, color=INK)
ax.set_title("area-stacked-confidence · Python · seaborn · anyplot.ai", fontsize=24, fontweight="medium", color=INK)
ax.tick_params(axis="both", labelsize=16, colors=INK_SOFT)

# Remove top and right spines
ax.spines["top"].set_visible(False)
ax.spines["right"].set_visible(False)
ax.spines["left"].set_color(INK_SOFT)
ax.spines["bottom"].set_color(INK_SOFT)

# Legend - reverse order so bottom layer is first in legend
handles, labels = ax.get_legend_handles_labels()
legend = ax.legend(
    handles[::-1],
    labels[::-1],
    loc="upper left",
    fontsize=16,
    title="Asset Class\n(shaded bands = 90% CI)",
    title_fontsize=14,
    framealpha=0.95,
    facecolor=ELEVATED_BG,
    edgecolor=INK_SOFT,
)
legend.get_title().set_color(INK)
for text in legend.get_texts():
    text.set_color(INK)

# Grid - y-axis only
ax.yaxis.grid(True, alpha=0.15, linewidth=0.8, color=INK)
ax.set_axisbelow(True)

# Format x-axis dates
fig.autofmt_xdate(rotation=45)

# Set y-axis to start at 0
ax.set_ylim(bottom=0)

plt.tight_layout()
plt.savefig(f"plot-{THEME}.png", dpi=300, bbox_inches="tight", facecolor=PAGE_BG)
Runnable source as JSON, for any HTTP client: https://api.anyplot.ai/specs/area-stacked-confidence/seaborn/code. Any spec id and library id listed in llms-full.txt fit the same URL shape; every URL below is complete and callable.
{
  "spec_id": "area-stacked-confidence",
  "language": "python",
  "library": "seaborn",
  "page": "https://anyplot.ai/area-stacked-confidence/python/seaborn",
  "hub": "https://anyplot.ai/area-stacked-confidence",
  "code_json": "https://api.anyplot.ai/specs/area-stacked-confidence/seaborn/code",
  "spec_json": "https://api.anyplot.ai/specs/area-stacked-confidence",
  "render_light_png": "https://storage.googleapis.com/anyplot-images/plots/area-stacked-confidence/python/seaborn/plot-light.png",
  "render_dark_png": "https://storage.googleapis.com/anyplot-images/plots/area-stacked-confidence/python/seaborn/plot-dark.png",
  "quality_score": 91.0,
  "license": "MIT",
  "guide": "https://anyplot.ai/llms.txt"
}
Part of Stacked Area Chart with Confidence Bands on anyplot.ai.