The same plot in 14 other libraries — JavaScript: D3.js, Apache ECharts, Highcharts, MUI X Charts; Python: Altair, Bokeh, lets-plot, Matplotlib, Plotly, plotnine, Pygal, Seaborn; R: ggplot2; Julia: Makie.jl. Compare all 15 side by side: Feature Importance Bar Chart in Python, R, Julia and JavaScript.
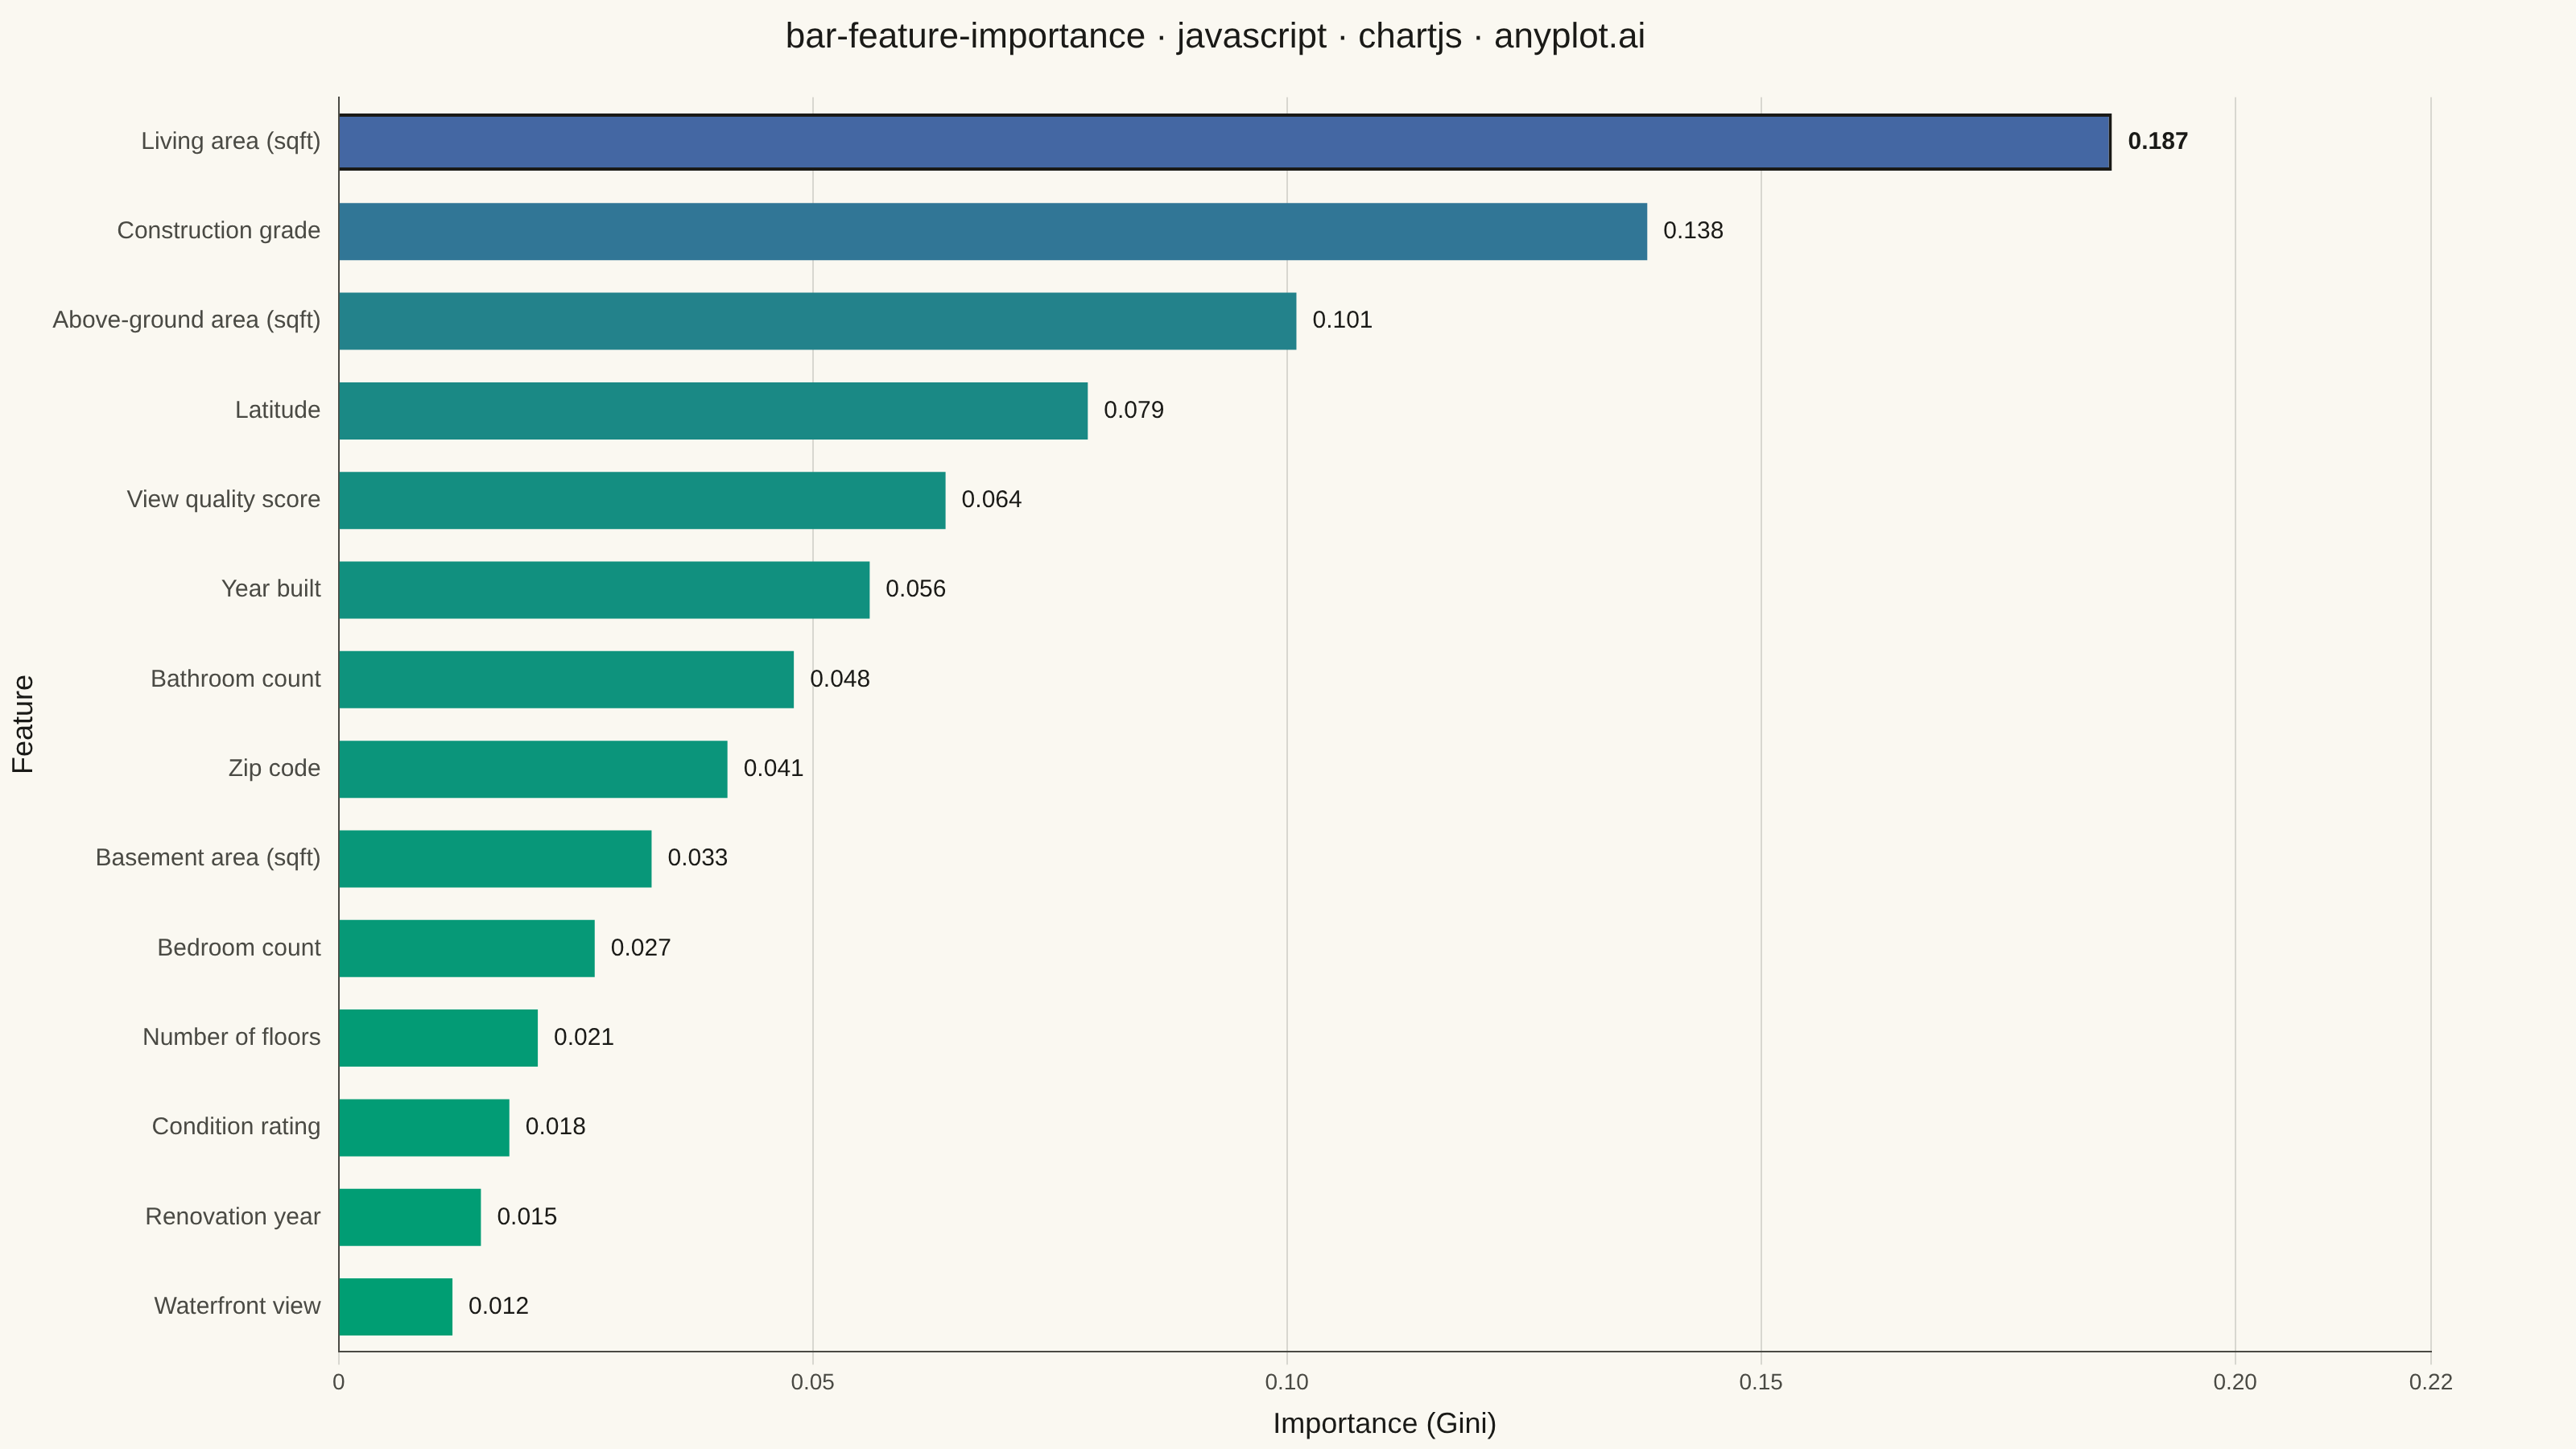
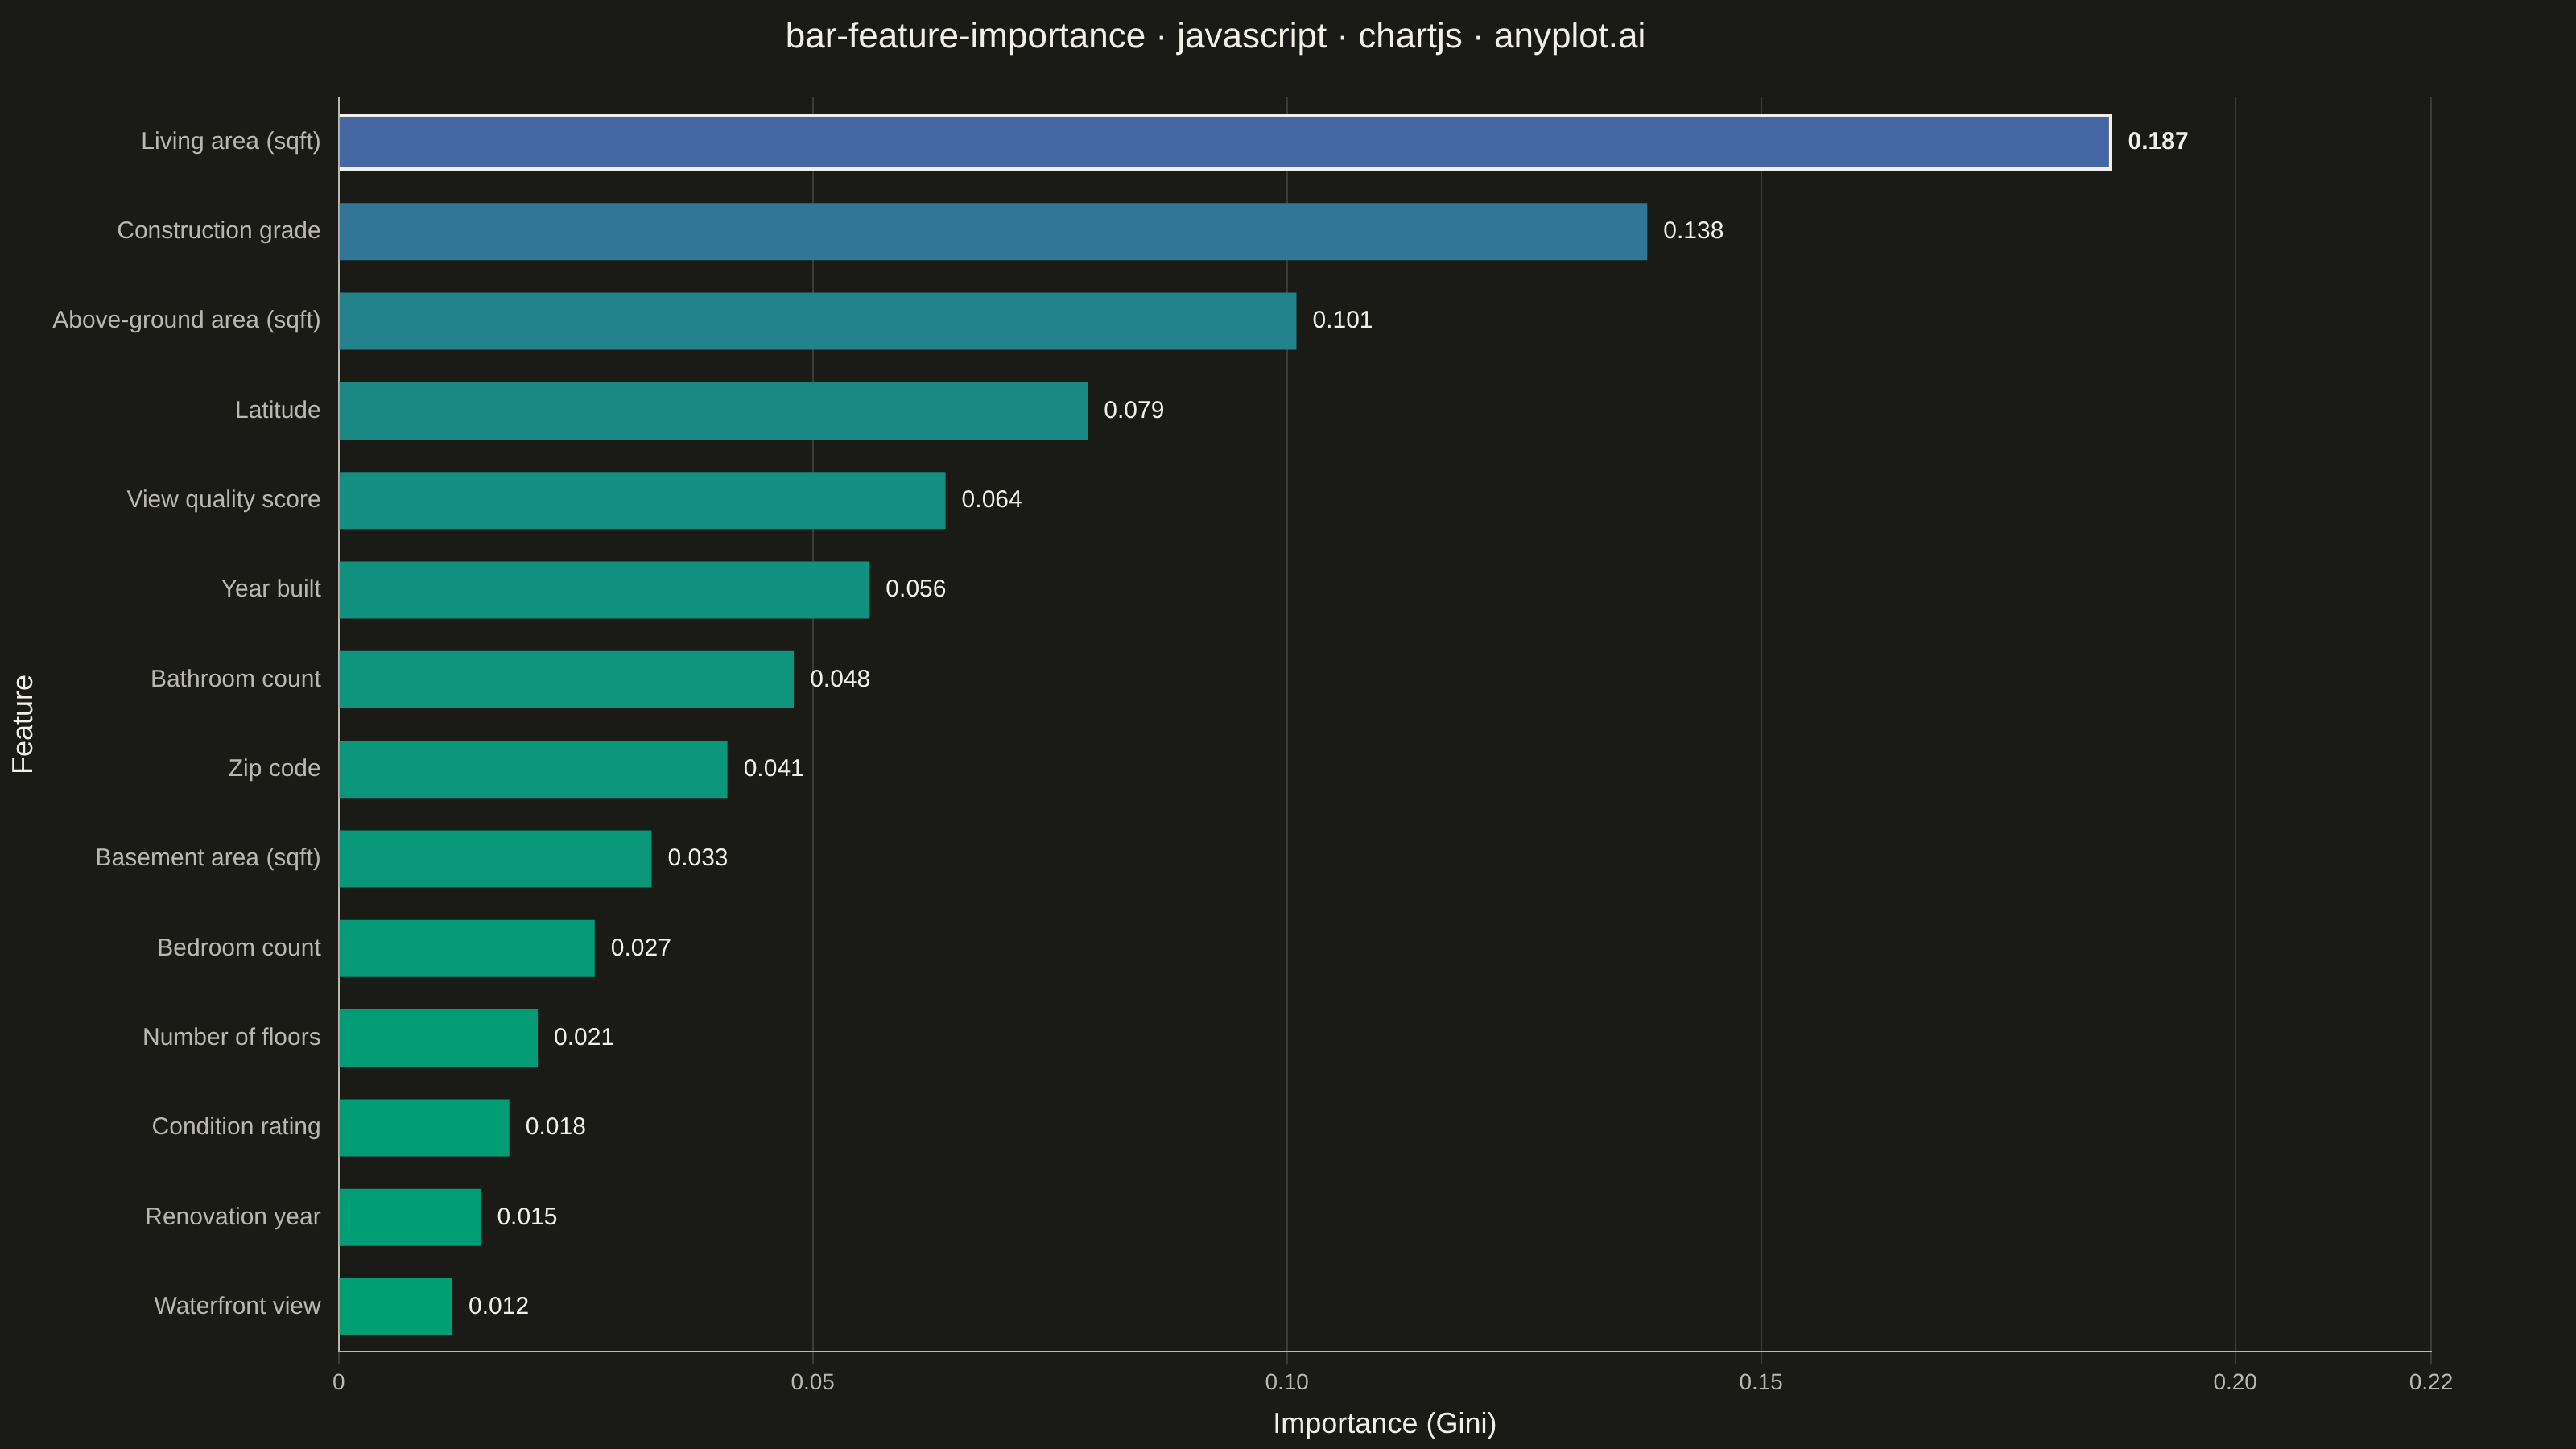
A horizontal bar chart displaying feature importances from machine learning models, with features sorted by importance value and bars colored by a gradient to emphasize relative contribution. This visualization is essential for model interpretability, helping data scientists and stakeholders understand which features drive model predictions. The horizontal orientation allows for readable feature names of varying lengths.
// anyplot.ai
// bar-feature-importance: Feature Importance Bar Chart
// Library: chartjs 4.4.7 | JavaScript 22.23.2
// Quality: 91/100 | Created: 2026-09-02

const t = window.ANYPLOT_TOKENS;

// --- Data (in-memory, deterministic) ----------------------------------------
// Feature importances from a gradient-boosted model predicting house sale
// price (King County-style housing data), sorted descending so the highest
// importance renders at the top -- Chart.js horizontal bars (indexAxis: "y")
// place labels[0] at the top by default.
const features = [
  { name: "Waterfront view", importance: 0.012 },
  { name: "Renovation year", importance: 0.015 },
  { name: "Condition rating", importance: 0.018 },
  { name: "Number of floors", importance: 0.021 },
  { name: "Bedroom count", importance: 0.027 },
  { name: "Basement area (sqft)", importance: 0.033 },
  { name: "Zip code", importance: 0.041 },
  { name: "Bathroom count", importance: 0.048 },
  { name: "Year built", importance: 0.056 },
  { name: "View quality score", importance: 0.064 },
  { name: "Latitude", importance: 0.079 },
  { name: "Above-ground area (sqft)", importance: 0.101 },
  { name: "Construction grade", importance: 0.138 },
  { name: "Living area (sqft)", importance: 0.187 },
].sort((a, b) => b.importance - a.importance);

const labels = features.map((f) => f.name);
const values = features.map((f) => f.importance);
const minValue = Math.min(...values);
const maxValue = Math.max(...values);

// --- Sequential gradient (Imprint imprint_seq) — low to high importance ----
function hexToRgb(hex) {
  const n = parseInt(hex.slice(1), 16);
  return [(n >> 16) & 255, (n >> 8) & 255, n & 255];
}
function lerpColor(hexLow, hexHigh, ratio) {
  const [r1, g1, b1] = hexToRgb(hexLow);
  const [r2, g2, b2] = hexToRgb(hexHigh);
  const r = Math.round(r1 + (r2 - r1) * ratio);
  const g = Math.round(g1 + (g2 - g1) * ratio);
  const b = Math.round(b1 + (b2 - b1) * ratio);
  return `rgb(${r}, ${g}, ${b})`;
}
const barColors = values.map((v) => {
  const ratio = (v - minValue) / (maxValue - minValue);
  return lerpColor(t.seq[0], t.seq[1], ratio);
});

// Subtle emphasis on the single most important feature (index 0, now at the
// top after the descending sort) to sharpen the "what matters most" story.
const borderWidths = values.map((_, i) => (i === 0 ? 2 : 0));
const borderColors = values.map((_, i) => (i === 0 ? t.ink : "transparent"));

// --- Value labels at bar end (native Chart.js plugin API, no external deps) -
const valueLabelsPlugin = {
  id: "valueLabels",
  afterDatasetsDraw(chart) {
    const { ctx } = chart;
    const meta = chart.getDatasetMeta(0);
    ctx.save();
    ctx.fillStyle = t.ink;
    ctx.textBaseline = "middle";
    ctx.textAlign = "left";
    meta.data.forEach((bar, i) => {
      ctx.font = i === 0 ? "700 15px sans-serif" : "500 15px sans-serif";
      ctx.fillText(values[i].toFixed(3), bar.x + 10, bar.y);
    });
    ctx.restore();
  },
};

// --- Mount -------------------------------------------------------------------
const canvas = document.createElement("canvas");
document.getElementById("container").appendChild(canvas);

// --- Chart ---------------------------------------------------------------
new Chart(canvas, {
  type: "bar",
  data: {
    labels,
    datasets: [
      {
        label: "Feature importance",
        data: values,
        backgroundColor: barColors,
        borderColor: borderColors,
        borderWidth: borderWidths,
        barPercentage: 0.75,
        categoryPercentage: 0.85,
      },
    ],
  },
  options: {
    indexAxis: "y",
    responsive: true,
    maintainAspectRatio: false,
    animation: false,
    layout: { padding: { right: 90, top: 10 } },
    plugins: {
      title: {
        display: true,
        text: "bar-feature-importance · javascript · chartjs · anyplot.ai",
        color: t.ink,
        font: { size: 22, weight: "500" },
        padding: { bottom: 24 },
      },
      legend: { display: false },
      tooltip: { enabled: false },
    },
    scales: {
      x: {
        beginAtZero: true,
        max: maxValue * 1.18,
        ticks: { color: t.inkSoft, font: { size: 14 } },
        grid: { color: t.grid },
        title: {
          display: true,
          text: "Importance (Gini)",
          color: t.ink,
          font: { size: 18 },
        },
        border: { color: t.inkSoft },
      },
      y: {
        ticks: { color: t.inkSoft, font: { size: 15 } },
        grid: { display: false },
        title: {
          display: true,
          text: "Feature",
          color: t.ink,
          font: { size: 18 },
        },
        border: { color: t.inkSoft },
      },
    },
  },
  plugins: [valueLabelsPlugin],
});
Runnable source as JSON, for any HTTP client: https://api.anyplot.ai/specs/bar-feature-importance/chartjs/code. Any spec id and library id listed in llms-full.txt fit the same URL shape; every URL below is complete and callable.
{
  "spec_id": "bar-feature-importance",
  "language": "javascript",
  "library": "chartjs",
  "page": "https://anyplot.ai/bar-feature-importance/javascript/chartjs",
  "hub": "https://anyplot.ai/bar-feature-importance",
  "code_json": "https://api.anyplot.ai/specs/bar-feature-importance/chartjs/code",
  "spec_json": "https://api.anyplot.ai/specs/bar-feature-importance",
  "render_light_png": "https://storage.googleapis.com/anyplot-images/plots/bar-feature-importance/javascript/chartjs/plot-light.png",
  "render_dark_png": "https://storage.googleapis.com/anyplot-images/plots/bar-feature-importance/javascript/chartjs/plot-dark.png",
  "interactive_light_html": "https://storage.googleapis.com/anyplot-images/plots/bar-feature-importance/javascript/chartjs/plot-light.html",
  "interactive_dark_html": "https://storage.googleapis.com/anyplot-images/plots/bar-feature-importance/javascript/chartjs/plot-dark.html",
  "quality_score": 91.0,
  "license": "MIT",
  "guide": "https://anyplot.ai/llms.txt"
}
Part of Feature Importance Bar Chart on anyplot.ai.