The same plot in 14 other libraries — JavaScript: Chart.js, D3.js, Apache ECharts, Highcharts; Python: Altair, Bokeh, lets-plot, Matplotlib, Plotly, plotnine, Pygal, Seaborn; R: ggplot2; Julia: Makie.jl. Compare all 15 side by side: Feature Importance Bar Chart in Python, R, Julia and JavaScript.
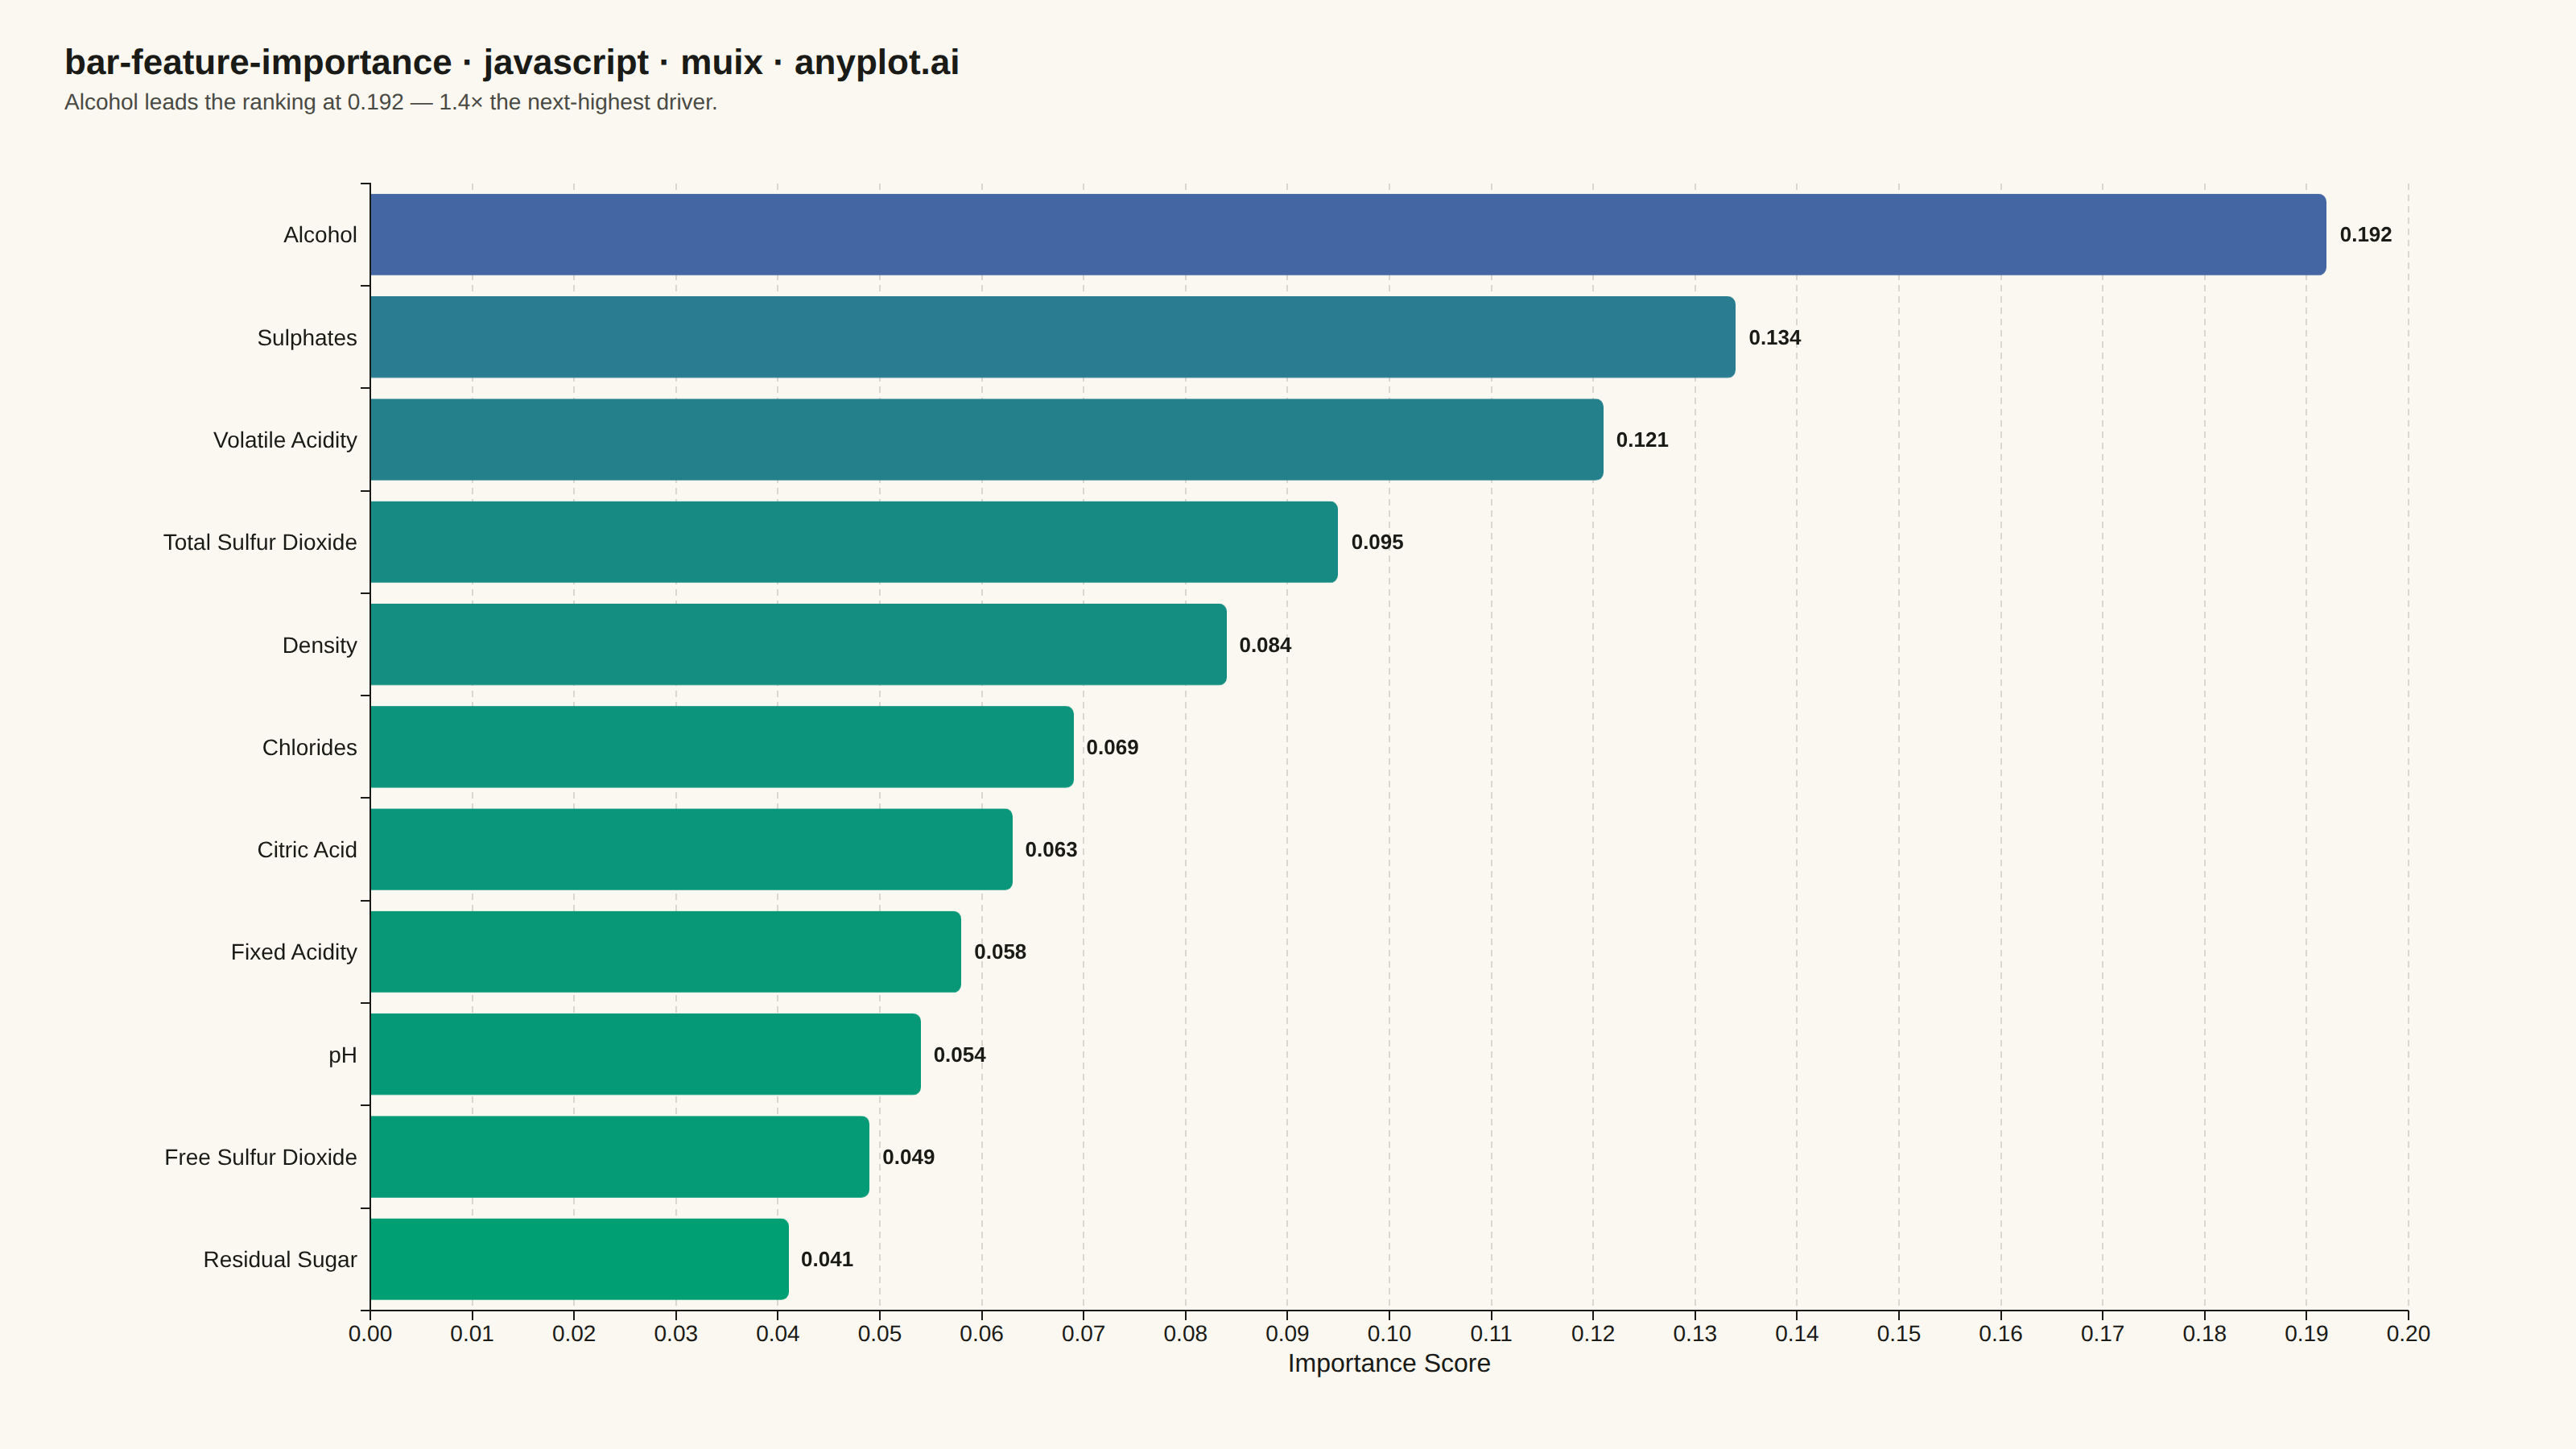
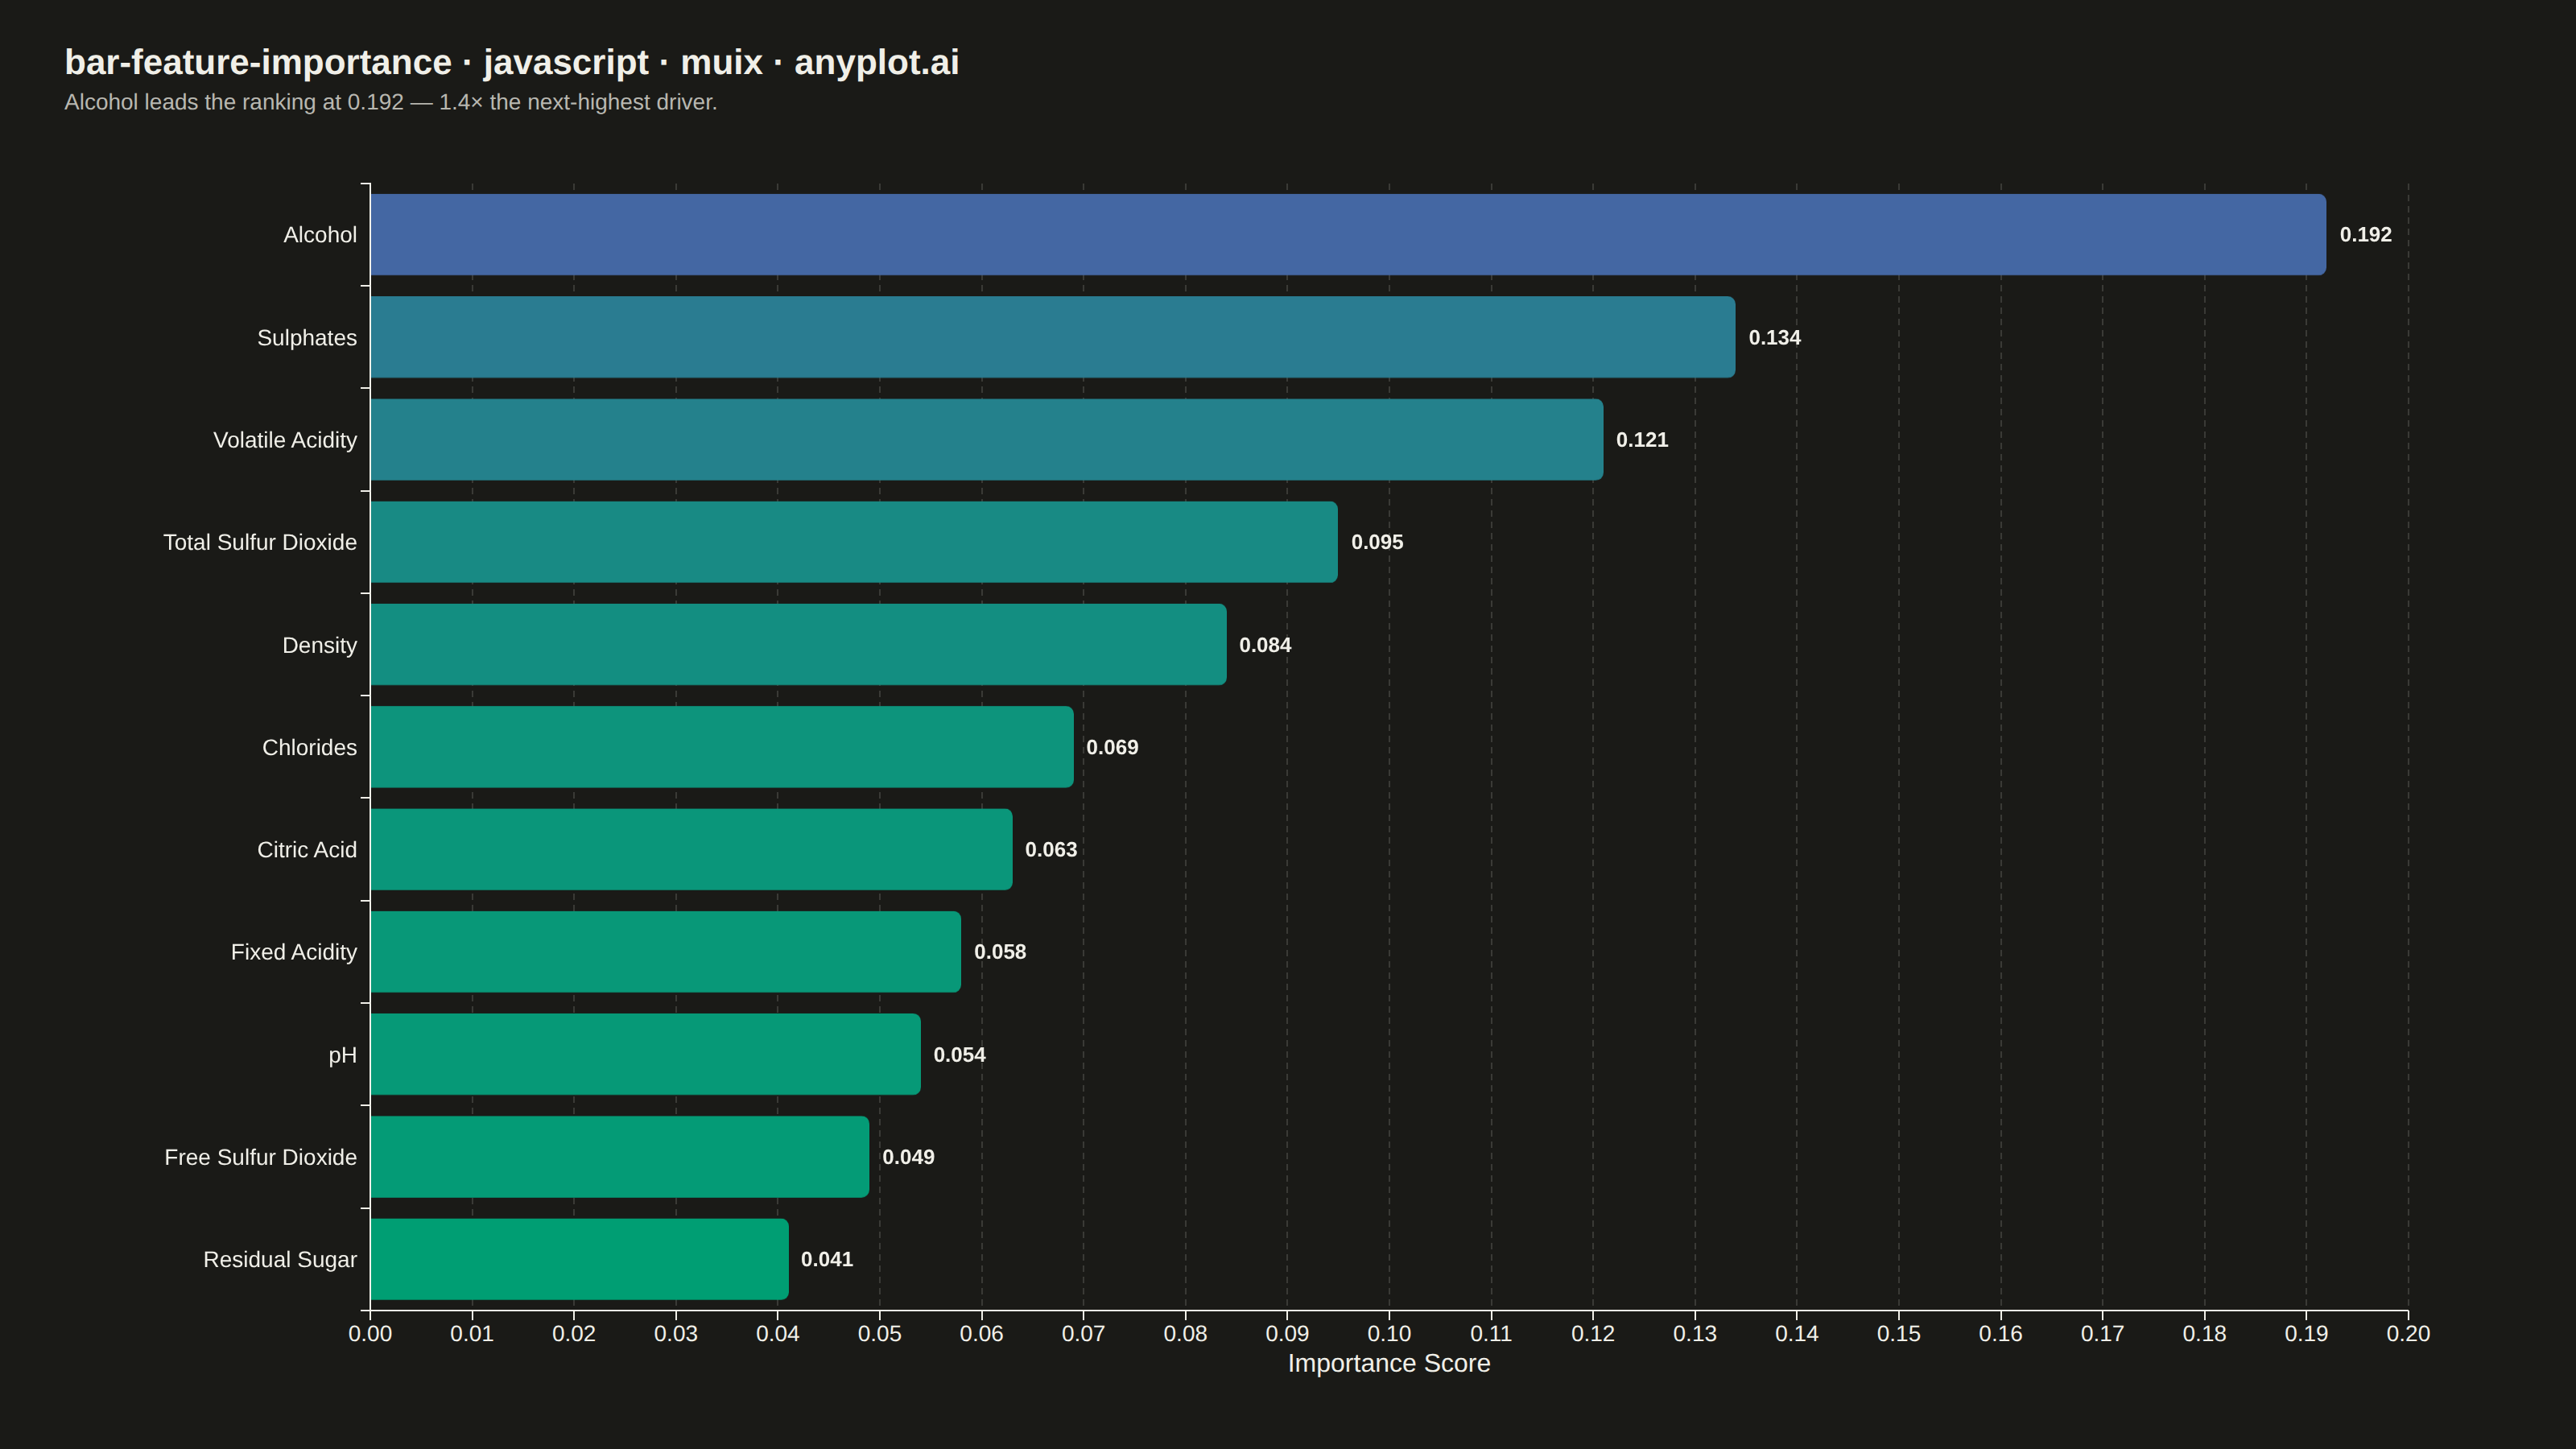
A horizontal bar chart displaying feature importances from machine learning models, with features sorted by importance value and bars colored by a gradient to emphasize relative contribution. This visualization is essential for model interpretability, helping data scientists and stakeholders understand which features drive model predictions. The horizontal orientation allows for readable feature names of varying lengths.
// anyplot.ai
// bar-feature-importance: Feature Importance Bar Chart
// Library: muix 7.29.1 | JavaScript 22.23.2
// Quality: 93/100 | Created: 2026-09-02
import { BarChart } from "@mui/x-charts/BarChart";
import { useDrawingArea, useXScale, useYScale } from "@mui/x-charts/hooks";
import { Box, Typography } from "@mui/material";

const t = window.ANYPLOT_TOKENS;

// --- Data (in-memory, deterministic) ----------------------------------------
// Feature importances from a random forest regressor predicting wine quality
// (UCI Wine Quality dataset), sorted descending so the most influential
// feature renders first.
const features = [
  "Alcohol",
  "Sulphates",
  "Volatile Acidity",
  "Total Sulfur Dioxide",
  "Density",
  "Chlorides",
  "Citric Acid",
  "Fixed Acidity",
  "pH",
  "Free Sulfur Dioxide",
  "Residual Sugar",
];
const importance = [0.192, 0.134, 0.121, 0.095, 0.084, 0.069, 0.063, 0.058, 0.054, 0.049, 0.041];

const TITLE = "bar-feature-importance · javascript · muix · anyplot.ai";
const LEAD_RATIO = (importance[0] / importance[1]).toFixed(1);
const CALLOUT = `${features[0]} leads the ranking at ${importance[0].toFixed(3)} — ${LEAD_RATIO}× the next-highest driver.`;

// Right-aligns the value just past each bar's tip (reading the real x/y
// scales rather than the animated bar geometry, which still reports its
// pre-mount "from" position during this synchronous render pass), falling
// back to an inside-end placement when the bar runs close to the axis max
// so the label never clips the canvas edge (spec asks for "text
// annotations at the end of bars").
function EndBarLabel({ dataIndex, className, children }) {
  const xScale = useXScale();
  const yScale = useYScale();
  const drawingArea = useDrawingArea();
  const value = importance[dataIndex];
  if (value == null || !children) {
    return null;
  }
  const barEnd = xScale(value);
  const rowCenter = yScale(features[dataIndex]) + yScale.bandwidth() / 2;
  const canvasRight = drawingArea.left + drawingArea.width + drawingArea.right;
  const pad = 8;
  const estimatedTextWidth = String(children).length * 9;
  const fitsOutside = barEnd + pad + estimatedTextWidth <= canvasRight - 6;
  return (
    <text
      x={fitsOutside ? barEnd + pad : barEnd - pad}
      y={rowCenter}
      textAnchor={fitsOutside ? "start" : "end"}
      dominantBaseline="central"
      className={className}
      style={{ fontSize: 13, fontWeight: 700, fill: t.ink }}
    >
      {children}
    </text>
  );
}

// --- Chart (default-exported component — the harness mounts it) ------------
export default function Chart() {
  const size = window.ANYPLOT_SIZE;
  const padding = { top: 28, right: 40, bottom: 24, left: 40 };
  const titleBlockHeight = 76;
  const chartWidth = size.width - padding.left - padding.right;
  const chartHeight = size.height - padding.top - padding.bottom - titleBlockHeight;

  return (
    <Box
      sx={{
        width: size.width,
        height: size.height,
        boxSizing: "border-box",
        padding: `${padding.top}px ${padding.right}px ${padding.bottom}px ${padding.left}px`,
        display: "flex",
        flexDirection: "column",
      }}
    >
      <Typography sx={{ fontSize: 22, fontWeight: 600, color: "text.primary", mb: "4px", lineHeight: 1 }}>
        {TITLE}
      </Typography>
      <Typography sx={{ fontSize: 14, color: t.inkSoft, mb: "20px", lineHeight: 1.3 }}>{CALLOUT}</Typography>
      <BarChart
        width={chartWidth}
        height={chartHeight}
        layout="horizontal"
        skipAnimation
        borderRadius={5}
        series={[
          {
            data: importance,
            label: "Feature importance",
            valueFormatter: (v) => (v === null ? "" : `${v.toFixed(3)} importance`),
          },
        ]}
        xAxis={[
          {
            min: 0,
            label: "Importance Score",
            colorMap: {
              type: "continuous",
              min: Math.min(...importance),
              max: Math.max(...importance),
              color: [t.seq[0], t.seq[1]],
            },
            tickLabelStyle: { fontSize: 14 },
            labelStyle: { fontSize: 16 },
          },
        ]}
        yAxis={[
          {
            scaleType: "band",
            data: features,
            tickLabelStyle: { fontSize: 14 },
          },
        ]}
        barLabel={(item) => (item.value === null ? "" : item.value.toFixed(3))}
        slots={{ barLabel: EndBarLabel }}
        grid={{ vertical: true }}
        margin={{ left: 190, right: 64, top: 16, bottom: 56 }}
        slotProps={{ legend: { hidden: true } }}
        sx={{
          "& .MuiChartsAxis-line": { stroke: t.grid },
          "& .MuiChartsGrid-line": { strokeDasharray: "4 3" },
        }}
      />
    </Box>
  );
}
Runnable source as JSON, for any HTTP client: https://api.anyplot.ai/specs/bar-feature-importance/muix/code. Any spec id and library id listed in llms-full.txt fit the same URL shape; every URL below is complete and callable.
{
  "spec_id": "bar-feature-importance",
  "language": "javascript",
  "library": "muix",
  "page": "https://anyplot.ai/bar-feature-importance/javascript/muix",
  "hub": "https://anyplot.ai/bar-feature-importance",
  "code_json": "https://api.anyplot.ai/specs/bar-feature-importance/muix/code",
  "spec_json": "https://api.anyplot.ai/specs/bar-feature-importance",
  "render_light_png": "https://storage.googleapis.com/anyplot-images/plots/bar-feature-importance/javascript/muix/plot-light.png",
  "render_dark_png": "https://storage.googleapis.com/anyplot-images/plots/bar-feature-importance/javascript/muix/plot-dark.png",
  "interactive_light_html": "https://storage.googleapis.com/anyplot-images/plots/bar-feature-importance/javascript/muix/plot-light.html",
  "interactive_dark_html": "https://storage.googleapis.com/anyplot-images/plots/bar-feature-importance/javascript/muix/plot-dark.html",
  "quality_score": 93.0,
  "license": "MIT",
  "guide": "https://anyplot.ai/llms.txt"
}
Part of Feature Importance Bar Chart on anyplot.ai.