The same plot in 14 other libraries — JavaScript: Chart.js, D3.js, Apache ECharts, MUI X Charts; Python: Altair, Bokeh, lets-plot, Matplotlib, Plotly, plotnine, Pygal, Seaborn; R: ggplot2; Julia: Makie.jl. Compare all 15 side by side: Feature Importance Bar Chart in Python, R, Julia and JavaScript.
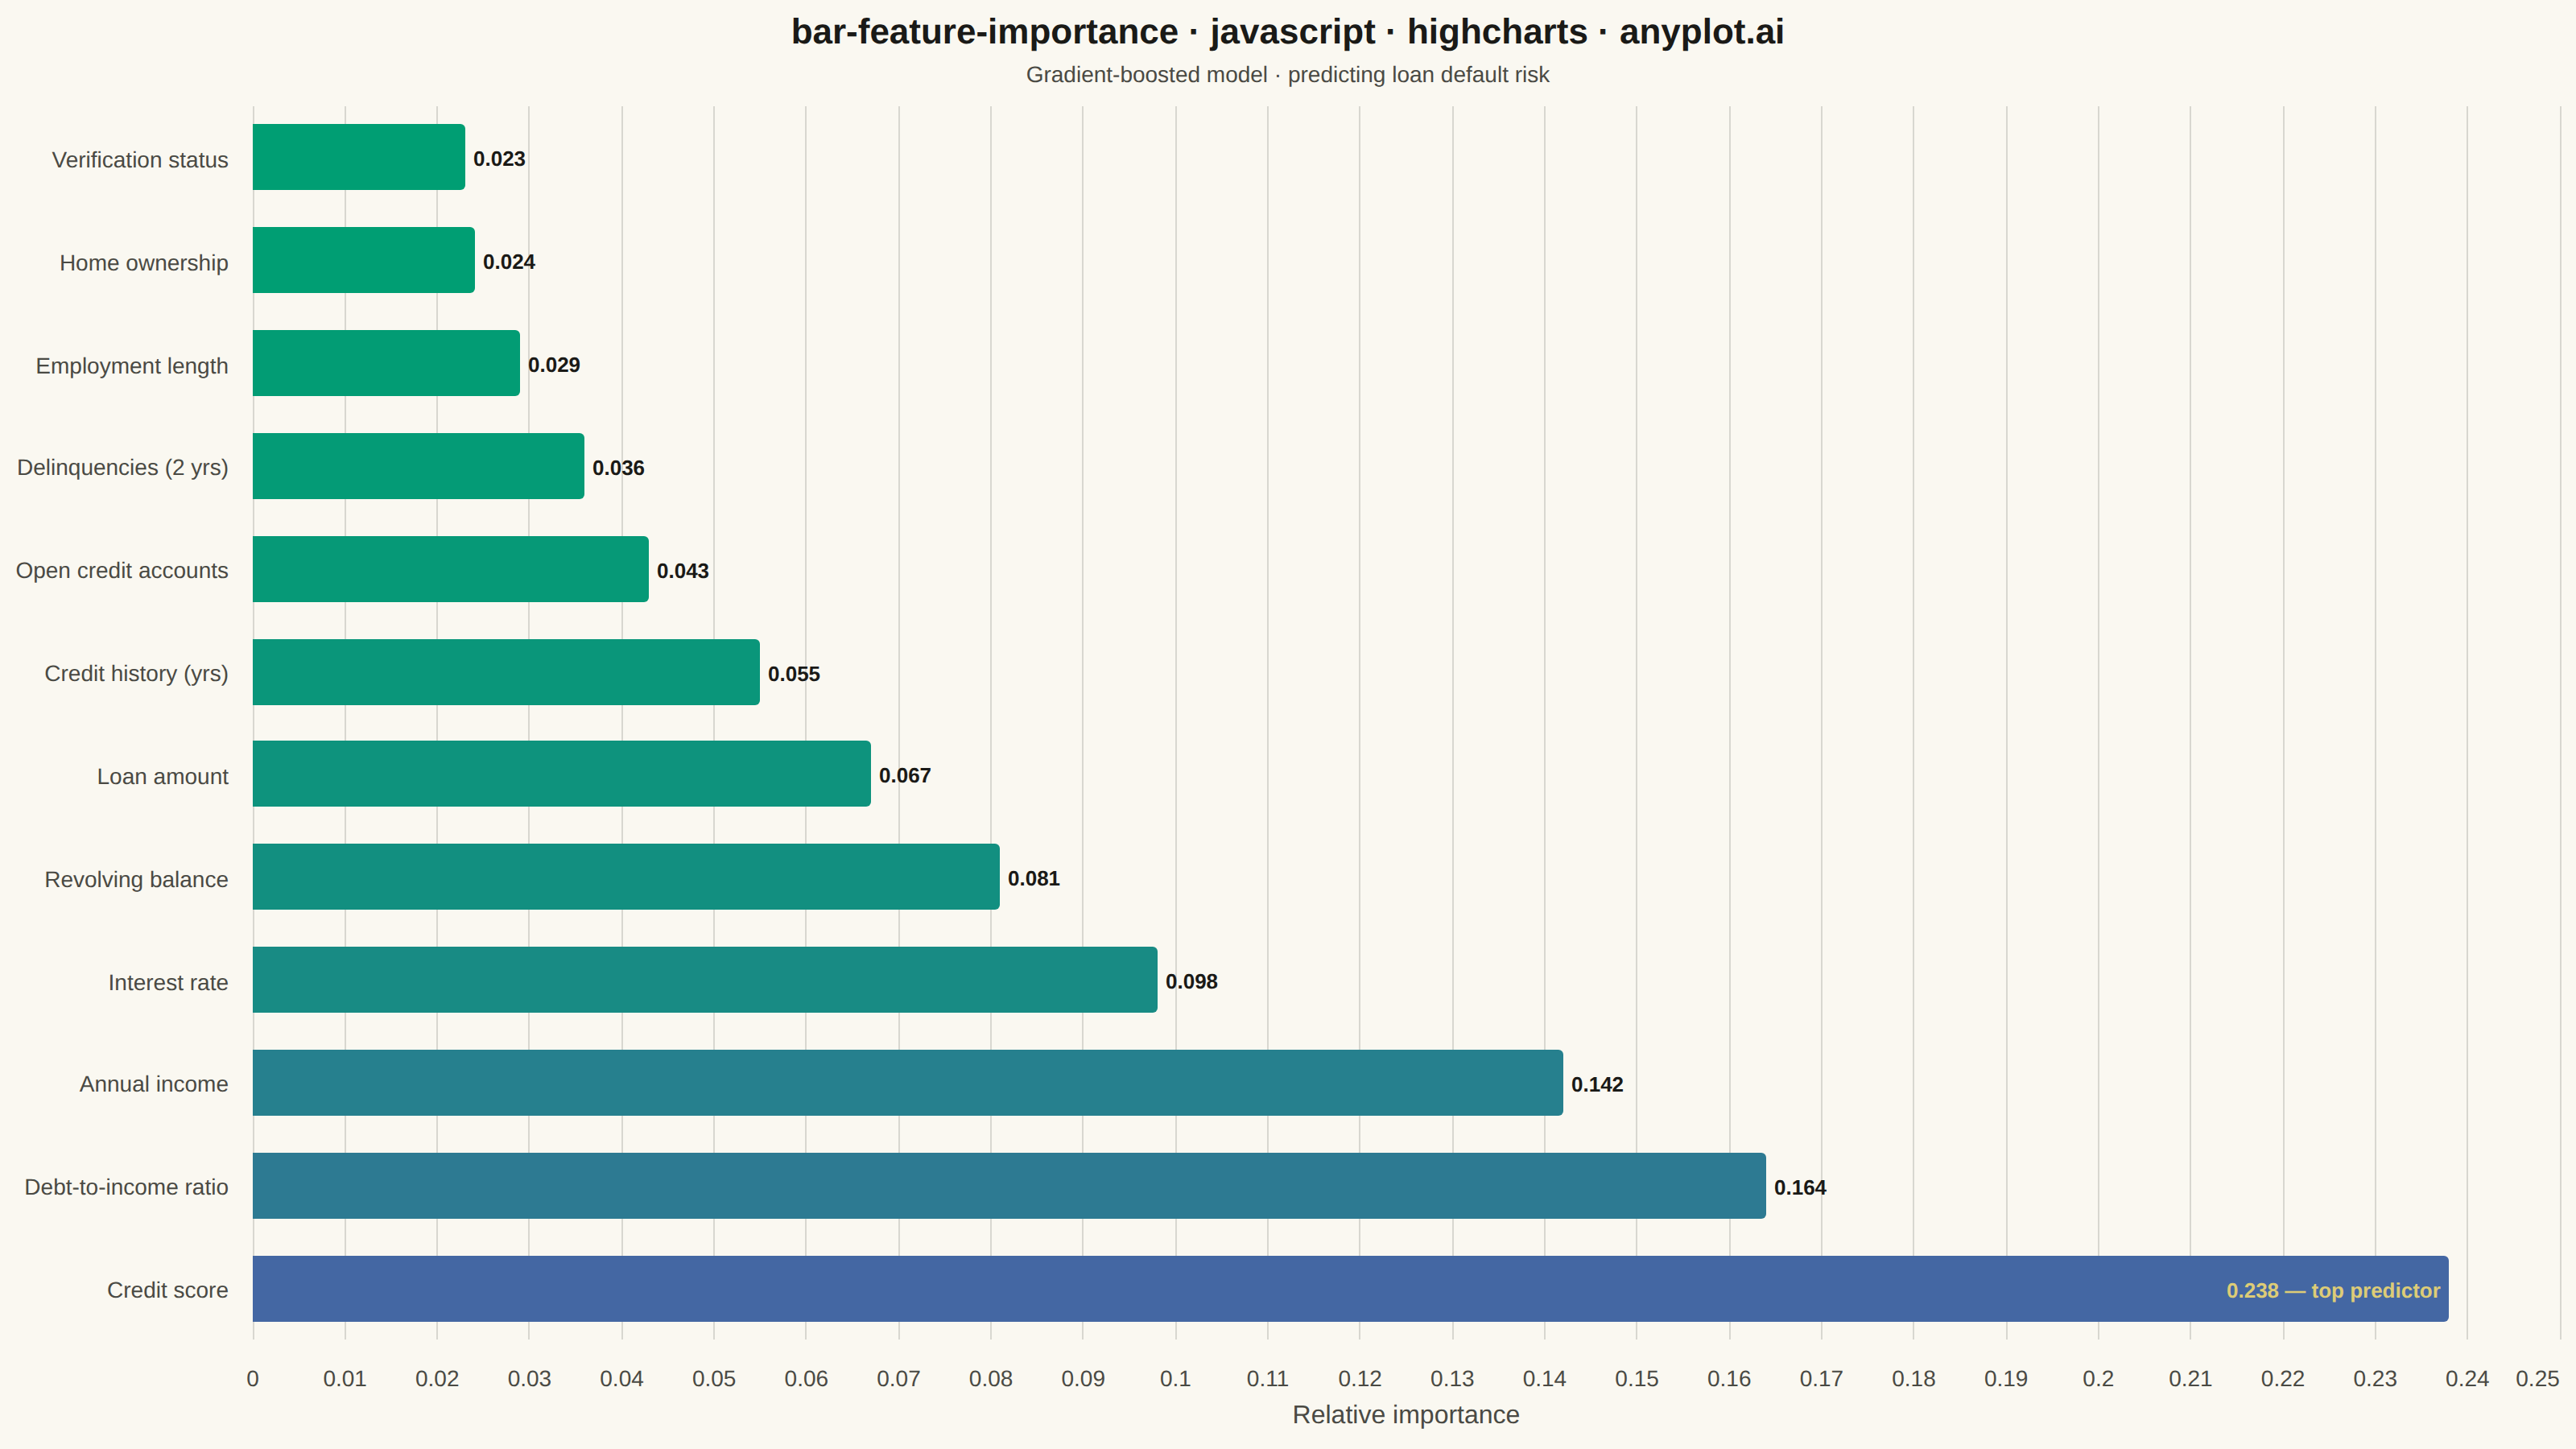
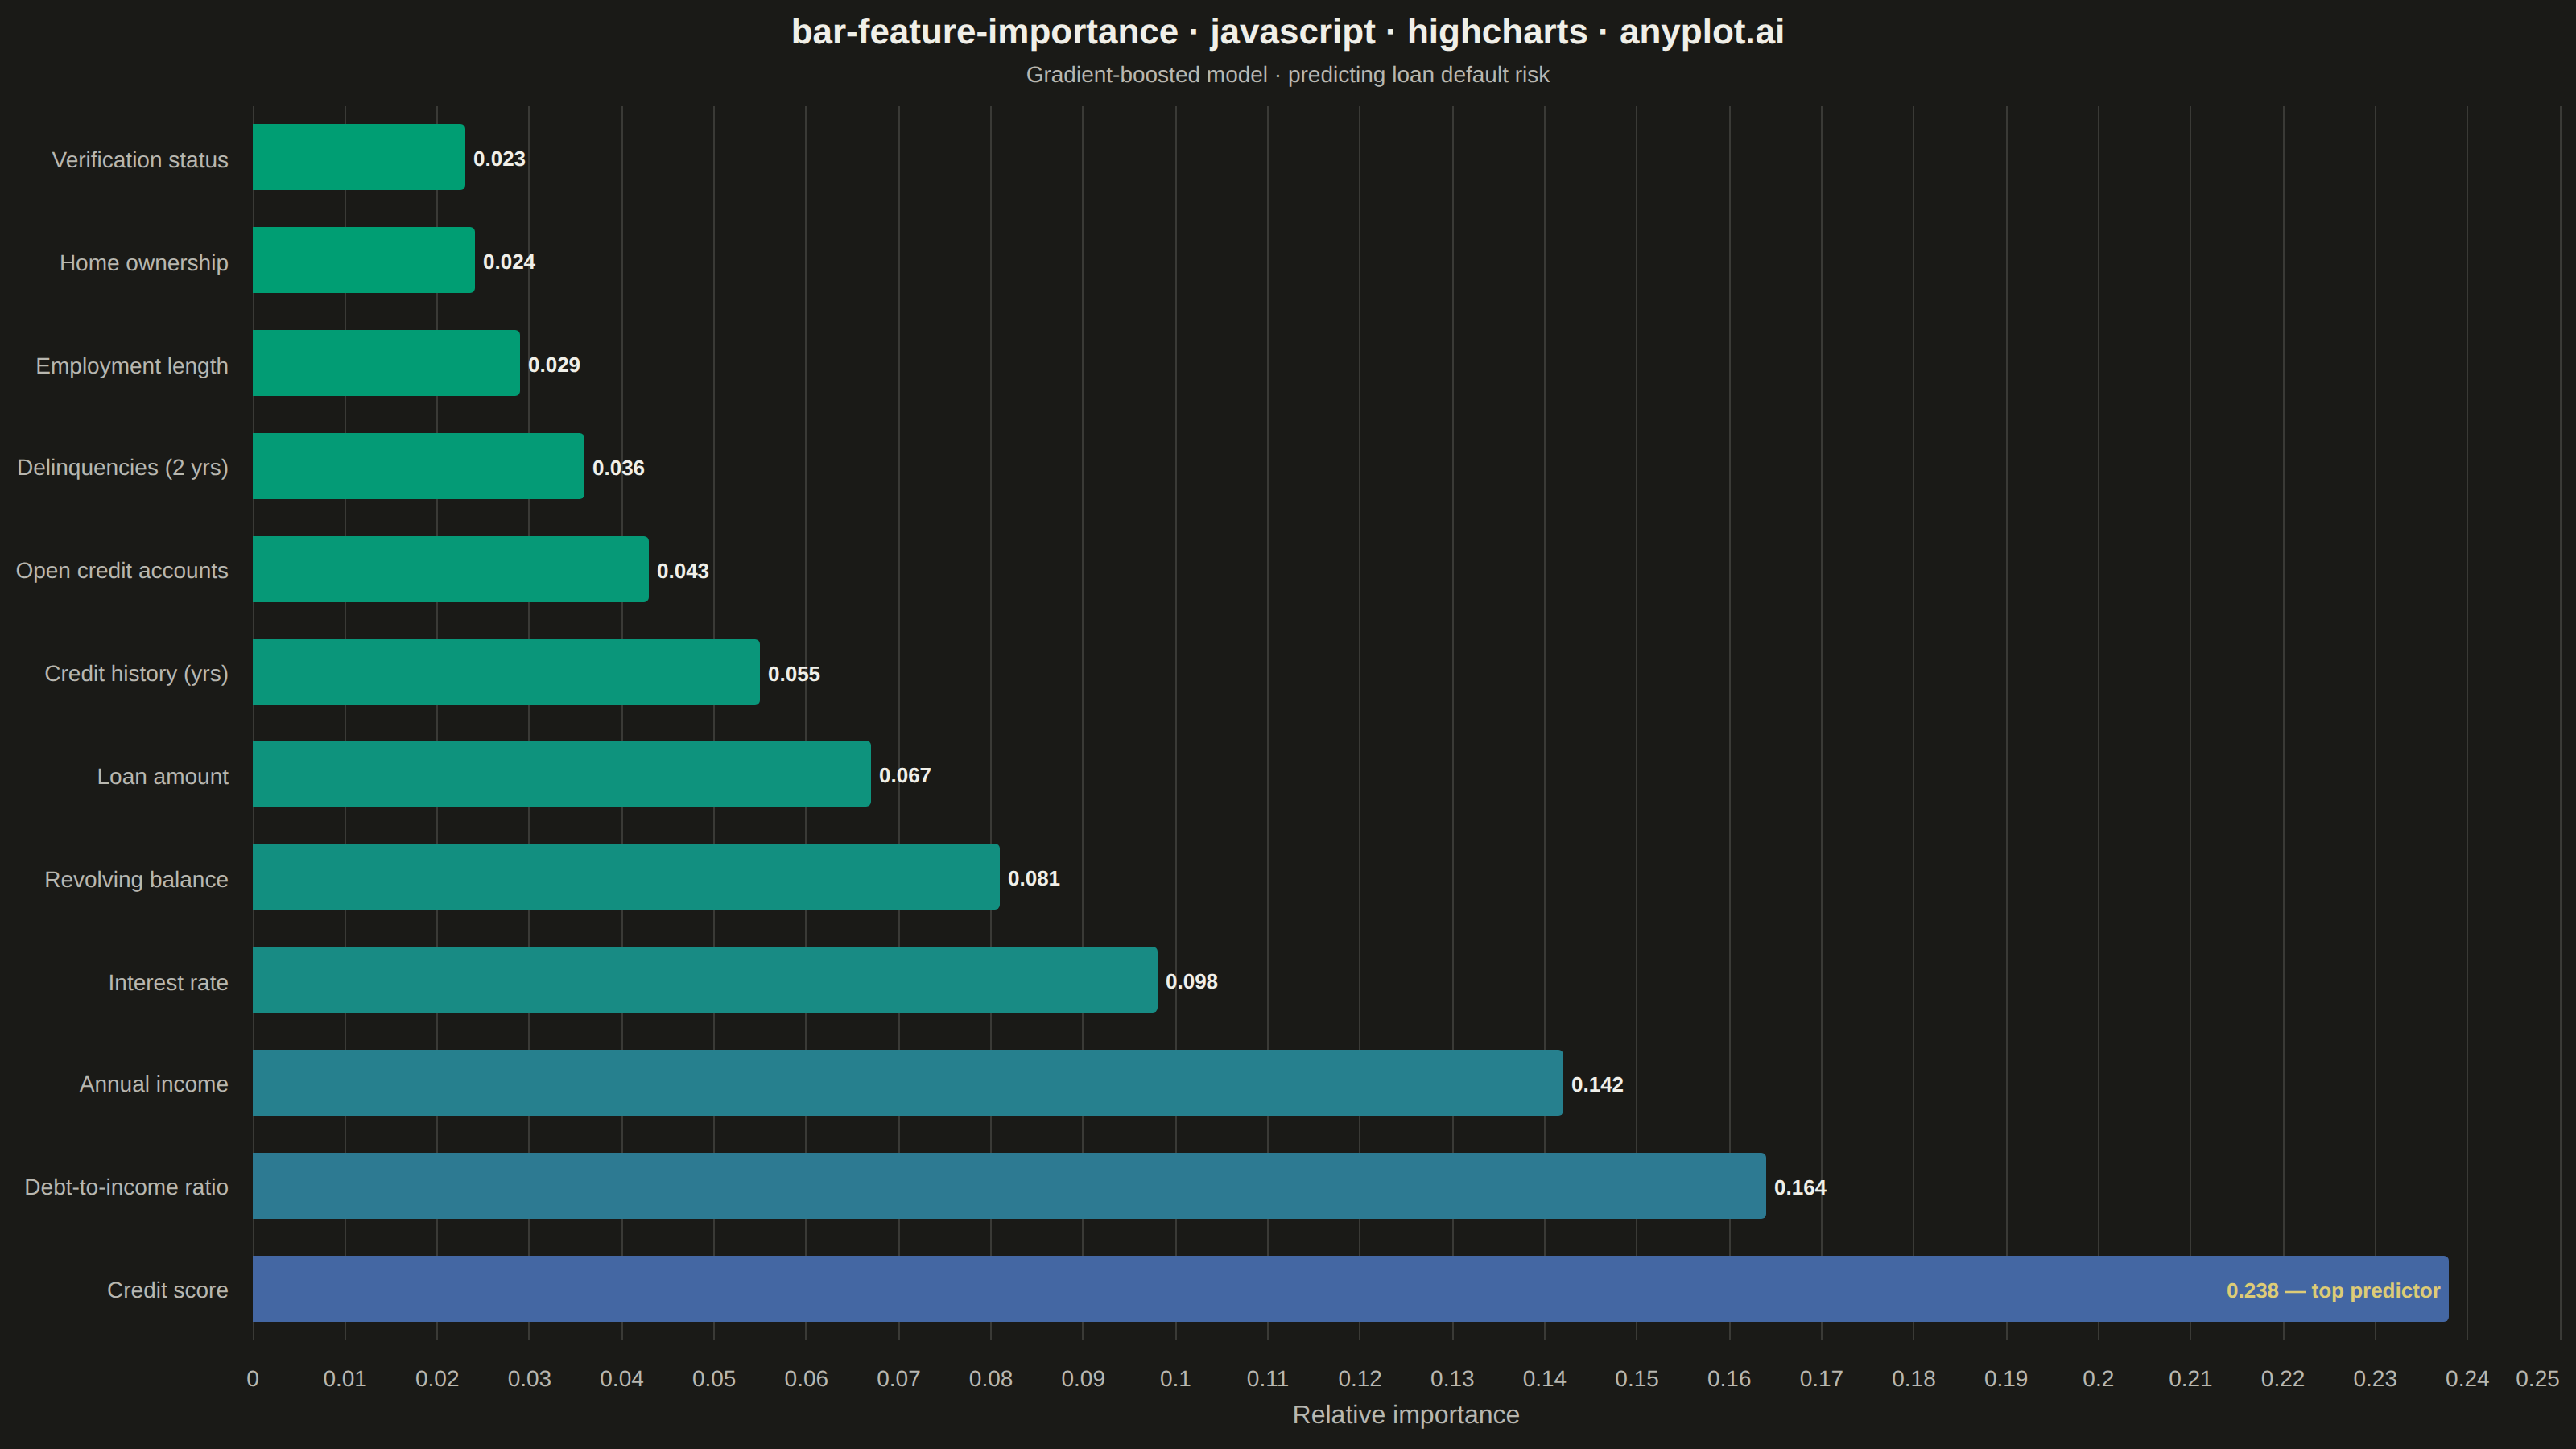
A horizontal bar chart displaying feature importances from machine learning models, with features sorted by importance value and bars colored by a gradient to emphasize relative contribution. This visualization is essential for model interpretability, helping data scientists and stakeholders understand which features drive model predictions. The horizontal orientation allows for readable feature names of varying lengths.
// anyplot.ai
// bar-feature-importance: Feature Importance Bar Chart
// Library: highcharts 12.6.0 | JavaScript 22.23.2
// Quality: 92/100 | Created: 2026-09-02

const t = window.ANYPLOT_TOKENS;

// --- Data (in-memory, deterministic) ----------------------------------------
// Feature importances from a gradient-boosted tree model predicting loan
// default risk (analogous to sklearn's `.feature_importances_`, which sums
// to 1). Sorted ascending here because Highcharts' horizontal "bar" chart
// plots category index 0 at the bottom — ascending order puts the highest
// importance at the top.
const featuresDesc = [
  "Credit score",
  "Debt-to-income ratio",
  "Annual income",
  "Interest rate",
  "Revolving balance",
  "Loan amount",
  "Credit history (yrs)",
  "Open credit accounts",
  "Delinquencies (2 yrs)",
  "Employment length",
  "Home ownership",
  "Verification status",
];
const importanceDesc = [
  0.238, 0.164, 0.142, 0.098, 0.081, 0.067, 0.055, 0.043, 0.036, 0.029, 0.024,
  0.023,
];
const categories = [...featuresDesc].reverse();
const importance = [...importanceDesc].reverse();

// --- Color (Imprint sequential gradient, mapped to importance) -------------
// Highcharts' chart-level colorAxis + series.colorKey pattern needs
// modules/coloraxis.js for non-heatmap/treemap series, which this harness
// does not load (core bundle only — see prompts/library/highcharts.md
// "Forbidden patterns"). A per-point color computed from the Imprint
// sequential stops is the feasible equivalent within that constraint.
function hexToRgb(hex) {
  const v = parseInt(hex.slice(1), 16);
  return [(v >> 16) & 0xff, (v >> 8) & 0xff, v & 0xff];
}
function lerpColor(hexLow, hexHigh, ratio) {
  const [r0, g0, b0] = hexToRgb(hexLow);
  const [r1, g1, b1] = hexToRgb(hexHigh);
  const r = Math.round(r0 + (r1 - r0) * ratio);
  const g = Math.round(g0 + (g1 - g0) * ratio);
  const b = Math.round(b0 + (b1 - b0) * ratio);
  return `#${((1 << 24) + (r << 16) + (g << 8) + b).toString(16).slice(1)}`;
}
const minImportance = Math.min(...importance);
const maxImportance = Math.max(...importance);
const data = categories.map((name, i) => {
  const ratio = (importance[i] - minImportance) / (maxImportance - minImportance);
  return { name, y: importance[i], color: lerpColor(t.seq[0], t.seq[1], ratio) };
});
// Call out the single dominant feature (last entry — highest importance,
// since categories/importance are sorted ascending for the horizontal bar).
data[data.length - 1].dataLabels = {
  format: "{point.y:.3f} — top predictor",
  style: {
    color: t.amber,
    fontSize: "13px",
    fontWeight: "700",
    textOutline: "none",
  },
};

// --- Chart -------------------------------------------------------------------
Highcharts.chart("container", {
  chart: {
    type: "bar",
    backgroundColor: "transparent",
    animation: false,
    style: { fontFamily: "inherit" },
  },
  credits: { enabled: false },
  title: {
    text: "bar-feature-importance · javascript · highcharts · anyplot.ai",
    style: { color: t.ink, fontSize: "22px", fontWeight: "600" },
  },
  subtitle: {
    text: "Gradient-boosted model · predicting loan default risk",
    style: { color: t.inkSoft, fontSize: "14px" },
  },
  xAxis: {
    categories,
    lineWidth: 0,
    lineColor: t.inkSoft,
    tickColor: t.inkSoft,
    labels: { style: { color: t.inkSoft, fontSize: "14px" } },
  },
  yAxis: {
    min: 0,
    title: {
      text: "Relative importance",
      style: { color: t.inkSoft, fontSize: "16px" },
    },
    gridLineColor: t.grid,
    labels: { style: { color: t.inkSoft, fontSize: "14px" } },
  },
  legend: { enabled: false },
  plotOptions: {
    series: { animation: false },
    bar: {
      borderWidth: 0,
      pointPadding: 0.1,
      groupPadding: 0.1,
      dataLabels: {
        enabled: true,
        format: "{point.y:.3f}",
        style: {
          color: t.ink,
          fontSize: "13px",
          fontWeight: "600",
          textOutline: "none",
        },
      },
    },
  },
  tooltip: { enabled: false },
  series: [{ name: "Importance", data }],
});
Runnable source as JSON, for any HTTP client: https://api.anyplot.ai/specs/bar-feature-importance/highcharts/code. Any spec id and library id listed in llms-full.txt fit the same URL shape; every URL below is complete and callable.
{
  "spec_id": "bar-feature-importance",
  "language": "javascript",
  "library": "highcharts",
  "page": "https://anyplot.ai/bar-feature-importance/javascript/highcharts",
  "hub": "https://anyplot.ai/bar-feature-importance",
  "code_json": "https://api.anyplot.ai/specs/bar-feature-importance/highcharts/code",
  "spec_json": "https://api.anyplot.ai/specs/bar-feature-importance",
  "render_light_png": "https://storage.googleapis.com/anyplot-images/plots/bar-feature-importance/javascript/highcharts/plot-light.png",
  "render_dark_png": "https://storage.googleapis.com/anyplot-images/plots/bar-feature-importance/javascript/highcharts/plot-dark.png",
  "interactive_light_html": "https://storage.googleapis.com/anyplot-images/plots/bar-feature-importance/javascript/highcharts/plot-light.html",
  "interactive_dark_html": "https://storage.googleapis.com/anyplot-images/plots/bar-feature-importance/javascript/highcharts/plot-dark.html",
  "quality_score": 92.0,
  "license": "MIT",
  "guide": "https://anyplot.ai/llms.txt"
}
Part of Feature Importance Bar Chart on anyplot.ai.