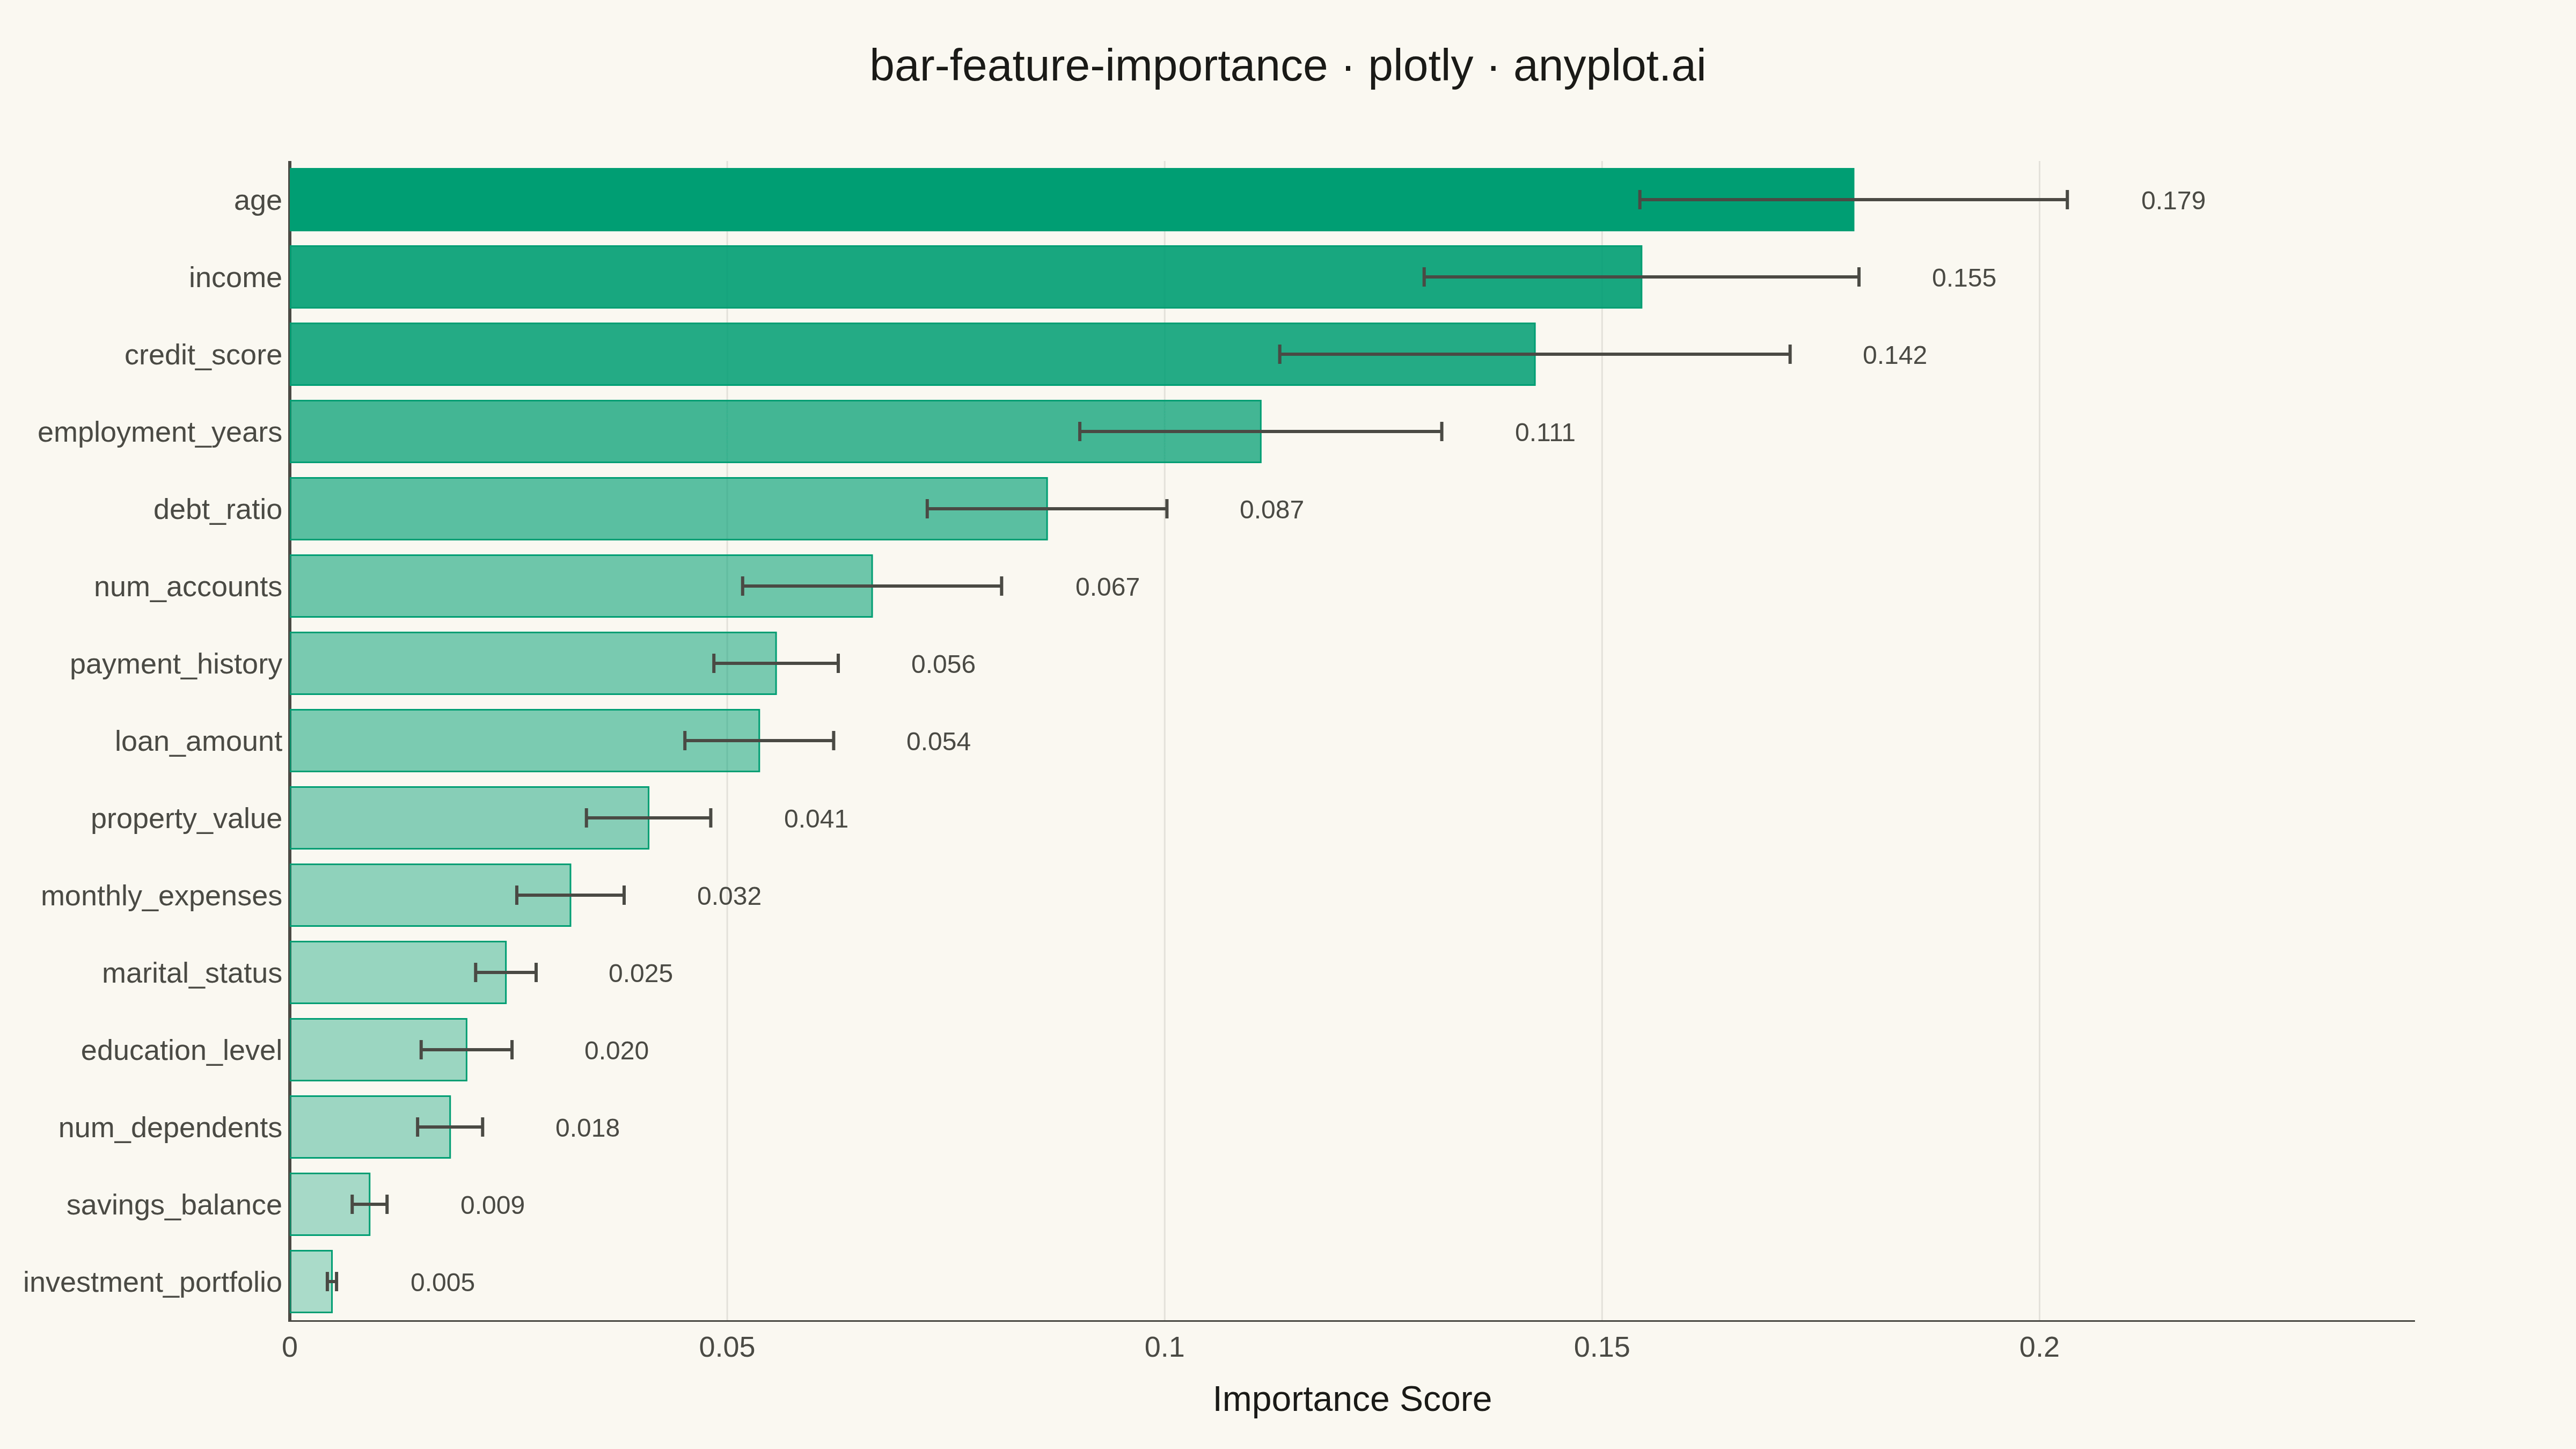
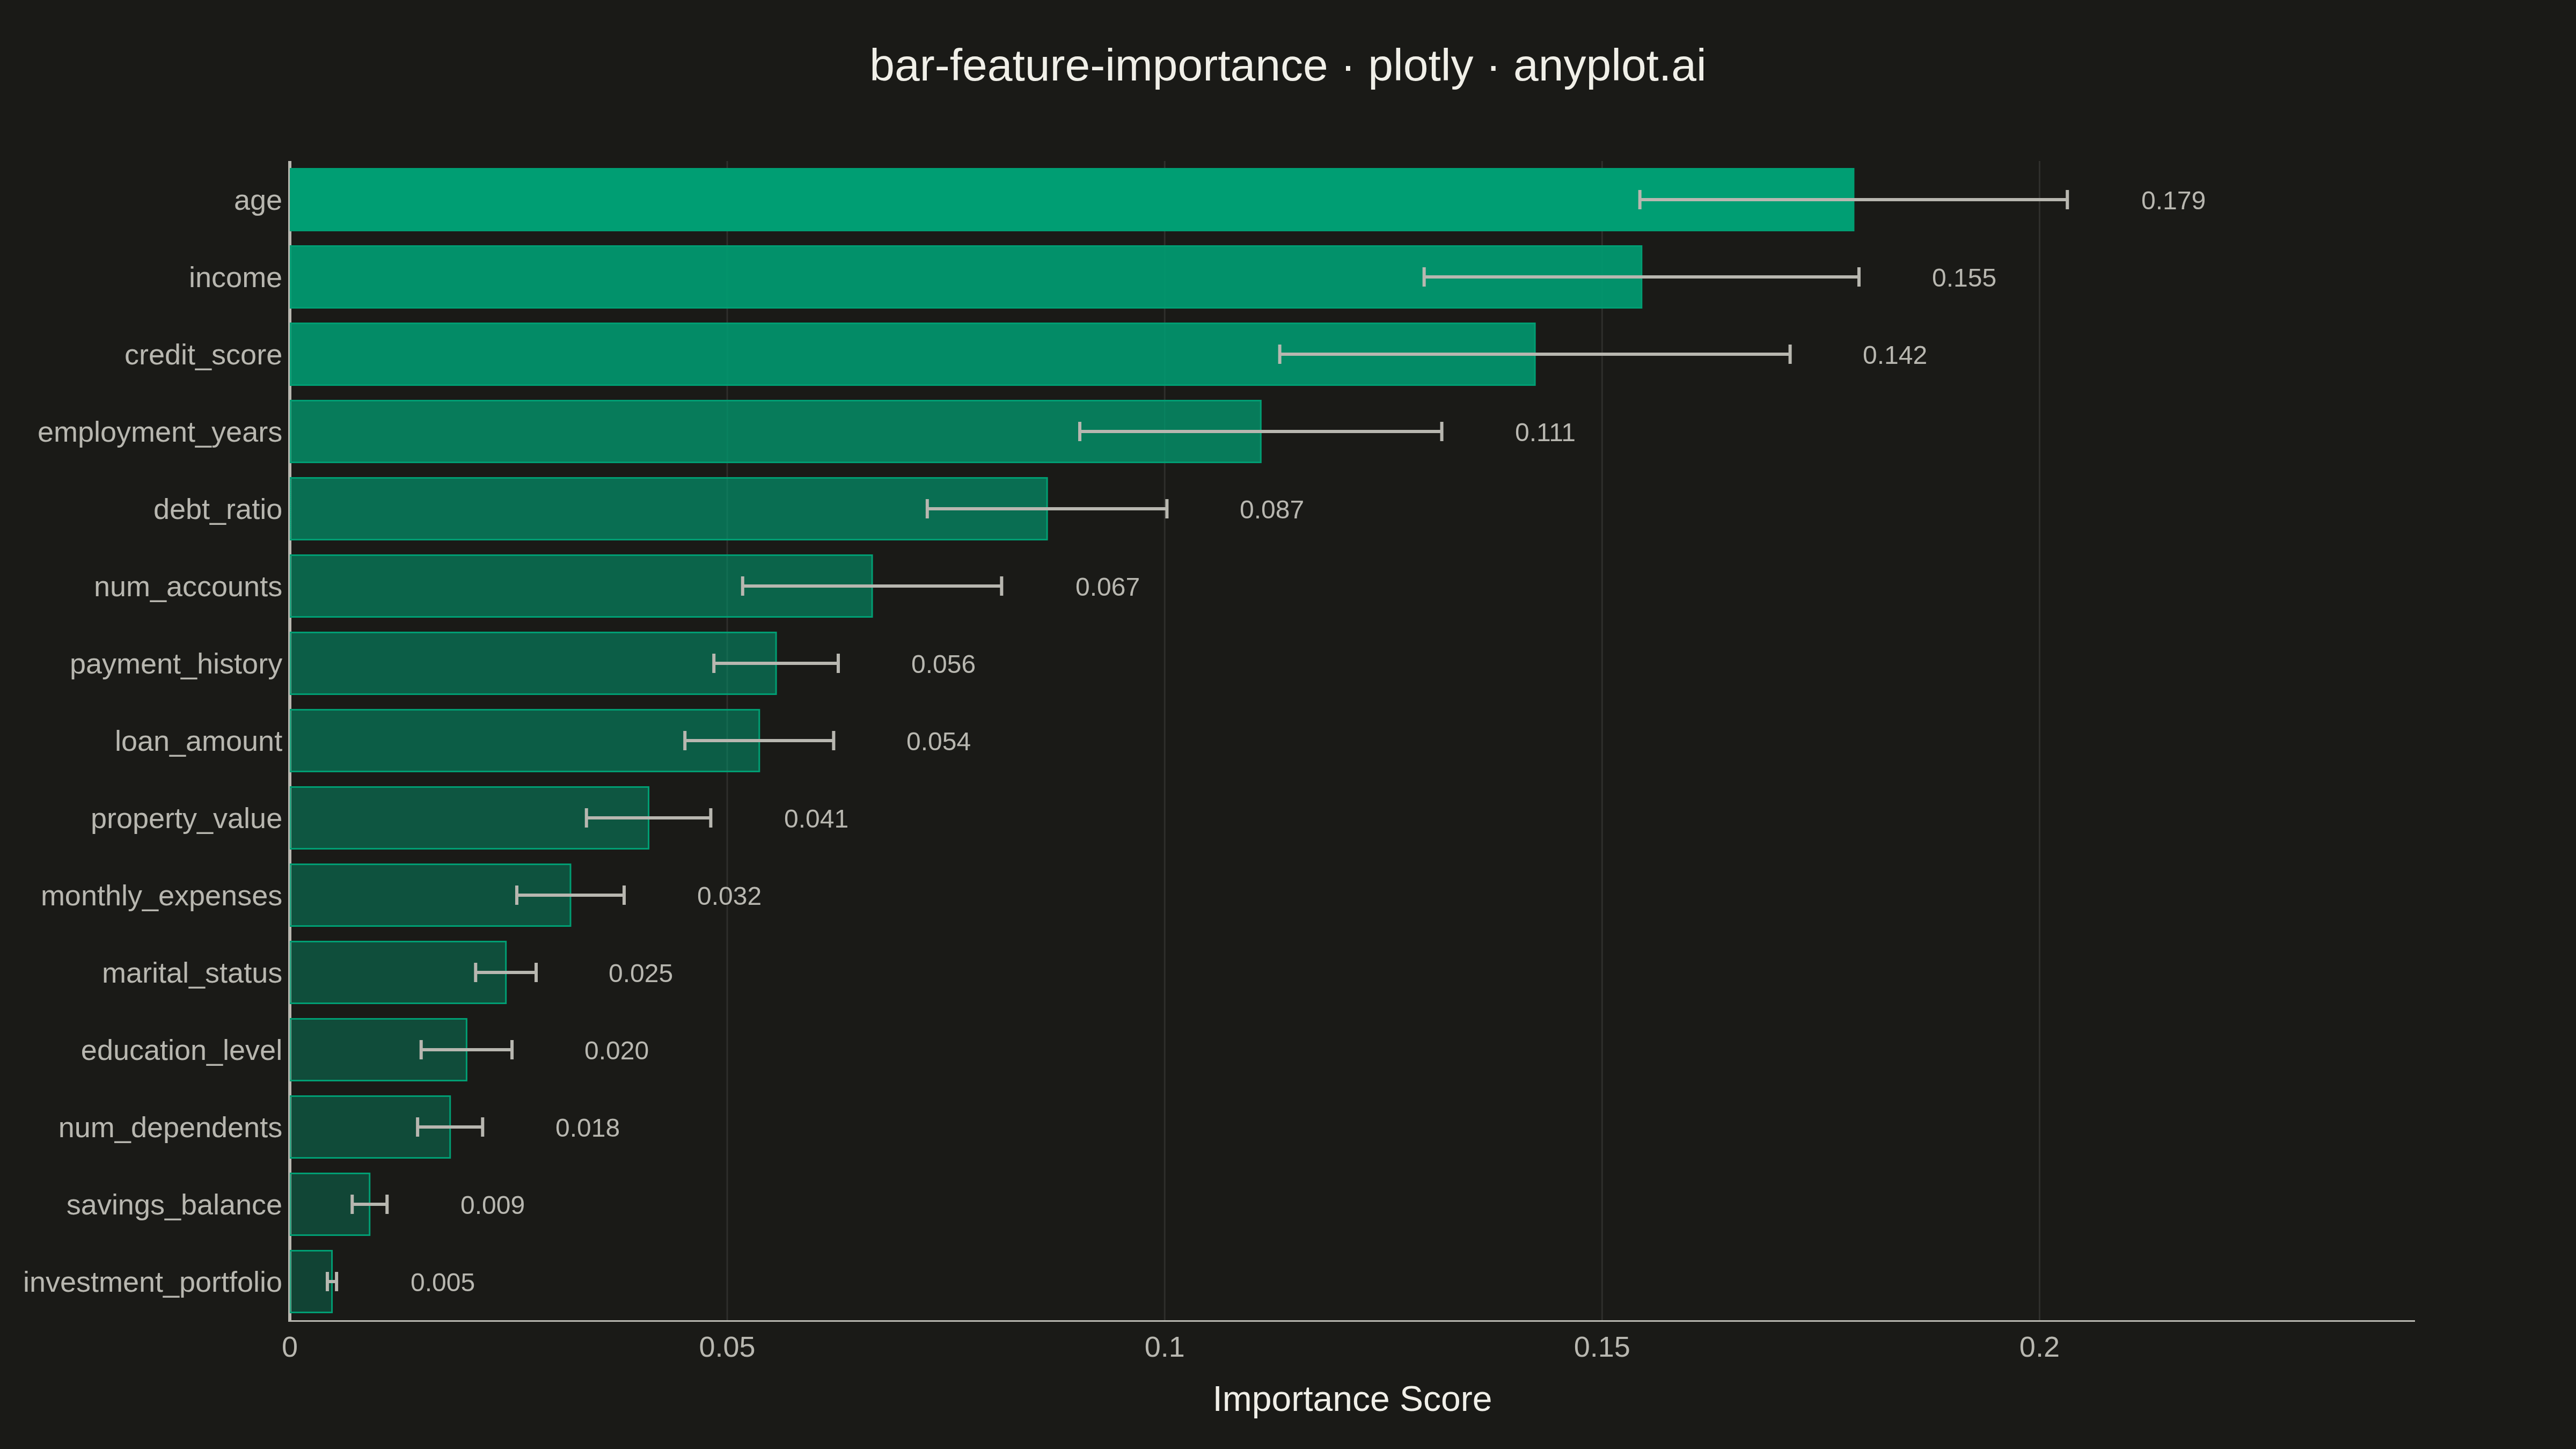
A horizontal bar chart displaying feature importances from machine learning models, with features sorted by importance value and bars colored by a gradient to emphasize relative contribution. This visualization is essential for model interpretability, helping data scientists and stakeholders understand which features drive model predictions. The horizontal orientation allows for readable feature names of varying lengths.
""" anyplot.ai
bar-feature-importance: Feature Importance Bar Chart
Library: plotly 6.7.0 | Python 3.13.13
Quality: 92/100 | Updated: 2026-05-10
"""

import os

import numpy as np
import plotly.graph_objects as go


# Theme tokens (see prompts/default-style-guide.md "Theme-adaptive Chrome")
THEME = os.getenv("ANYPLOT_THEME", "light")
PAGE_BG = "#FAF8F1" if THEME == "light" else "#1A1A17"
ELEVATED_BG = "#FFFDF6" if THEME == "light" else "#242420"
INK = "#1A1A17" if THEME == "light" else "#F0EFE8"
INK_SOFT = "#4A4A44" if THEME == "light" else "#B8B7B0"
GRID = "rgba(26,26,23,0.10)" if THEME == "light" else "rgba(240,239,232,0.10)"
BRAND = "#009E73"  # Okabe-Ito position 1

# Data - Feature importances from a typical ML model
np.random.seed(42)

features = [
    "age",
    "income",
    "credit_score",
    "employment_years",
    "debt_ratio",
    "num_accounts",
    "payment_history",
    "loan_amount",
    "property_value",
    "monthly_expenses",
    "education_level",
    "marital_status",
    "num_dependents",
    "savings_balance",
    "investment_portfolio",
]

# Generate realistic importance values (decreasing with some variation)
base_importance = np.array(
    [0.18, 0.15, 0.14, 0.11, 0.09, 0.07, 0.06, 0.05, 0.04, 0.03, 0.025, 0.02, 0.015, 0.012, 0.008]
)
importance = base_importance + np.random.uniform(-0.005, 0.005, len(base_importance))
importance = np.clip(importance, 0.001, None)

# Standard deviation for error bars (ensemble uncertainty)
std = importance * np.random.uniform(0.1, 0.3, len(importance))

# Sort by importance (descending)
sorted_idx = np.argsort(importance)[::-1]
features_sorted = [features[i] for i in sorted_idx]
importance_sorted = importance[sorted_idx]
std_sorted = std[sorted_idx]

# Create color gradient based on importance using Okabe-Ito brand color
normalized_importance = importance_sorted / max(importance_sorted)
colors = [f"rgba(0, 158, 115, {0.3 + 0.7 * norm})" for norm in normalized_importance]

# Create figure
fig = go.Figure()

fig.add_trace(
    go.Bar(
        y=features_sorted,
        x=importance_sorted,
        orientation="h",
        marker=dict(color=colors, line=dict(color=BRAND, width=1)),
        error_x=dict(type="data", array=std_sorted, color=INK_SOFT, thickness=2, width=6),
        hovertemplate="<b>%{y}</b><br>Importance: %{x:.4f}<extra></extra>",
    )
)

# Add text annotations positioned after error bars
for feat, imp, std_val in zip(features_sorted, importance_sorted, std_sorted, strict=True):
    fig.add_annotation(
        x=imp + std_val + 0.008,
        y=feat,
        text=f"{imp:.3f}",
        showarrow=False,
        font=dict(size=16, color=INK_SOFT),
        xanchor="left",
    )

# Layout for 4800x2700 px canvas
fig.update_layout(
    title=dict(
        text="bar-feature-importance · plotly · anyplot.ai", font=dict(size=28, color=INK), x=0.5, xanchor="center"
    ),
    xaxis=dict(
        title=dict(text="Importance Score", font=dict(size=22, color=INK)),
        tickfont=dict(size=18, color=INK_SOFT),
        gridcolor=GRID,
        gridwidth=1,
        range=[0, max(importance_sorted) + max(std_sorted) + 0.035],
        linecolor=INK_SOFT,
        zerolinecolor=INK_SOFT,
    ),
    yaxis=dict(tickfont=dict(size=18, color=INK_SOFT), autorange="reversed", linecolor=INK_SOFT),
    paper_bgcolor=PAGE_BG,
    plot_bgcolor=PAGE_BG,
    font=dict(color=INK),
    margin=dict(l=180, r=100, t=100, b=80),
    showlegend=False,
)

# Save as PNG and HTML
fig.write_image(f"plot-{THEME}.png", width=1600, height=900, scale=3)
fig.write_html(f"plot-{THEME}.html", include_plotlyjs="cdn")
Runnable source as JSON, for any HTTP client: https://api.anyplot.ai/specs/bar-feature-importance/plotly/code. Any spec id and library id listed in llms-full.txt fit the same URL shape; every URL below is complete and callable.
{
  "spec_id": "bar-feature-importance",
  "language": "python",
  "library": "plotly",
  "page": "https://anyplot.ai/bar-feature-importance/python/plotly",
  "hub": "https://anyplot.ai/bar-feature-importance",
  "code_json": "https://api.anyplot.ai/specs/bar-feature-importance/plotly/code",
  "spec_json": "https://api.anyplot.ai/specs/bar-feature-importance",
  "render_light_png": "https://storage.googleapis.com/anyplot-images/plots/bar-feature-importance/python/plotly/plot-light.png",
  "render_dark_png": "https://storage.googleapis.com/anyplot-images/plots/bar-feature-importance/python/plotly/plot-dark.png",
  "interactive_light_html": "https://storage.googleapis.com/anyplot-images/plots/bar-feature-importance/python/plotly/plot-light.html",
  "interactive_dark_html": "https://storage.googleapis.com/anyplot-images/plots/bar-feature-importance/python/plotly/plot-dark.html",
  "quality_score": 92.0,
  "license": "MIT",
  "guide": "https://anyplot.ai/llms.txt"
}
Part of Feature Importance Bar Chart on anyplot.ai.