The same plot in 14 other libraries — JavaScript: Chart.js, Apache ECharts, Highcharts, MUI X Charts; Python: Altair, Bokeh, lets-plot, Matplotlib, Plotly, plotnine, Pygal, Seaborn; R: ggplot2; Julia: Makie.jl. Compare all 15 side by side: Feature Importance Bar Chart in Python, R, Julia and JavaScript.
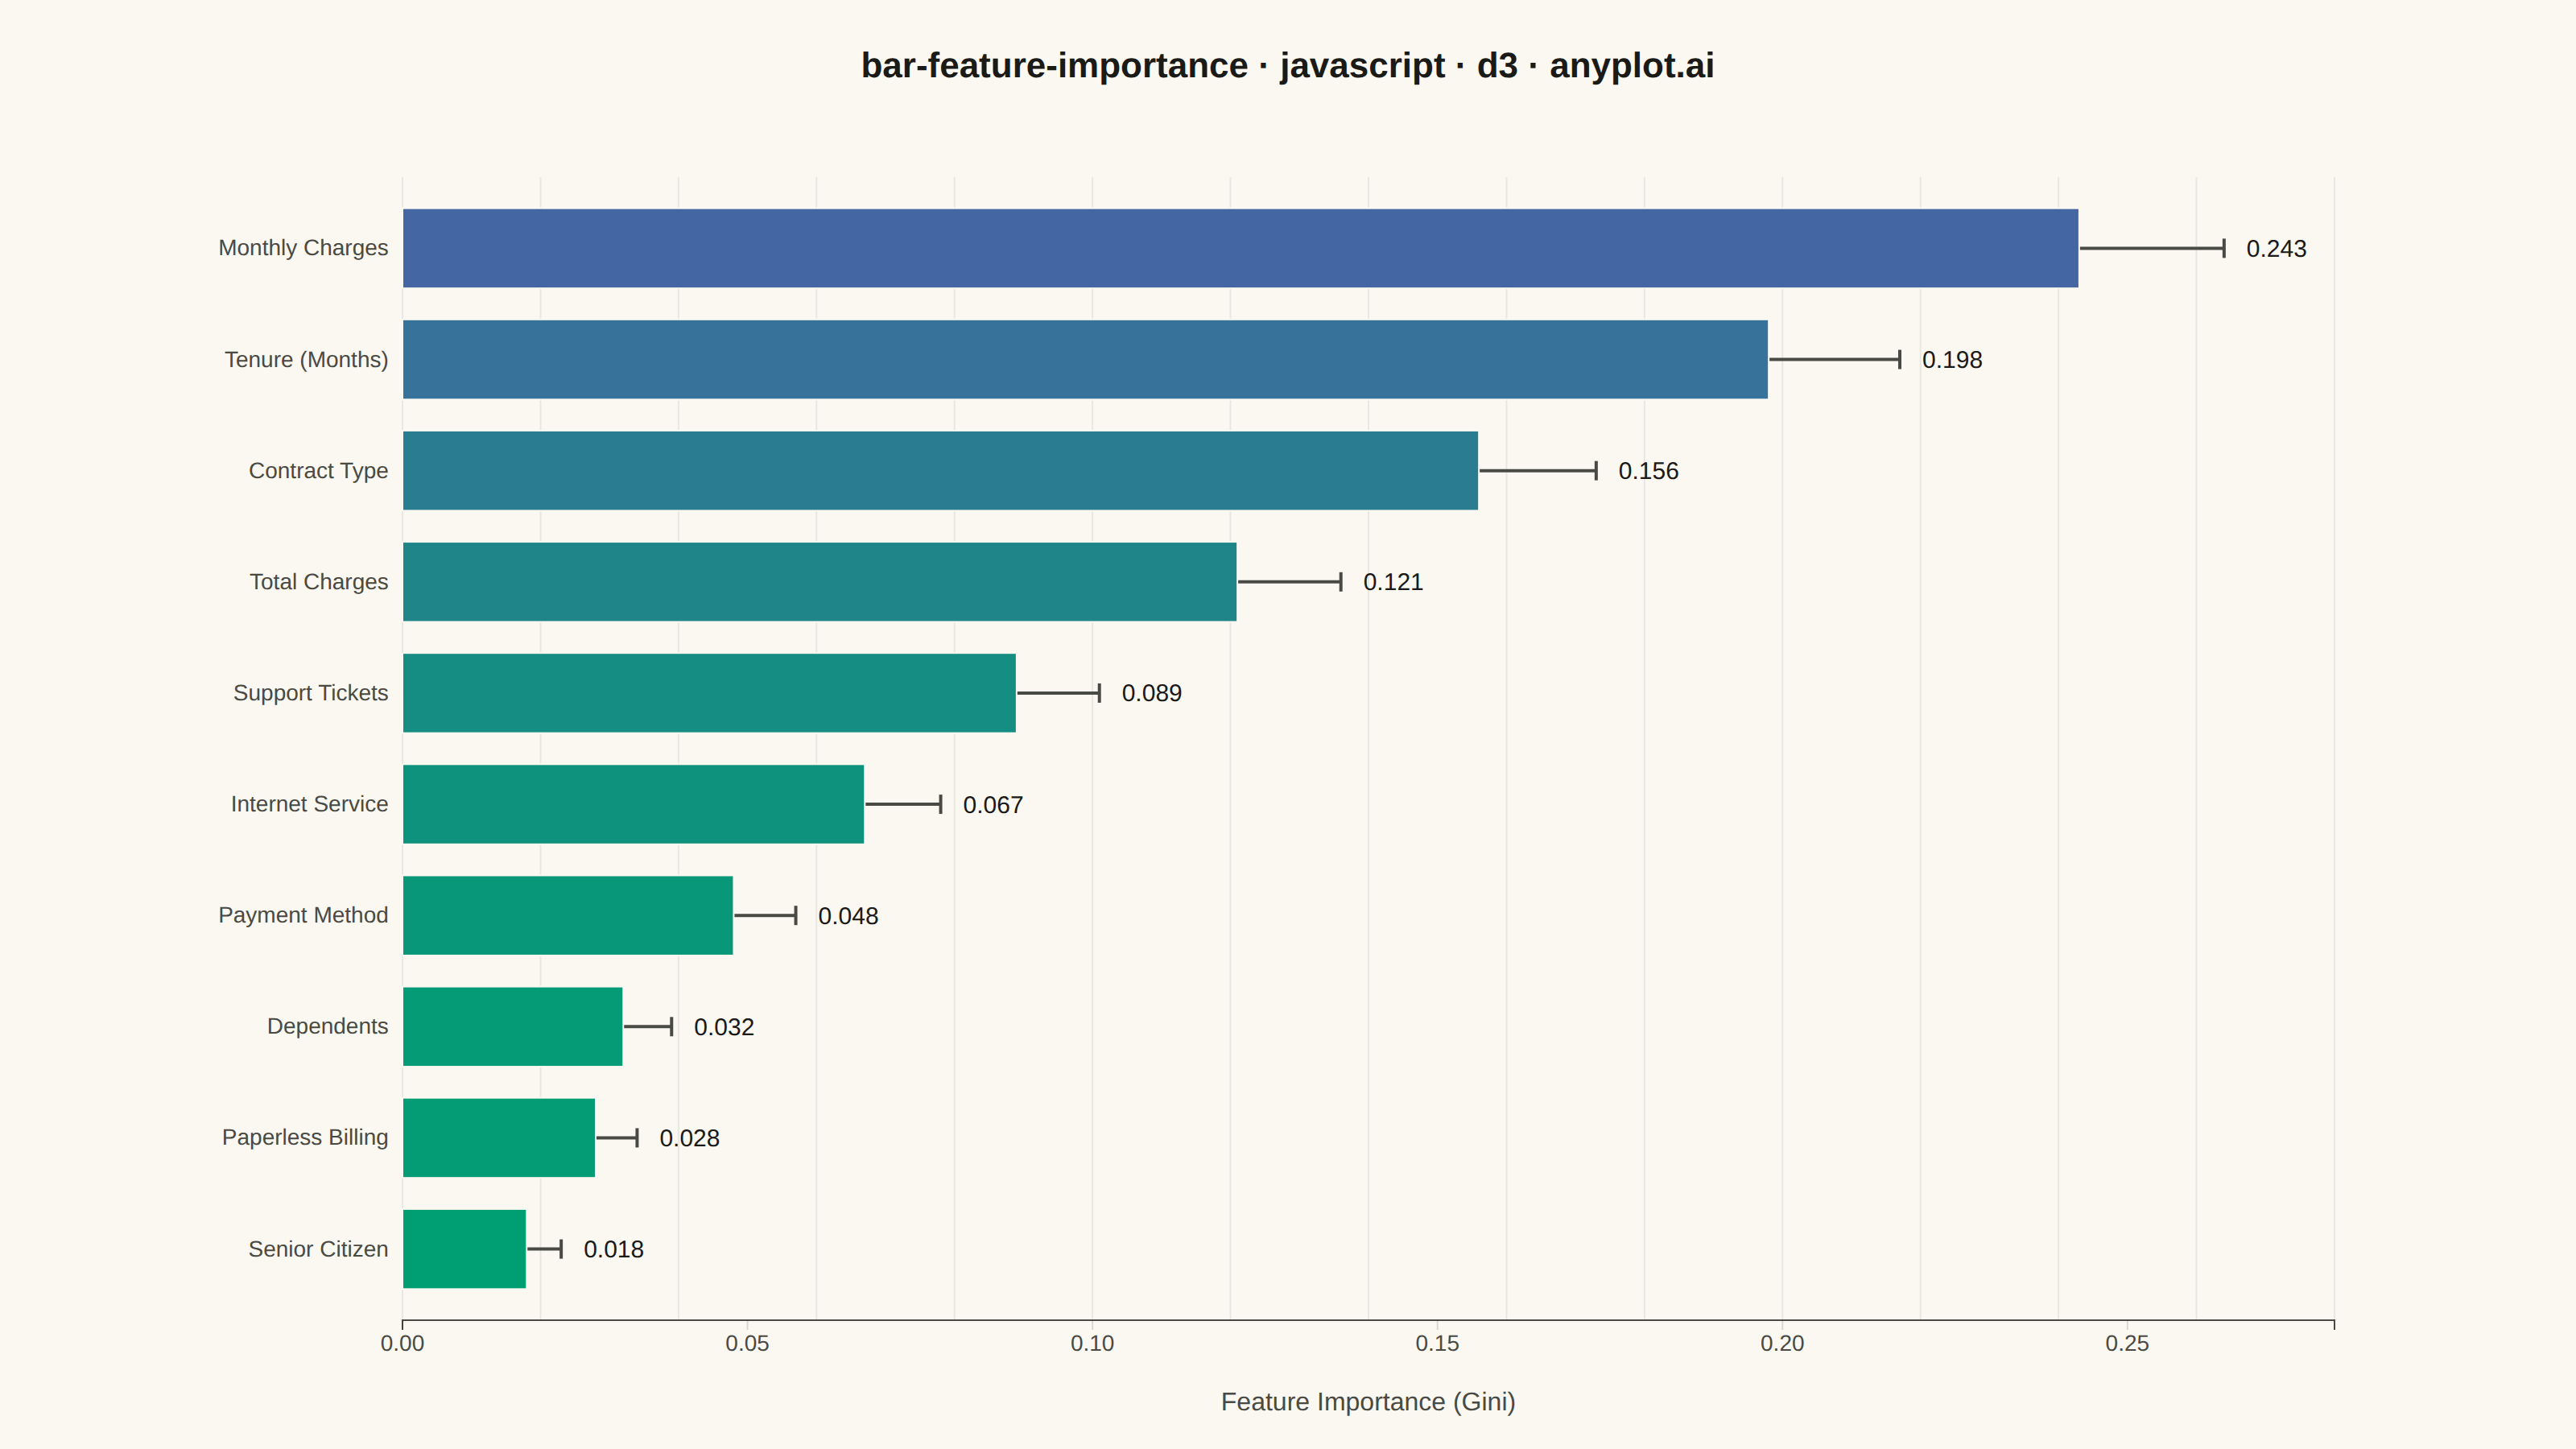
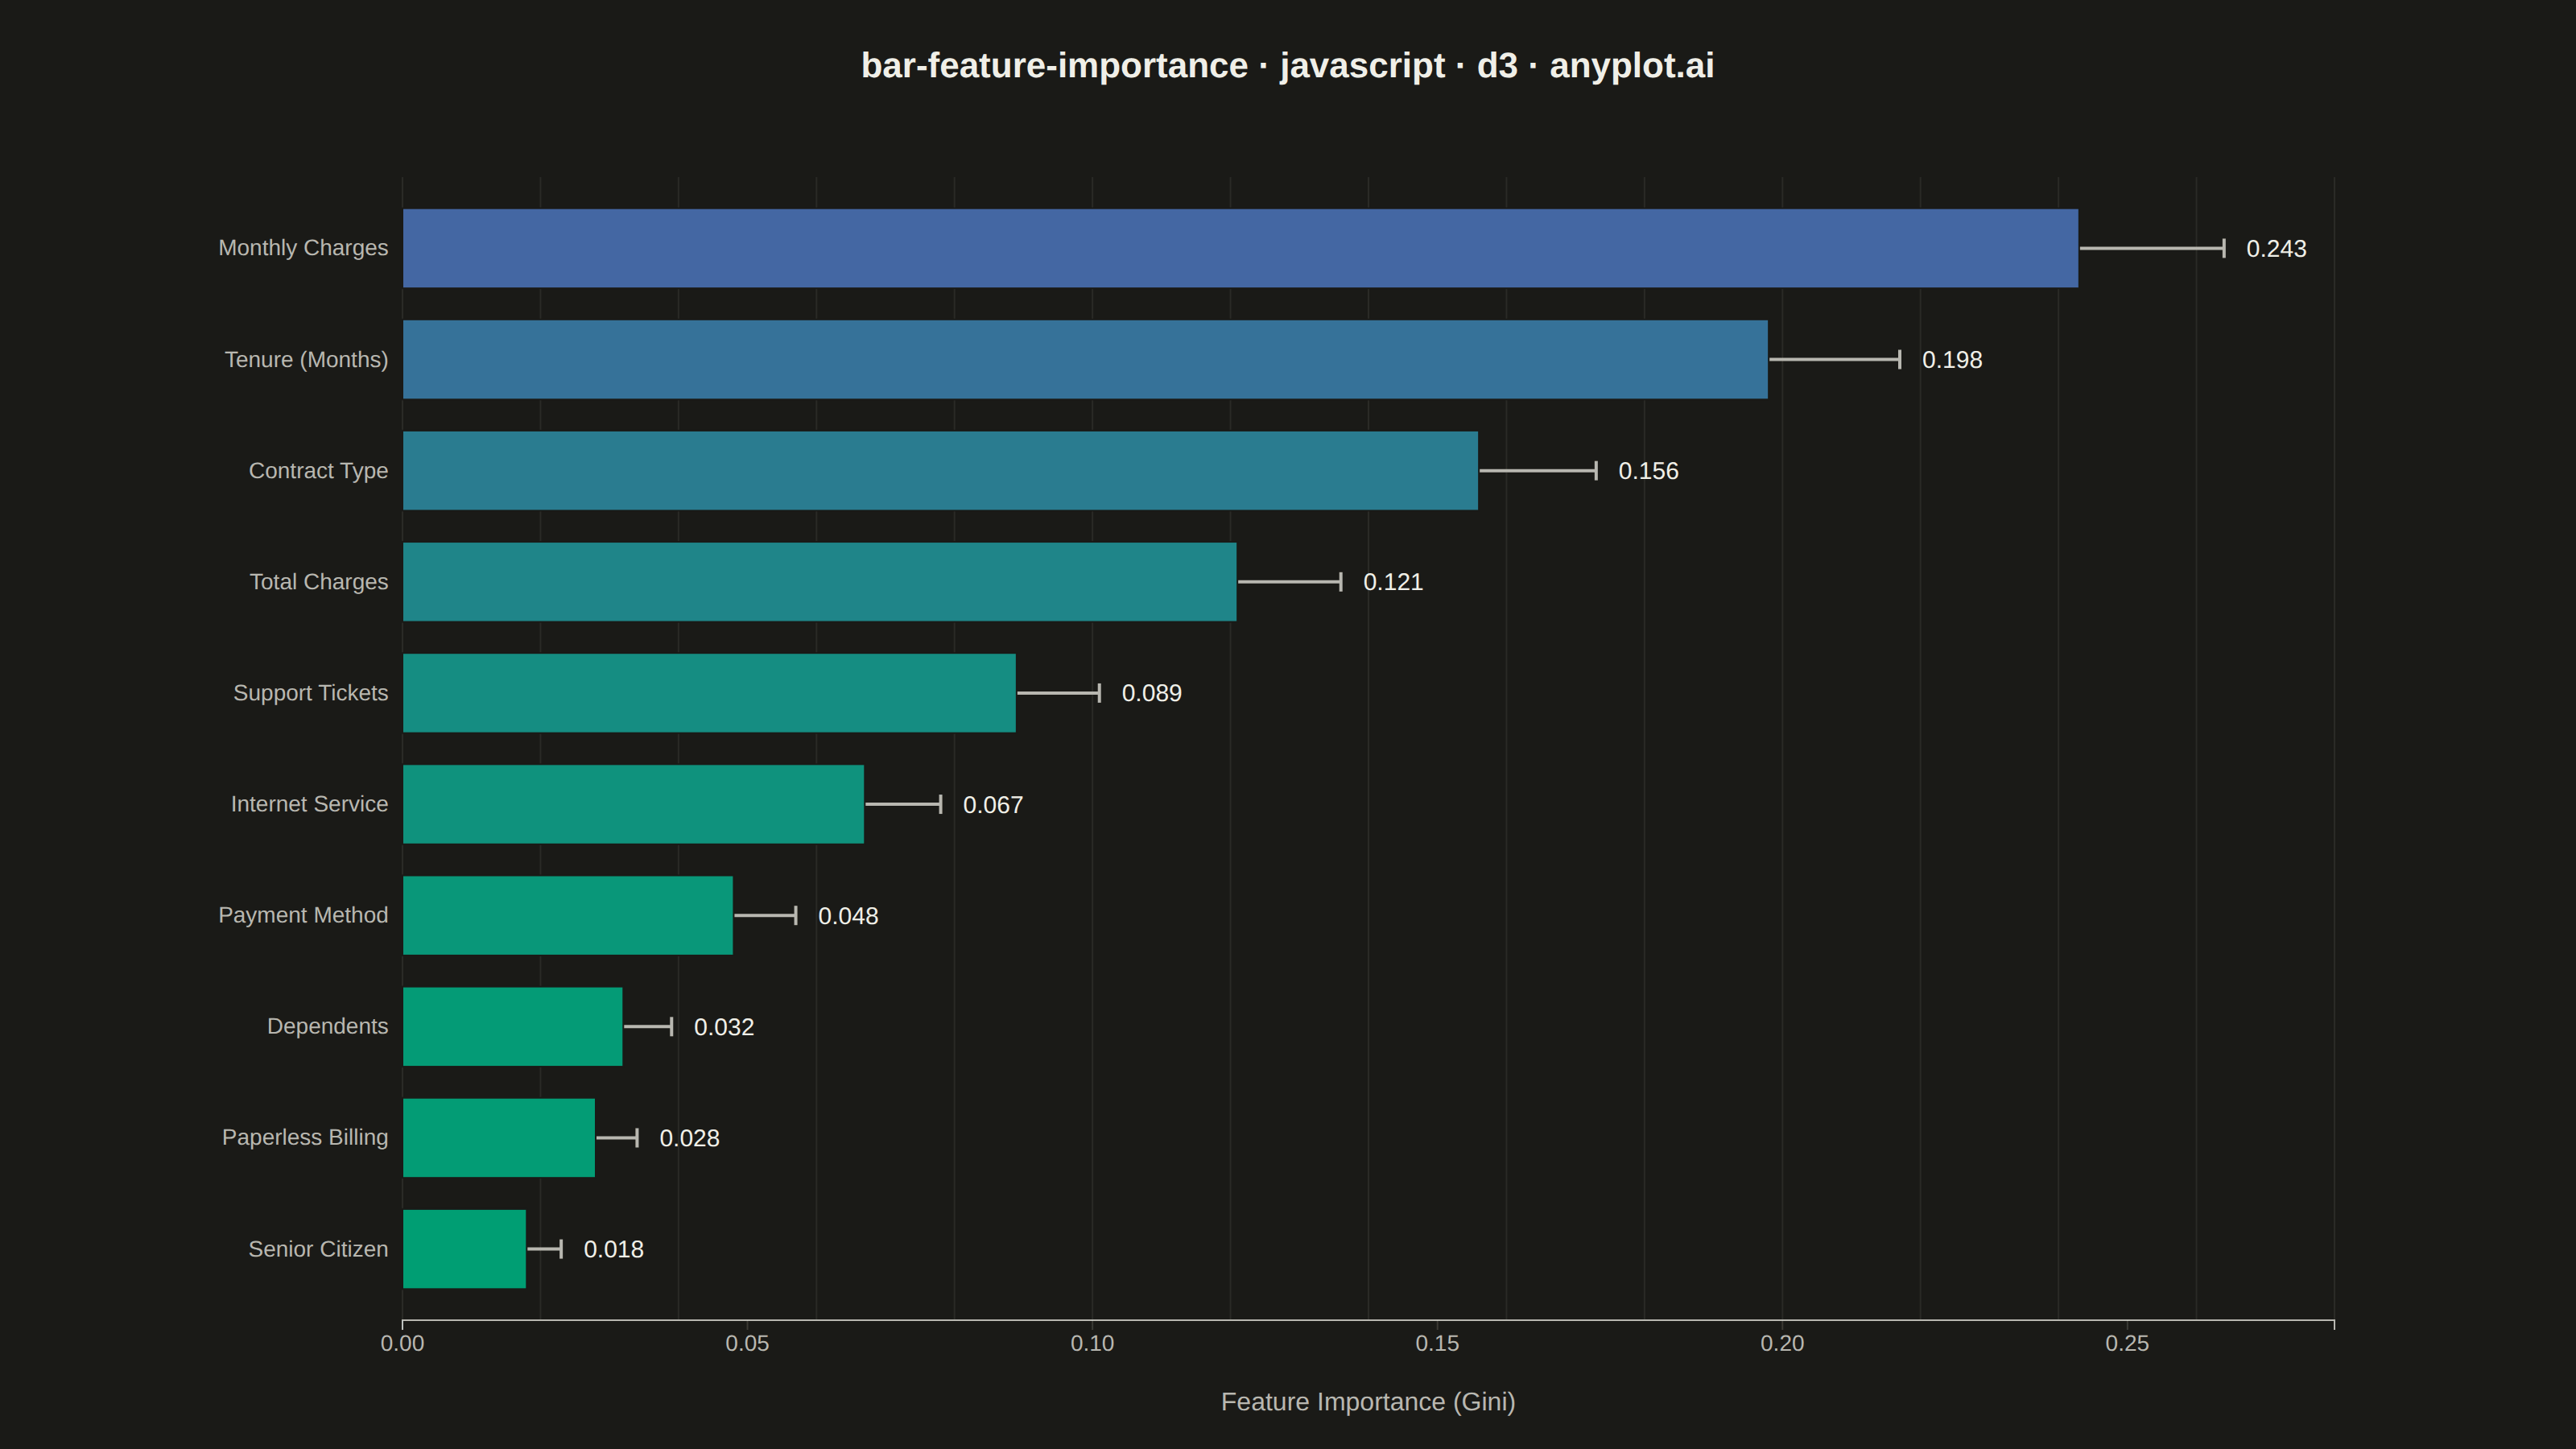
A horizontal bar chart displaying feature importances from machine learning models, with features sorted by importance value and bars colored by a gradient to emphasize relative contribution. This visualization is essential for model interpretability, helping data scientists and stakeholders understand which features drive model predictions. The horizontal orientation allows for readable feature names of varying lengths.
// anyplot.ai
// bar-feature-importance: Feature Importance Bar Chart
// Library: d3 7.9.0 | JavaScript 22.23.2
// Quality: 92/100 | Created: 2026-09-02

const t = window.ANYPLOT_TOKENS;
const { width, height } = window.ANYPLOT_SIZE;
const margin = { top: 110, right: 150, bottom: 80, left: 250 };
const iw = width - margin.left - margin.right;
const ih = height - margin.top - margin.bottom;

// --- Data (in-memory, deterministic) ----------------------------------------
// Gradient-boosted churn model: feature importances, sorted descending, with
// per-feature std across cross-validation folds (ensemble variability).
const features = [
  { name: "Monthly Charges", importance: 0.243, std: 0.021 },
  { name: "Tenure (Months)", importance: 0.198, std: 0.019 },
  { name: "Contract Type", importance: 0.156, std: 0.017 },
  { name: "Total Charges", importance: 0.121, std: 0.015 },
  { name: "Support Tickets", importance: 0.089, std: 0.012 },
  { name: "Internet Service", importance: 0.067, std: 0.011 },
  { name: "Payment Method", importance: 0.048, std: 0.009 },
  { name: "Dependents", importance: 0.032, std: 0.007 },
  { name: "Paperless Billing", importance: 0.028, std: 0.006 },
  { name: "Senior Citizen", importance: 0.018, std: 0.005 },
];

// --- SVG mount ----------------------------------------------------------------
const svg = d3.select("#container").append("svg").attr("width", width).attr("height", height);
const g = svg.append("g").attr("transform", `translate(${margin.left},${margin.top})`);

// --- Scales ---------------------------------------------------------------
const y = d3
  .scaleBand()
  .domain(features.map((d) => d.name))
  .range([0, ih])
  .padding(0.28);

const maxExtent = d3.max(features, (d) => d.importance + d.std);
const x = d3.scaleLinear().domain([0, maxExtent]).nice().range([0, iw]);

const color = d3
  .scaleSequential(d3.interpolateRgbBasis(t.seq))
  .domain(d3.extent(features, (d) => d.importance));

// --- Gridlines (value axis only) -------------------------------------------
g.append("g")
  .attr("class", "grid")
  .attr("transform", `translate(0,${ih})`)
  .call(d3.axisBottom(x).tickSize(-ih).tickFormat(""))
  .call((sel) => sel.select(".domain").remove())
  .selectAll("line")
  .attr("stroke", t.grid)
  .attr("stroke-opacity", 0.5);

// --- Error bars (ensemble std) -----------------------------------------------
const errorGroups = g
  .selectAll(".error-bar")
  .data(features)
  .join("g")
  .attr("class", "error-bar")
  .attr("transform", (d) => `translate(0,${y(d.name) + y.bandwidth() / 2})`);

errorGroups
  .append("line")
  .attr("x1", (d) => x(Math.max(0, d.importance - d.std)))
  .attr("x2", (d) => x(d.importance + d.std))
  .attr("stroke", t.inkSoft)
  .attr("stroke-width", 2);

for (const cap of [-1, 1]) {
  errorGroups
    .append("line")
    .attr("x1", (d) => x(cap < 0 ? Math.max(0, d.importance - d.std) : d.importance + d.std))
    .attr("x2", (d) => x(cap < 0 ? Math.max(0, d.importance - d.std) : d.importance + d.std))
    .attr("y1", -6)
    .attr("y2", 6)
    .attr("stroke", t.inkSoft)
    .attr("stroke-width", 2);
}

// --- Bars -----------------------------------------------------------------
g.selectAll(".bar")
  .data(features)
  .join("rect")
  .attr("class", "bar")
  .attr("x", 0)
  .attr("y", (d) => y(d.name))
  .attr("width", (d) => x(d.importance))
  .attr("height", y.bandwidth())
  .attr("fill", (d) => color(d.importance))
  .attr("stroke", t.pageBg)
  .attr("stroke-width", 1);

// --- Value labels (importance score, right of the error cap) ----------------
g.selectAll(".value-label")
  .data(features)
  .join("text")
  .attr("class", "value-label")
  .attr("x", (d) => x(d.importance + d.std) + 14)
  .attr("y", (d) => y(d.name) + y.bandwidth() / 2)
  .attr("dy", "0.35em")
  .attr("fill", t.ink)
  .style("font-size", "15px")
  .style("font-variant-numeric", "tabular-nums")
  .text((d) => d.importance.toFixed(3));

// --- Axes -------------------------------------------------------------------
const xAxis = g.append("g").attr("transform", `translate(0,${ih})`).call(d3.axisBottom(x).ticks(6));
const yAxis = g.append("g").call(d3.axisLeft(y).tickSize(0));

for (const ax of [xAxis, yAxis]) {
  ax.selectAll("text").attr("fill", t.inkSoft).style("font-size", "14px");
  ax.selectAll("line").attr("stroke", t.grid);
  ax.select(".domain").attr("stroke", t.inkSoft);
}
yAxis.select(".domain").remove();
yAxis.selectAll("text").attr("dx", "-0.4em");

// --- Axis label ---------------------------------------------------------------
svg
  .append("text")
  .attr("x", margin.left + iw / 2)
  .attr("y", height - 24)
  .attr("text-anchor", "middle")
  .attr("fill", t.inkSoft)
  .style("font-size", "16px")
  .text("Feature Importance (Gini)");

// --- Title ------------------------------------------------------------------
svg
  .append("text")
  .attr("x", width / 2)
  .attr("y", 48)
  .attr("text-anchor", "middle")
  .attr("fill", t.ink)
  .style("font-size", "22px")
  .style("font-weight", "600")
  .text("bar-feature-importance · javascript · d3 · anyplot.ai");
Runnable source as JSON, for any HTTP client: https://api.anyplot.ai/specs/bar-feature-importance/d3/code. Any spec id and library id listed in llms-full.txt fit the same URL shape; every URL below is complete and callable.
{
  "spec_id": "bar-feature-importance",
  "language": "javascript",
  "library": "d3",
  "page": "https://anyplot.ai/bar-feature-importance/javascript/d3",
  "hub": "https://anyplot.ai/bar-feature-importance",
  "code_json": "https://api.anyplot.ai/specs/bar-feature-importance/d3/code",
  "spec_json": "https://api.anyplot.ai/specs/bar-feature-importance",
  "render_light_png": "https://storage.googleapis.com/anyplot-images/plots/bar-feature-importance/javascript/d3/plot-light.png",
  "render_dark_png": "https://storage.googleapis.com/anyplot-images/plots/bar-feature-importance/javascript/d3/plot-dark.png",
  "interactive_light_html": "https://storage.googleapis.com/anyplot-images/plots/bar-feature-importance/javascript/d3/plot-light.html",
  "interactive_dark_html": "https://storage.googleapis.com/anyplot-images/plots/bar-feature-importance/javascript/d3/plot-dark.html",
  "quality_score": 92.0,
  "license": "MIT",
  "guide": "https://anyplot.ai/llms.txt"
}
Part of Feature Importance Bar Chart on anyplot.ai.