The same plot in 14 other libraries — Python: Altair, Bokeh, lets-plot, Matplotlib, Plotly, plotnine, Pygal, Seaborn; R: ggplot2; JavaScript: Chart.js, D3.js, Apache ECharts, Highcharts, MUI X Charts. Compare all 15 side by side: Feature Importance Bar Chart in Python, R, Julia and JavaScript.
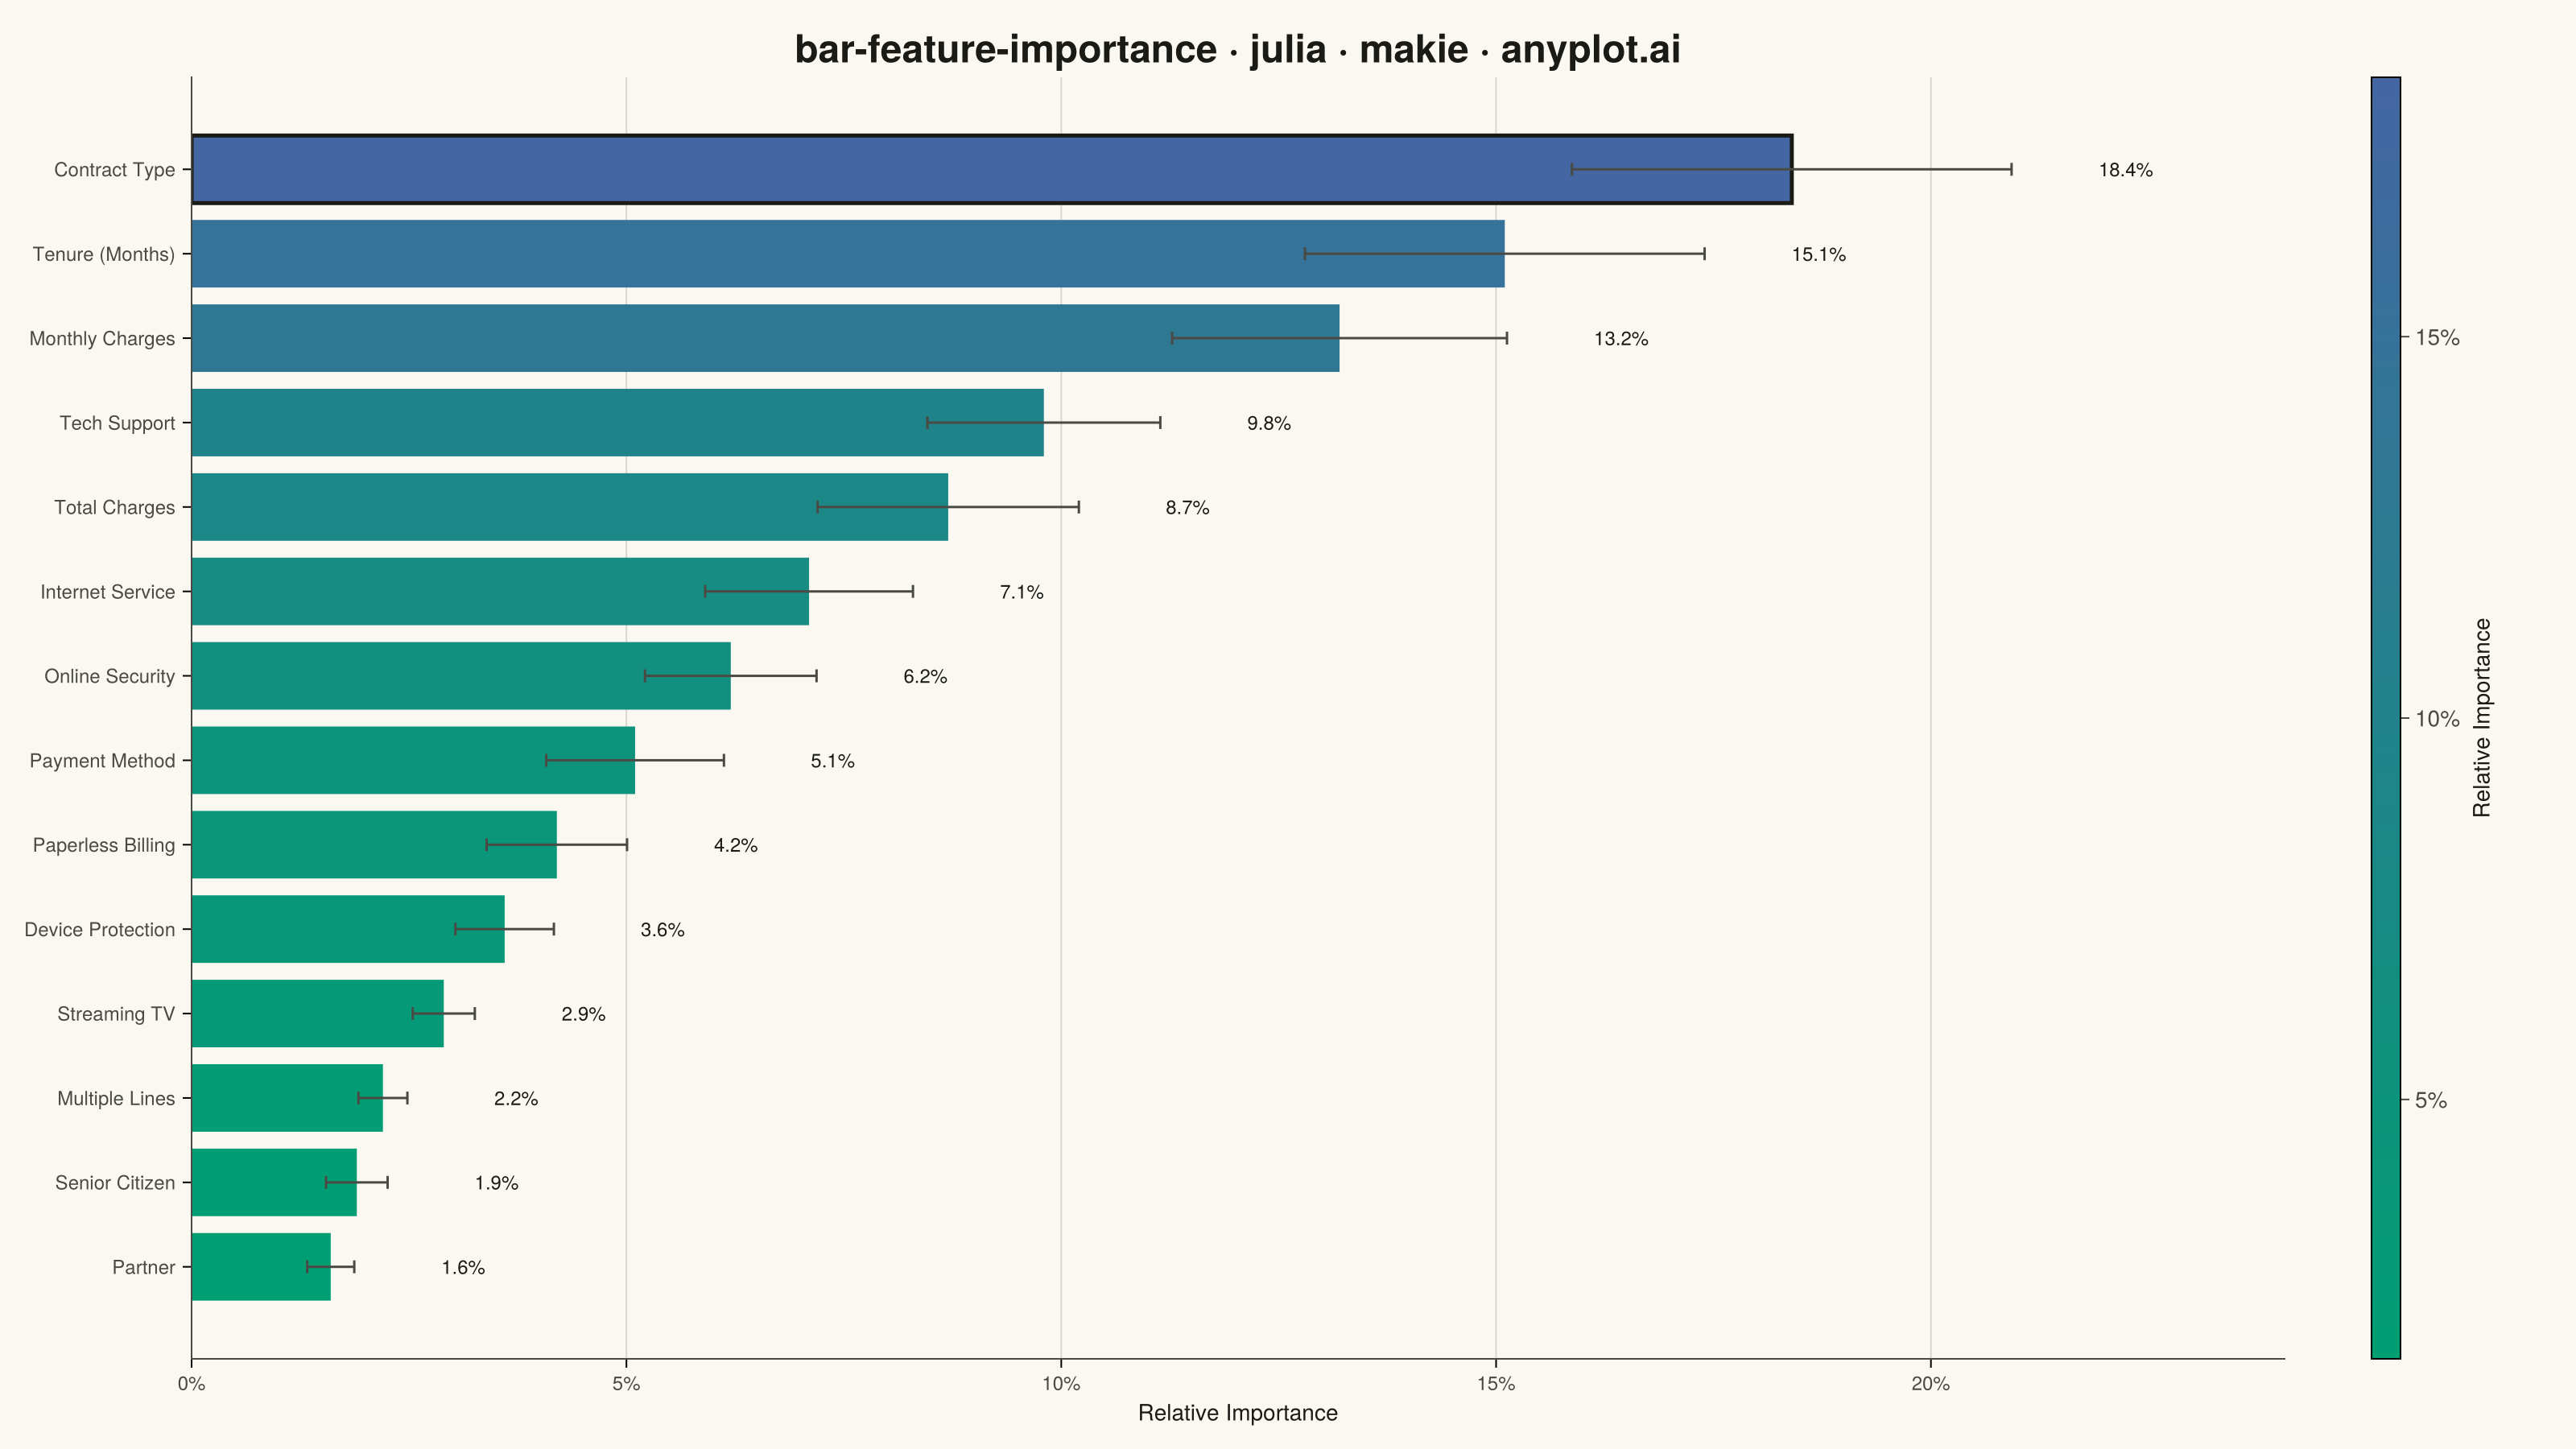
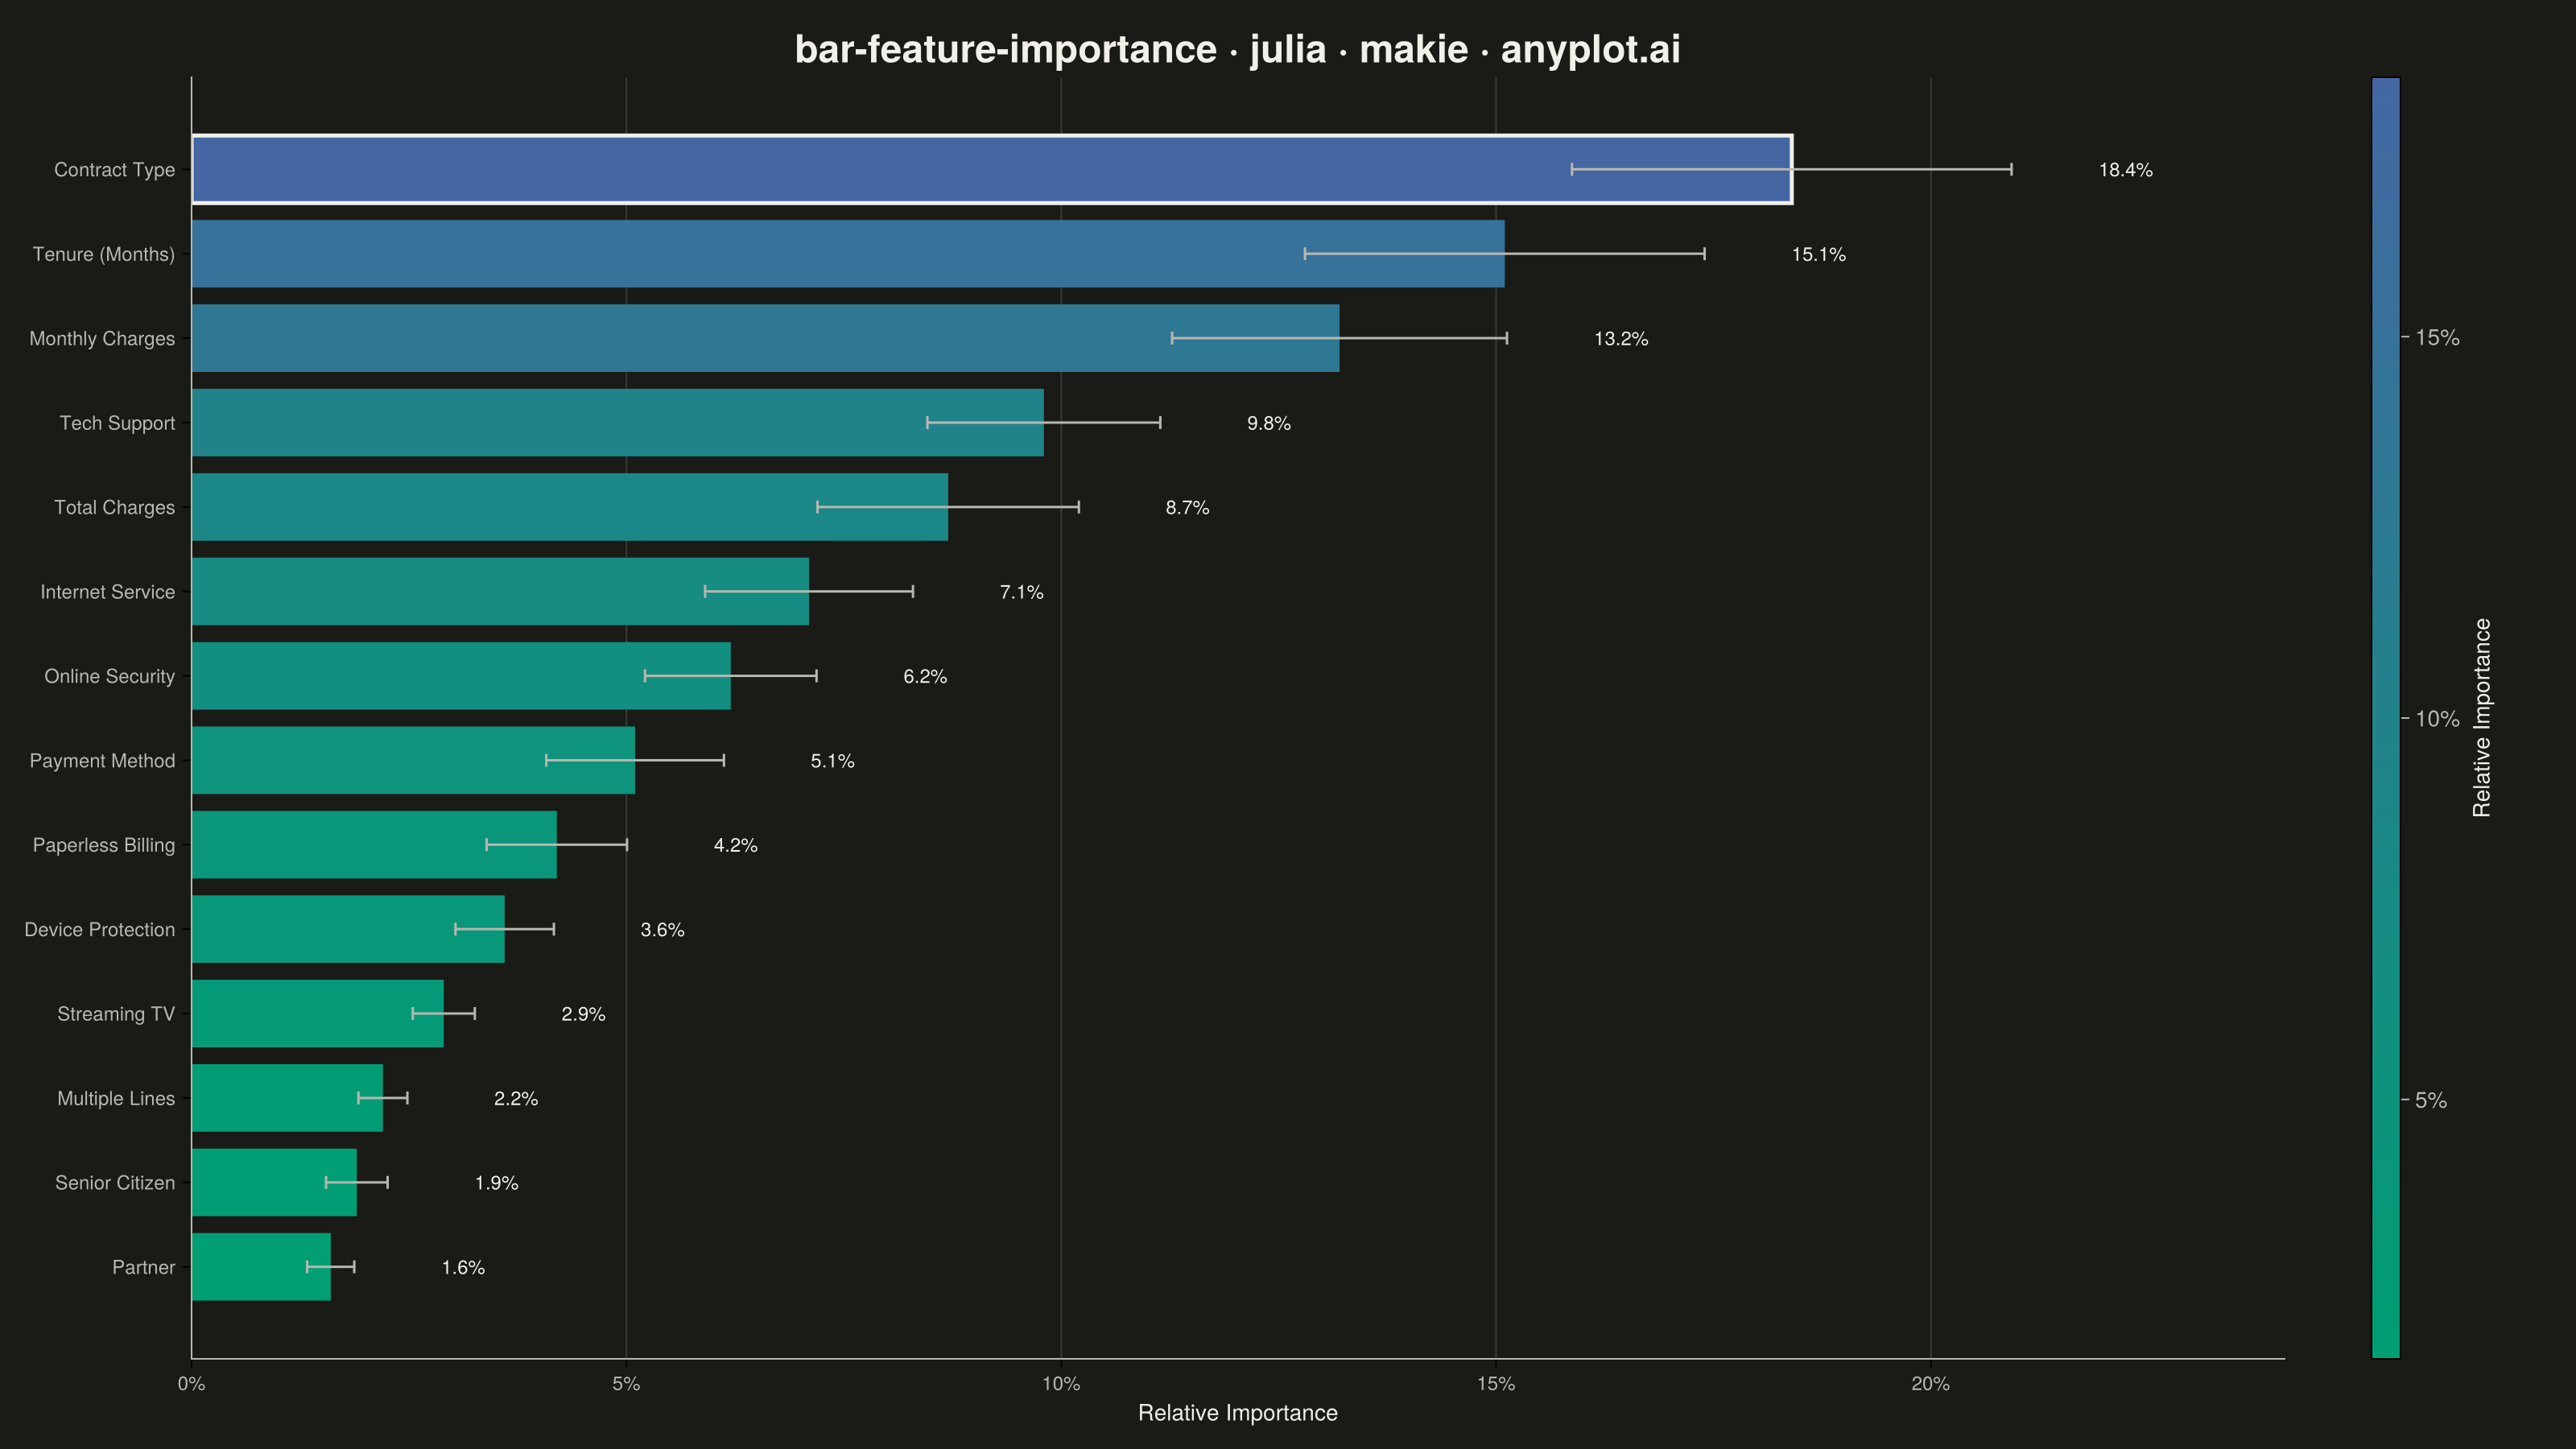
A horizontal bar chart displaying feature importances from machine learning models, with features sorted by importance value and bars colored by a gradient to emphasize relative contribution. This visualization is essential for model interpretability, helping data scientists and stakeholders understand which features drive model predictions. The horizontal orientation allows for readable feature names of varying lengths.
# anyplot.ai
# bar-feature-importance: Feature Importance Bar Chart
# Library: makie 0.21.9 | Julia 1.11.9
# Quality: 94/100 | Created: 2026-09-02

using CairoMakie
using Colors
using Random

Random.seed!(42)

# --- Theme tokens -------------------------------------------------------
const THEME    = get(ENV, "ANYPLOT_THEME", "light")
const PAGE_BG  = THEME == "light" ? colorant"#FAF8F1" : colorant"#1A1A17"
const INK      = THEME == "light" ? colorant"#1A1A17" : colorant"#F0EFE8"
const INK_SOFT = THEME == "light" ? colorant"#4A4A44" : colorant"#B8B7B0"

# Imprint sequential colormap (brand green -> blue) for continuous importance
const ANYPLOT_SEQ = cgrad([colorant"#009E73", colorant"#4467A3"])

# --- Data -----------------------------------------------------------------
# Feature importances from a random forest customer-churn model
feature_names = [
    "Contract Type", "Tenure (Months)", "Monthly Charges", "Tech Support",
    "Total Charges", "Internet Service", "Online Security", "Payment Method",
    "Paperless Billing", "Device Protection", "Streaming TV", "Multiple Lines",
    "Senior Citizen", "Partner",
]
n_features = length(feature_names)

raw_importance = [0.184, 0.151, 0.132, 0.098, 0.087, 0.071, 0.062, 0.051,
                   0.042, 0.036, 0.029, 0.022, 0.019, 0.016]
importance = raw_importance ./ sum(raw_importance)
std_dev = importance .* (0.12 .+ 0.10 .* rand(n_features))

# Sort ascending so the highest importance lands at the top of the chart
order = sortperm(importance)
feature_names = feature_names[order]
importance = importance[order]
std_dev = std_dev[order]
positions = 1:n_features

# Bolder outline on the top driver (highest importance, last row) as a callout
stroke_widths = [i == n_features ? 2.5 : 0.0 for i in 1:n_features]

# --- Plot -------------------------------------------------------------------
fig = Figure(
    size            = (1600, 900),
    fontsize        = 14,
    backgroundcolor = PAGE_BG,
)

ax = Axis(
    fig[1, 1];
    title             = "bar-feature-importance · julia · makie · anyplot.ai",
    titlesize         = 24,
    titlecolor        = INK,
    xlabel            = "Relative Importance",
    xlabelsize        = 14,
    xlabelcolor       = INK,
    ylabelcolor       = INK,
    xticklabelsize    = 12,
    yticklabelsize    = 12,
    xticklabelcolor   = INK_SOFT,
    yticklabelcolor   = INK_SOFT,
    xtickformat       = xs -> [string(round(Int, x * 100), "%") for x in xs],
    backgroundcolor   = PAGE_BG,
    topspinevisible   = false,
    rightspinevisible = false,
    leftspinecolor    = INK_SOFT,
    bottomspinecolor  = INK_SOFT,
    xgridcolor        = RGBAf(INK.r, INK.g, INK.b, 0.15),
    ygridvisible      = false,
    yticks            = (positions, feature_names),
)

barplot!(
    ax, positions, importance;
    direction   = :x,
    color       = importance,
    colormap    = ANYPLOT_SEQ,
    colorrange  = (minimum(importance), maximum(importance)),
    strokewidth = stroke_widths,
    strokecolor = INK,
)

errorbars!(
    ax, importance, positions, std_dev;
    direction    = :x,
    color        = INK_SOFT,
    whiskerwidth = 8,
    linewidth    = 1.5,
)

text!(
    ax, importance .+ std_dev .+ 0.010, positions;
    text     = [string(round(v * 100, digits = 1), "%") for v in importance],
    align    = (:left, :center),
    color    = INK,
    fontsize = 12,
)

xlims!(ax, 0, maximum(importance .+ std_dev) * 1.15)

Colorbar(
    fig[1, 2];
    colormap       = ANYPLOT_SEQ,
    colorrange     = (minimum(importance), maximum(importance)),
    label          = "Relative Importance",
    labelcolor     = INK,
    ticklabelcolor = INK_SOFT,
    tickcolor      = INK_SOFT,
    tickformat     = xs -> [string(round(Int, x * 100), "%") for x in xs],
    width          = 18,
)
colsize!(fig.layout, 2, Fixed(90))

# --- Save -------------------------------------------------------------------
save("plot-$(THEME).png", fig; px_per_unit = 2)
Runnable source as JSON, for any HTTP client: https://api.anyplot.ai/specs/bar-feature-importance/makie/code. Any spec id and library id listed in llms-full.txt fit the same URL shape; every URL below is complete and callable.
{
  "spec_id": "bar-feature-importance",
  "language": "julia",
  "library": "makie",
  "page": "https://anyplot.ai/bar-feature-importance/julia/makie",
  "hub": "https://anyplot.ai/bar-feature-importance",
  "code_json": "https://api.anyplot.ai/specs/bar-feature-importance/makie/code",
  "spec_json": "https://api.anyplot.ai/specs/bar-feature-importance",
  "render_light_png": "https://storage.googleapis.com/anyplot-images/plots/bar-feature-importance/julia/makie/plot-light.png",
  "render_dark_png": "https://storage.googleapis.com/anyplot-images/plots/bar-feature-importance/julia/makie/plot-dark.png",
  "quality_score": 94.0,
  "license": "MIT",
  "guide": "https://anyplot.ai/llms.txt"
}
Part of Feature Importance Bar Chart on anyplot.ai.