The same plot in 14 other libraries — JavaScript: D3.js, Apache ECharts, Highcharts, MUI X Charts; Python: Altair, Bokeh, lets-plot, Matplotlib, Plotly, plotnine, Pygal, Seaborn; R: ggplot2; Julia: Makie.jl. Compare all 15 side by side: Permutation Feature Importance Plot in Python, R, Julia and JavaScript.
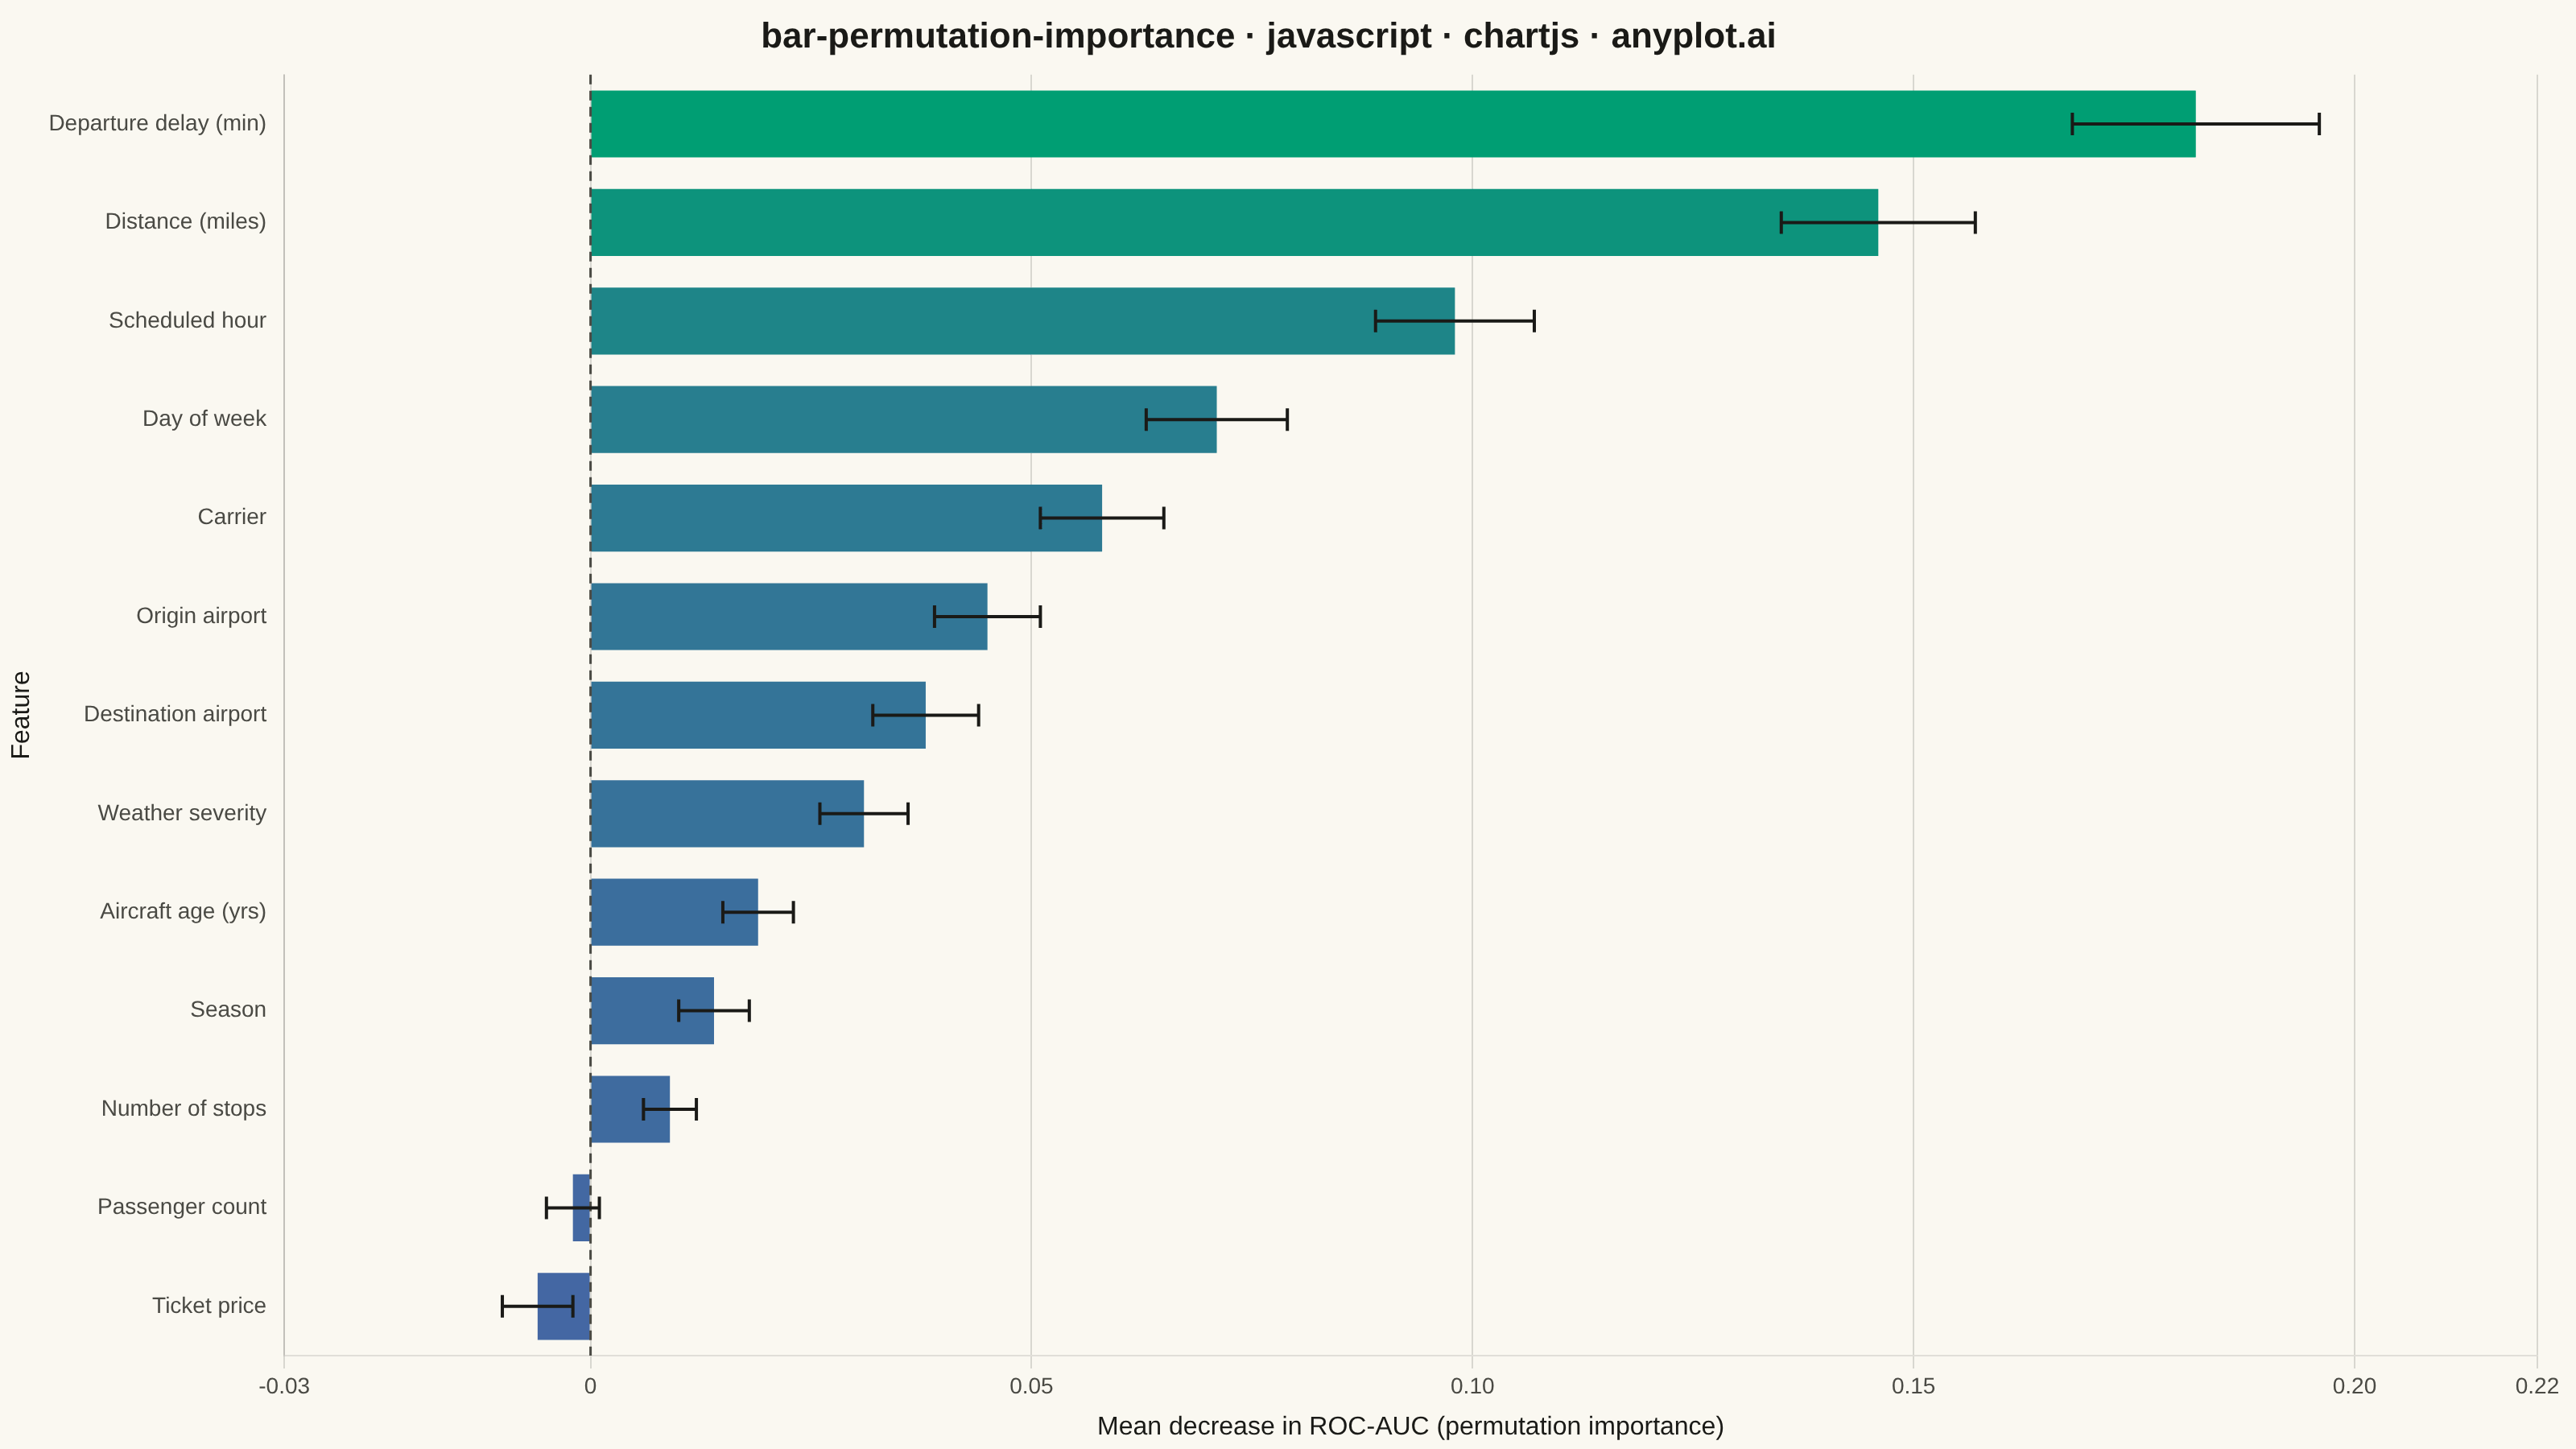
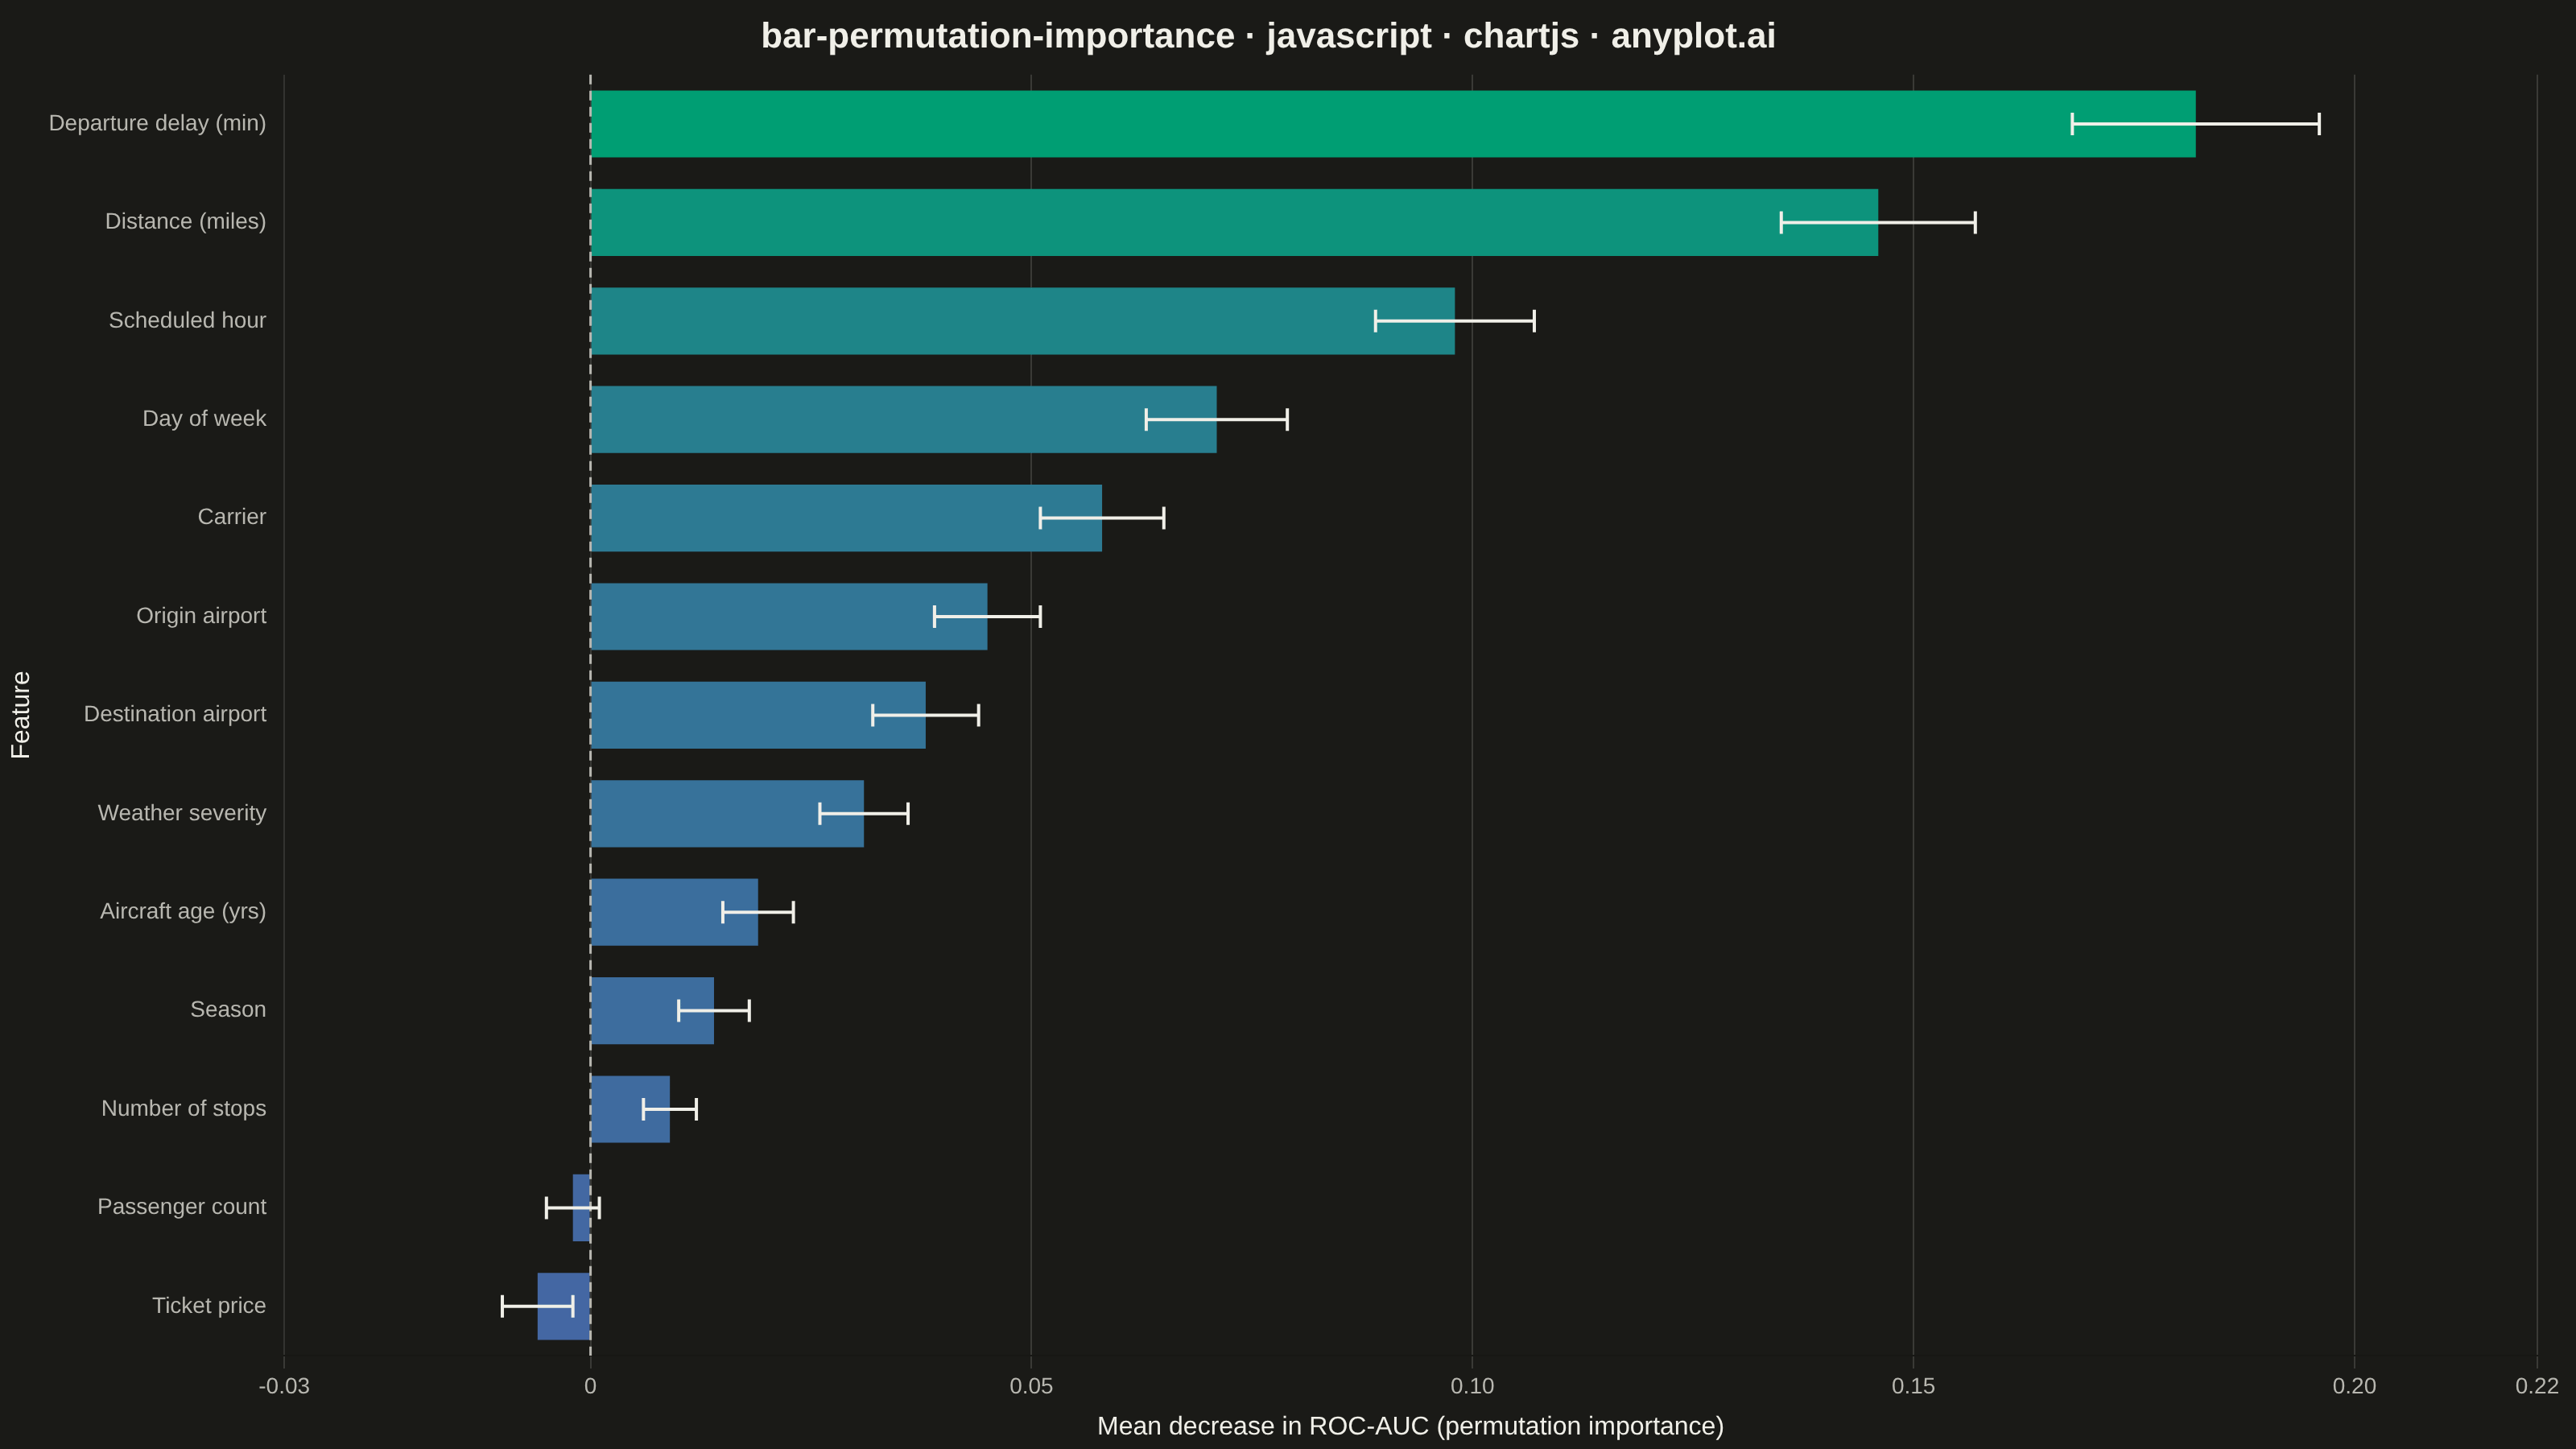
A horizontal bar chart displaying permutation feature importance from machine learning models, showing the decrease in model score when each feature is randomly shuffled. Unlike model-specific feature importances, permutation importance is model-agnostic and measures how much the model's performance degrades when a feature's relationship with the target is broken. Error bars indicate variability across multiple shuffles, providing a confidence measure for each importance score.
// anyplot.ai
// bar-permutation-importance: Permutation Feature Importance Plot
// Library: chartjs 4.4.7 | JavaScript 22.23.2
// Quality: 92/100 | Created: 2026-08-26

const t = window.ANYPLOT_TOKENS;

// --- Data (in-memory, deterministic) ----------------------------------------
// sklearn.inspection.permutation_importance-style output (n_repeats=10) for a
// flight-delay classifier: mean decrease in ROC-AUC when each feature is
// shuffled, sorted descending so the most important feature sits on top.
const rows = [
  { feature: "Departure delay (min)", mean: 0.182, std: 0.014 },
  { feature: "Distance (miles)", mean: 0.146, std: 0.011 },
  { feature: "Scheduled hour", mean: 0.098, std: 0.009 },
  { feature: "Day of week", mean: 0.071, std: 0.008 },
  { feature: "Carrier", mean: 0.058, std: 0.007 },
  { feature: "Origin airport", mean: 0.045, std: 0.006 },
  { feature: "Destination airport", mean: 0.038, std: 0.006 },
  { feature: "Weather severity", mean: 0.031, std: 0.005 },
  { feature: "Aircraft age (yrs)", mean: 0.019, std: 0.004 },
  { feature: "Season", mean: 0.014, std: 0.004 },
  { feature: "Number of stops", mean: 0.009, std: 0.003 },
  { feature: "Passenger count", mean: -0.002, std: 0.003 },
  { feature: "Ticket price", mean: -0.006, std: 0.004 },
];

const labels = rows.map((r) => r.feature);
const means = rows.map((r) => r.mean);
const stds = rows.map((r) => r.std);

// --- Color: sequential gradient mapped to importance (continuous, not categorical)
function hexToRgb(hex) {
  const n = parseInt(hex.slice(1), 16);
  return [(n >> 16) & 255, (n >> 8) & 255, n & 255];
}
function lerpColor(hexA, hexB, frac) {
  const [r1, g1, b1] = hexToRgb(hexA);
  const [r2, g2, b2] = hexToRgb(hexB);
  const r = Math.round(r1 + (r2 - r1) * frac);
  const g = Math.round(g1 + (g2 - g1) * frac);
  const b = Math.round(b1 + (b2 - b1) * frac);
  return `rgb(${r}, ${g}, ${b})`;
}

const [seqLo, seqHi] = t.seq; // imprint_seq: ["#009E73", "#4467A3"]
const maxMean = Math.max(...means);
const minMean = Math.min(...means);
// Highest-importance features get brand green (visual emphasis); least
// important fade toward blue.
const barColors = means.map((m) => lerpColor(seqLo, seqHi, 1 - (m - minMean) / (maxMean - minMean)));

// --- Value-axis range: must fit the mean ± std whiskers, not just the bars
const lo = Math.min(...rows.map((r) => r.mean - r.std));
const hi = Math.max(...rows.map((r) => r.mean + r.std));
const pad = (hi - lo) * 0.12;

// --- Mount -------------------------------------------------------------------
const canvas = document.createElement("canvas");
document.getElementById("container").appendChild(canvas);

// --- Custom plugins (core Chart.js Plugin API — no external packages) -------
const zeroLinePlugin = {
  id: "zeroLine",
  afterDatasetsDraw(chart) {
    const {
      ctx,
      scales: { x },
      chartArea: { top, bottom },
    } = chart;
    const xZero = x.getPixelForValue(0);
    ctx.save();
    ctx.strokeStyle = t.inkSoft;
    ctx.lineWidth = 1.5;
    ctx.setLineDash([6, 4]);
    ctx.beginPath();
    ctx.moveTo(xZero, top);
    ctx.lineTo(xZero, bottom);
    ctx.stroke();
    ctx.restore();
  },
};

const errorBarsPlugin = {
  id: "errorBars",
  afterDatasetsDraw(chart) {
    const {
      ctx,
      scales: { x },
    } = chart;
    const meta = chart.getDatasetMeta(0);
    ctx.save();
    ctx.strokeStyle = t.ink;
    ctx.lineWidth = 2;
    const capHalf = 7;
    meta.data.forEach((bar, i) => {
      const y = bar.y;
      const xLo = x.getPixelForValue(means[i] - stds[i]);
      const xHi = x.getPixelForValue(means[i] + stds[i]);
      ctx.beginPath();
      ctx.moveTo(xLo, y);
      ctx.lineTo(xHi, y);
      ctx.moveTo(xLo, y - capHalf);
      ctx.lineTo(xLo, y + capHalf);
      ctx.moveTo(xHi, y - capHalf);
      ctx.lineTo(xHi, y + capHalf);
      ctx.stroke();
    });
    ctx.restore();
  },
};

// --- Chart ---------------------------------------------------------------
new Chart(canvas, {
  type: "bar",
  data: {
    labels,
    datasets: [
      {
        data: means,
        backgroundColor: barColors,
        borderWidth: 0,
        barPercentage: 0.85,
        categoryPercentage: 0.8,
      },
    ],
  },
  options: {
    indexAxis: "y",
    responsive: true,
    maintainAspectRatio: false,
    animation: false,
    layout: { padding: { right: 24 } },
    plugins: {
      title: {
        display: true,
        text: "bar-permutation-importance · javascript · chartjs · anyplot.ai",
        color: t.ink,
        font: { size: 22 },
      },
      legend: { display: false },
    },
    scales: {
      x: {
        min: lo - pad,
        max: hi + pad,
        ticks: { color: t.inkSoft, font: { size: 14 } },
        grid: { color: t.grid },
        title: { display: true, text: "Mean decrease in ROC-AUC (permutation importance)", color: t.ink, font: { size: 16 } },
      },
      y: {
        ticks: { color: t.inkSoft, font: { size: 14 } },
        grid: { display: false },
        title: { display: true, text: "Feature", color: t.ink, font: { size: 16 } },
      },
    },
  },
  plugins: [zeroLinePlugin, errorBarsPlugin],
});
Runnable source as JSON, for any HTTP client: https://api.anyplot.ai/specs/bar-permutation-importance/chartjs/code. Any spec id and library id listed in llms-full.txt fit the same URL shape; every URL below is complete and callable.
{
  "spec_id": "bar-permutation-importance",
  "language": "javascript",
  "library": "chartjs",
  "page": "https://anyplot.ai/bar-permutation-importance/javascript/chartjs",
  "hub": "https://anyplot.ai/bar-permutation-importance",
  "code_json": "https://api.anyplot.ai/specs/bar-permutation-importance/chartjs/code",
  "spec_json": "https://api.anyplot.ai/specs/bar-permutation-importance",
  "render_light_png": "https://storage.googleapis.com/anyplot-images/plots/bar-permutation-importance/javascript/chartjs/plot-light.png",
  "render_dark_png": "https://storage.googleapis.com/anyplot-images/plots/bar-permutation-importance/javascript/chartjs/plot-dark.png",
  "interactive_light_html": "https://storage.googleapis.com/anyplot-images/plots/bar-permutation-importance/javascript/chartjs/plot-light.html",
  "interactive_dark_html": "https://storage.googleapis.com/anyplot-images/plots/bar-permutation-importance/javascript/chartjs/plot-dark.html",
  "quality_score": 92.0,
  "license": "MIT",
  "guide": "https://anyplot.ai/llms.txt"
}
Part of Permutation Feature Importance Plot on anyplot.ai.