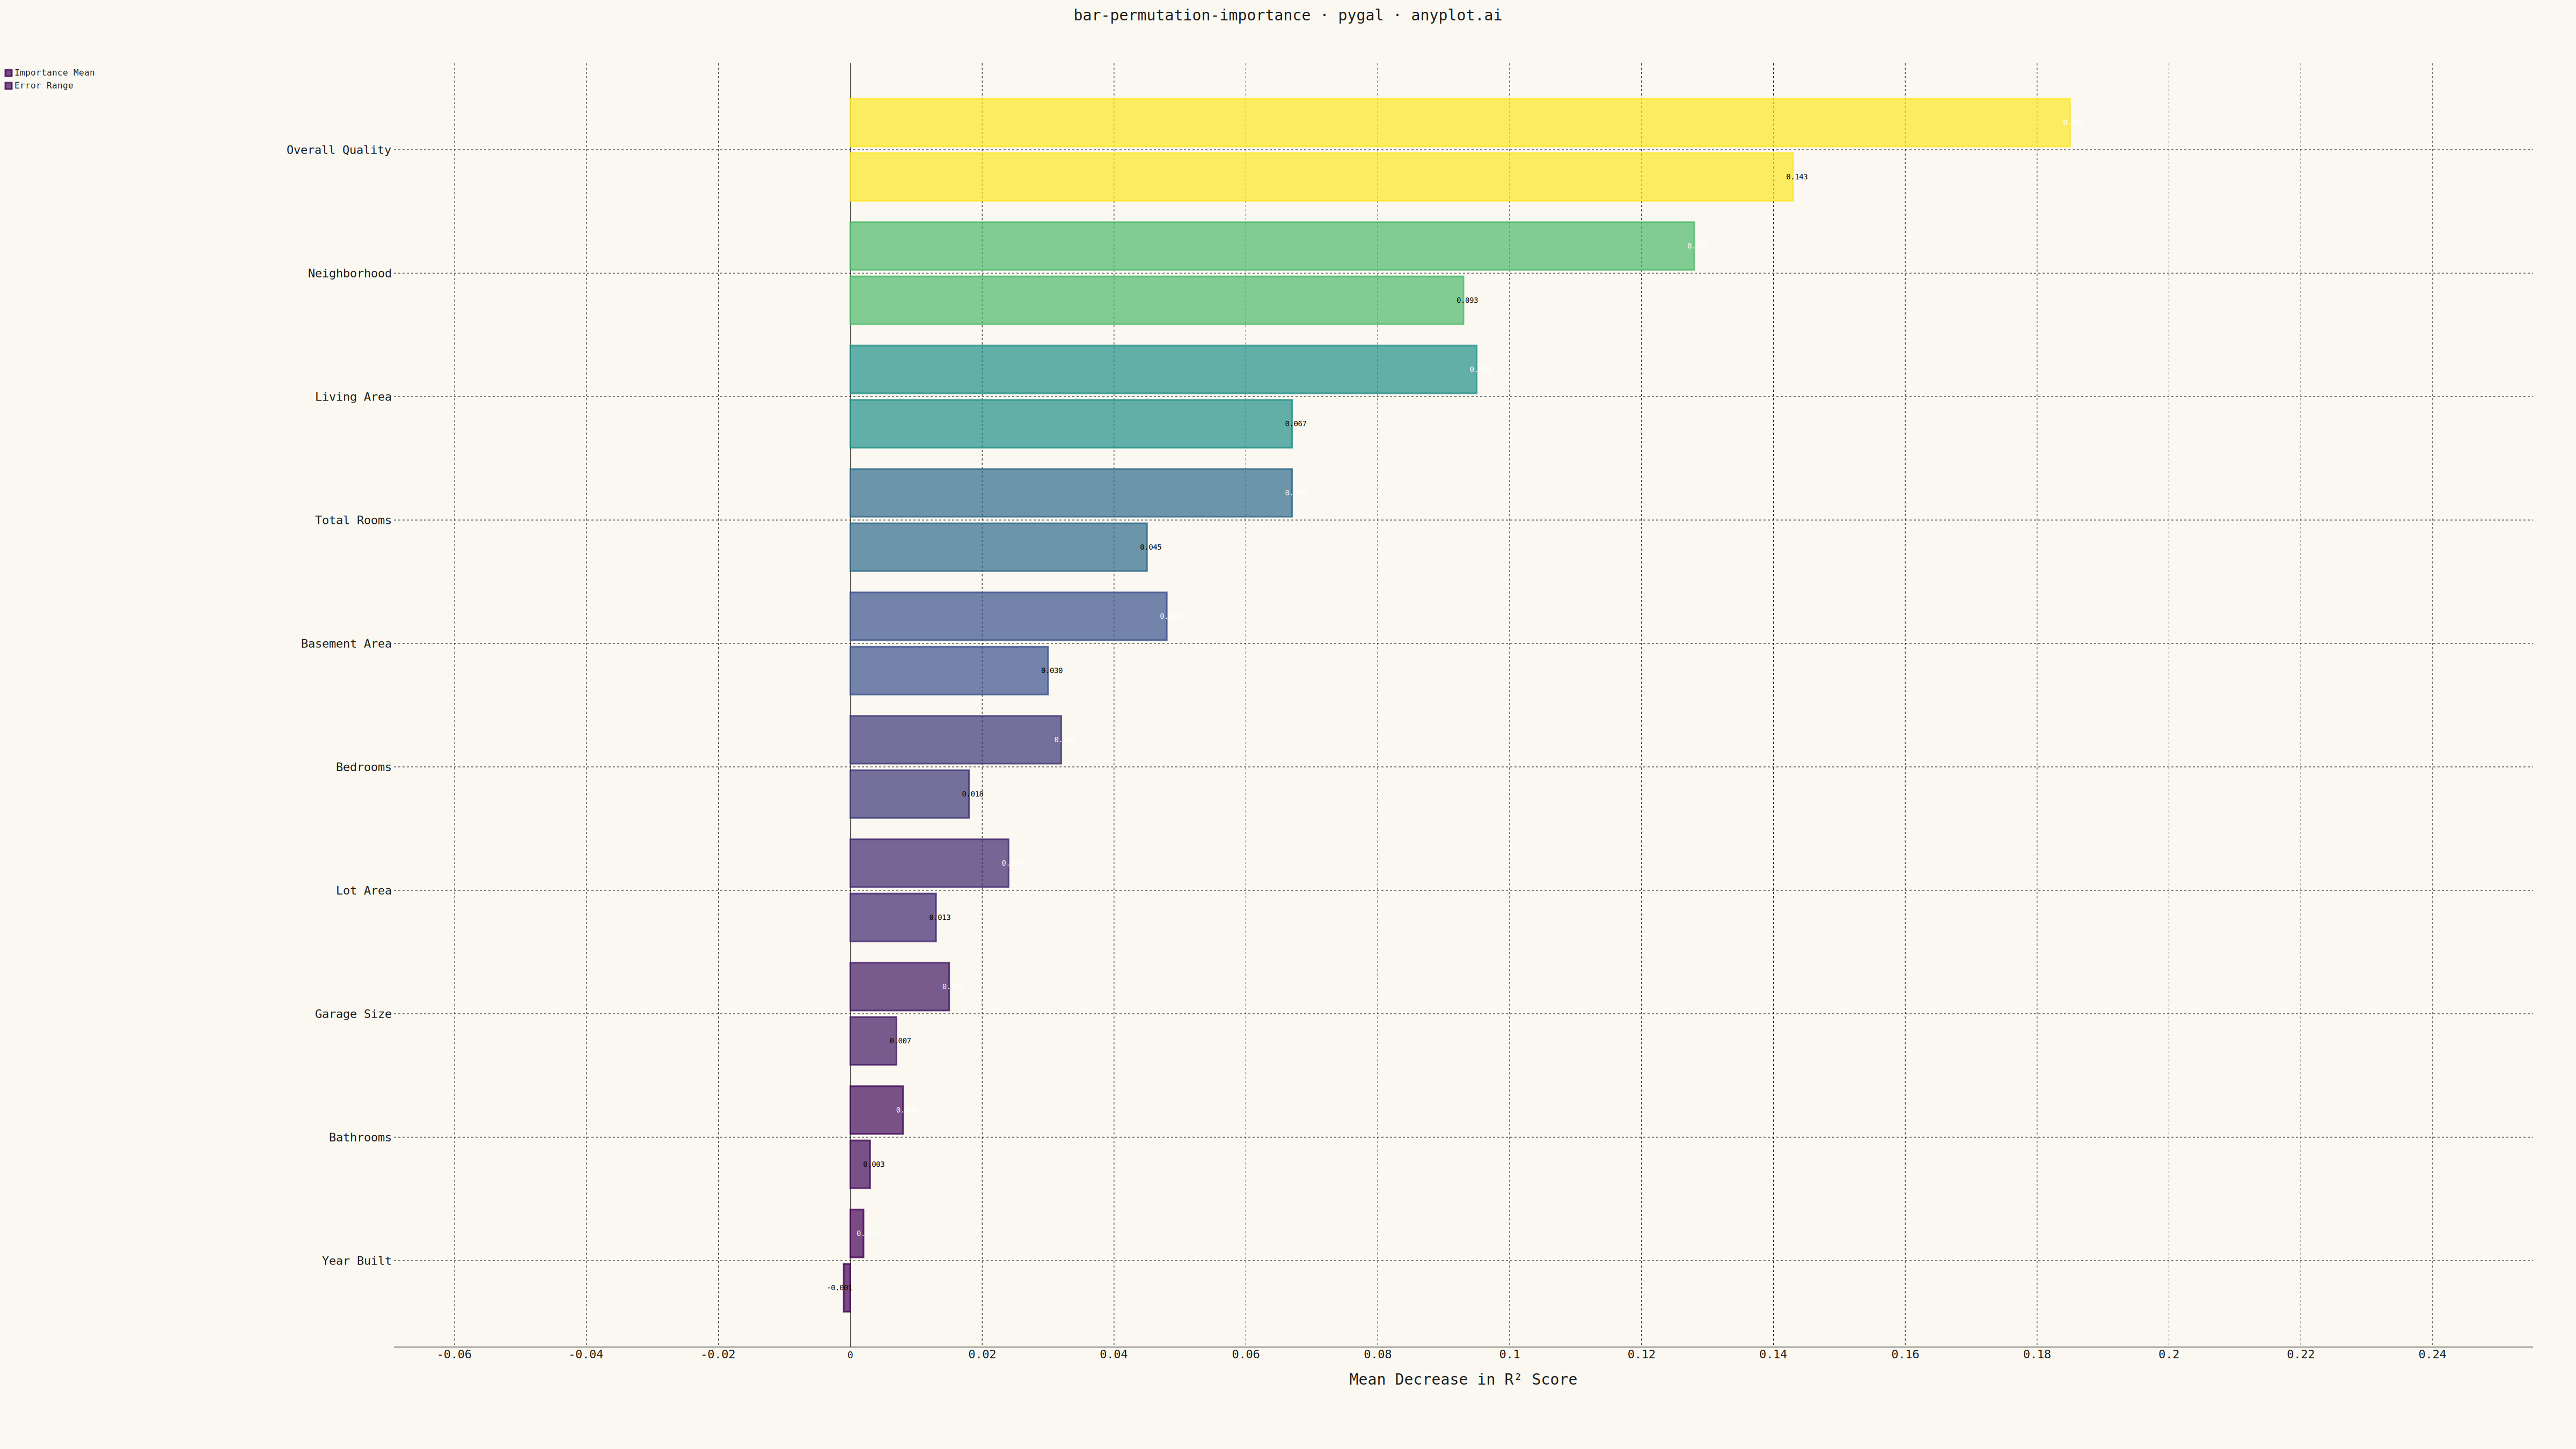
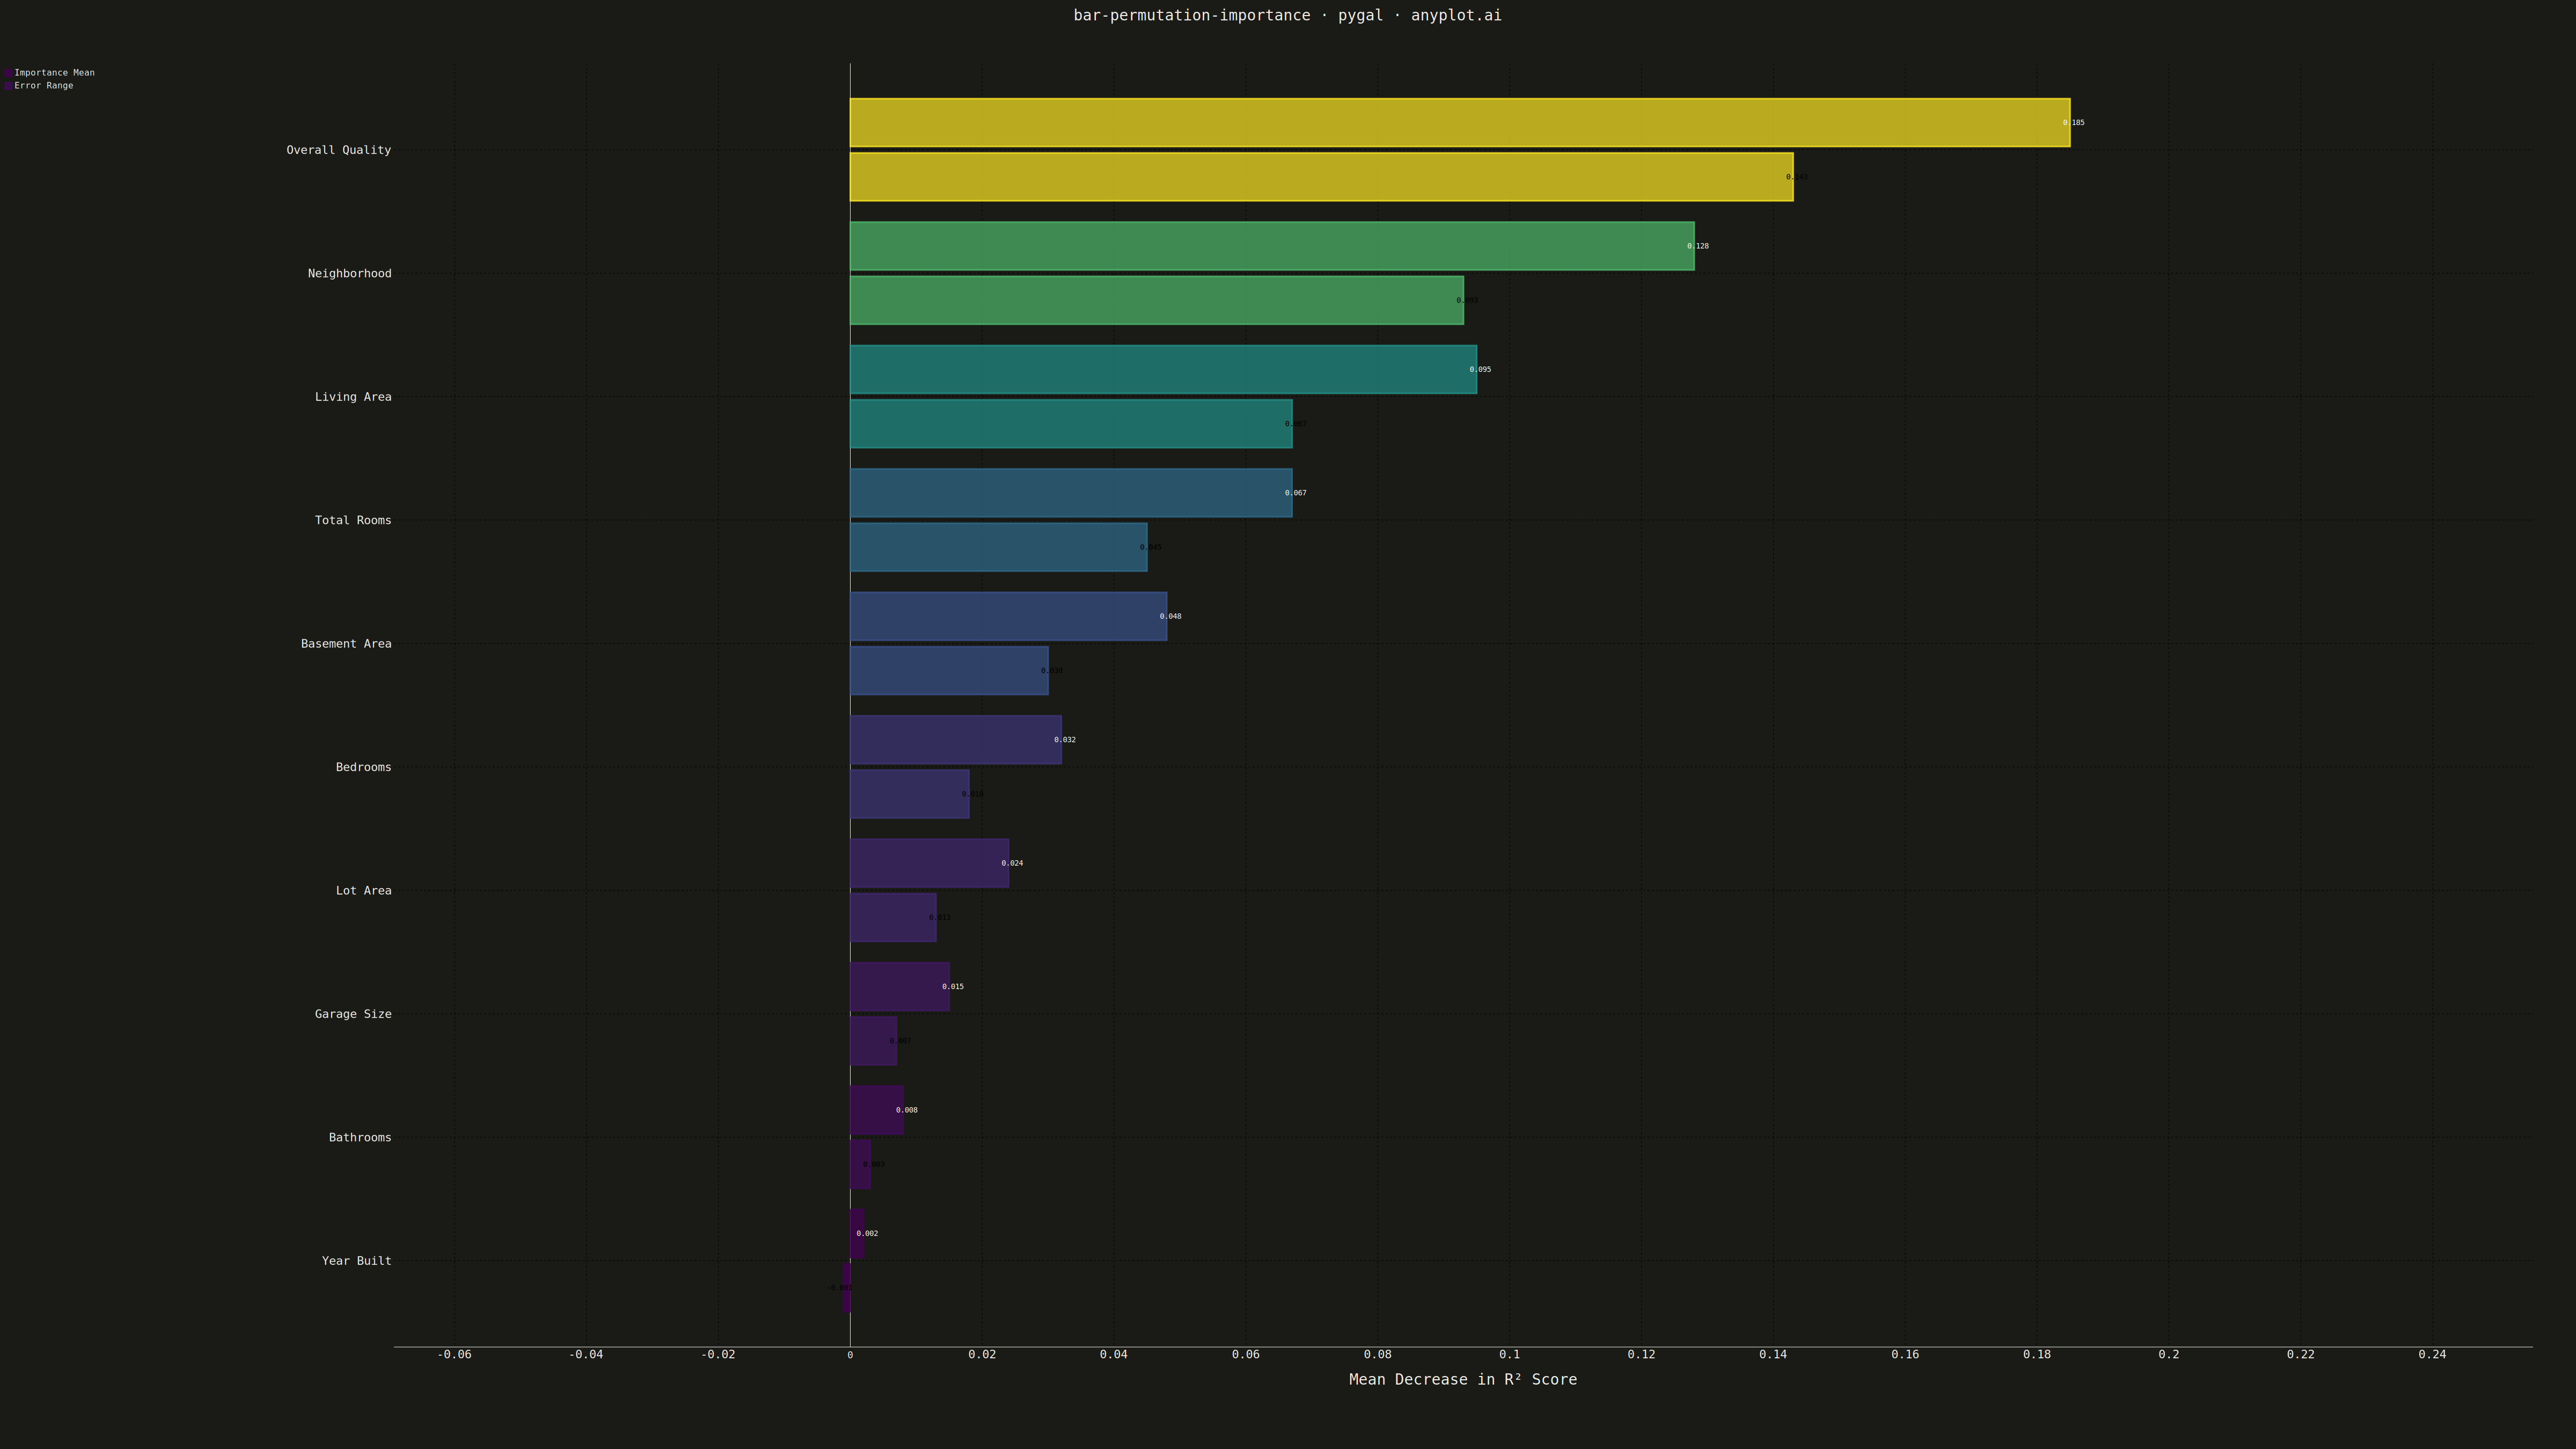
A horizontal bar chart displaying permutation feature importance from machine learning models, showing the decrease in model score when each feature is randomly shuffled. Unlike model-specific feature importances, permutation importance is model-agnostic and measures how much the model's performance degrades when a feature's relationship with the target is broken. Error bars indicate variability across multiple shuffles, providing a confidence measure for each importance score.
""" anyplot.ai
bar-permutation-importance: Permutation Feature Importance Plot
Library: pygal 3.1.0 | Python 3.13.13
Quality: 86/100 | Updated: 2026-05-17
"""

import os
import sys

import numpy as np


# Temporarily remove current directory from path to avoid name collision with pygal module
_cwd = sys.path[0] if sys.path[0] else "."
if _cwd in sys.path:
    sys.path.remove(_cwd)

import pygal
from pygal.style import Style


# Restore path
sys.path.insert(0, _cwd)

# Theme tokens
THEME = os.getenv("ANYPLOT_THEME", "light")
PAGE_BG = "#FAF8F1" if THEME == "light" else "#1A1A17"
INK = "#1A1A17" if THEME == "light" else "#F0EFE8"
INK_SOFT = "#4A4A44" if THEME == "light" else "#B8B7B0"

# Data - Simulated permutation importance results
np.random.seed(42)

features = [
    "Year Built",
    "Bathrooms",
    "Garage Size",
    "Lot Area",
    "Bedrooms",
    "Basement Area",
    "Total Rooms",
    "Living Area",
    "Neighborhood",
    "Overall Quality",
]

importance_mean = np.array([0.002, 0.008, 0.015, 0.024, 0.032, 0.048, 0.067, 0.095, 0.128, 0.185])
importance_std = np.array([0.003, 0.005, 0.008, 0.011, 0.014, 0.018, 0.022, 0.028, 0.035, 0.042])

# Generate viridis color gradient for importance values
# Inline color generation without helper function
min_imp = importance_mean.min()
max_imp = importance_mean.max()
imp_range = max_imp - min_imp if max_imp != min_imp else 1.0
viridis_stops = [(0.0, 68, 1, 84), (0.25, 58, 82, 139), (0.5, 32, 144, 140), (0.75, 94, 201, 97), (1.0, 253, 231, 36)]

bar_colors = []
for imp in importance_mean:
    t = (imp - min_imp) / imp_range
    for j in range(len(viridis_stops) - 1):
        t0, r0, g0, b0 = viridis_stops[j]
        t1, r1, g1, b1 = viridis_stops[j + 1]
        if t0 <= t <= t1:
            seg_t = (t - t0) / (t1 - t0)
            r = int(r0 + (r1 - r0) * seg_t)
            g = int(g0 + (g1 - g0) * seg_t)
            b = int(b0 + (b1 - b0) * seg_t)
            bar_colors.append(f"#{r:02x}{g:02x}{b:02x}")
            break
    else:
        bar_colors.append("#fde724")

# Custom style with theme-adaptive colors and large fonts
custom_style = Style(
    background=PAGE_BG,
    plot_background=PAGE_BG,
    foreground=INK,
    foreground_strong=INK,
    foreground_subtle=INK_SOFT,
    colors=tuple(bar_colors),
    title_font_size=28,
    label_font_size=22,
    major_label_font_size=18,
    legend_font_size=16,
    value_font_size=14,
    stroke_width=3,
)

# Create horizontal bar chart
chart = pygal.HorizontalBar(
    width=4800,
    height=2700,
    style=custom_style,
    title="bar-permutation-importance · pygal · anyplot.ai",
    x_title="Mean Decrease in R² Score",
    show_legend=False,
    print_values=True,
    print_values_position="top",
    show_y_guides=False,
    show_x_guides=True,
    range=(0, importance_mean.max() + importance_std.max() + 0.02),
    margin_bottom=120,
    margin_left=360,
    margin_right=80,
    margin_top=80,
)

# Set feature labels
chart.x_labels = features

# Add mean importance bars with viridis gradient colors
chart.add(
    "Importance",
    [
        {"value": mean, "color": color, "xlink": {"href": "#"}, "label": f"Mean: {mean:.3f} ± {std:.3f}"}
        for mean, std, color in zip(importance_mean, importance_std, bar_colors, strict=True)
    ],
    formatter=lambda x: f"{x:.3f}" if x else "",
)

# Save outputs
chart.render_to_file(f"plot-{THEME}.html")
chart.render_to_png(f"plot-{THEME}.png")
Runnable source as JSON, for any HTTP client: https://api.anyplot.ai/specs/bar-permutation-importance/pygal/code. Any spec id and library id listed in llms-full.txt fit the same URL shape; every URL below is complete and callable.
{
  "spec_id": "bar-permutation-importance",
  "language": "python",
  "library": "pygal",
  "page": "https://anyplot.ai/bar-permutation-importance/python/pygal",
  "hub": "https://anyplot.ai/bar-permutation-importance",
  "code_json": "https://api.anyplot.ai/specs/bar-permutation-importance/pygal/code",
  "spec_json": "https://api.anyplot.ai/specs/bar-permutation-importance",
  "render_light_png": "https://storage.googleapis.com/anyplot-images/plots/bar-permutation-importance/python/pygal/plot-light.png",
  "render_dark_png": "https://storage.googleapis.com/anyplot-images/plots/bar-permutation-importance/python/pygal/plot-dark.png",
  "interactive_light_html": "https://storage.googleapis.com/anyplot-images/plots/bar-permutation-importance/python/pygal/plot-light.html",
  "interactive_dark_html": "https://storage.googleapis.com/anyplot-images/plots/bar-permutation-importance/python/pygal/plot-dark.html",
  "quality_score": 86.0,
  "license": "MIT",
  "guide": "https://anyplot.ai/llms.txt"
}
Part of Permutation Feature Importance Plot on anyplot.ai.