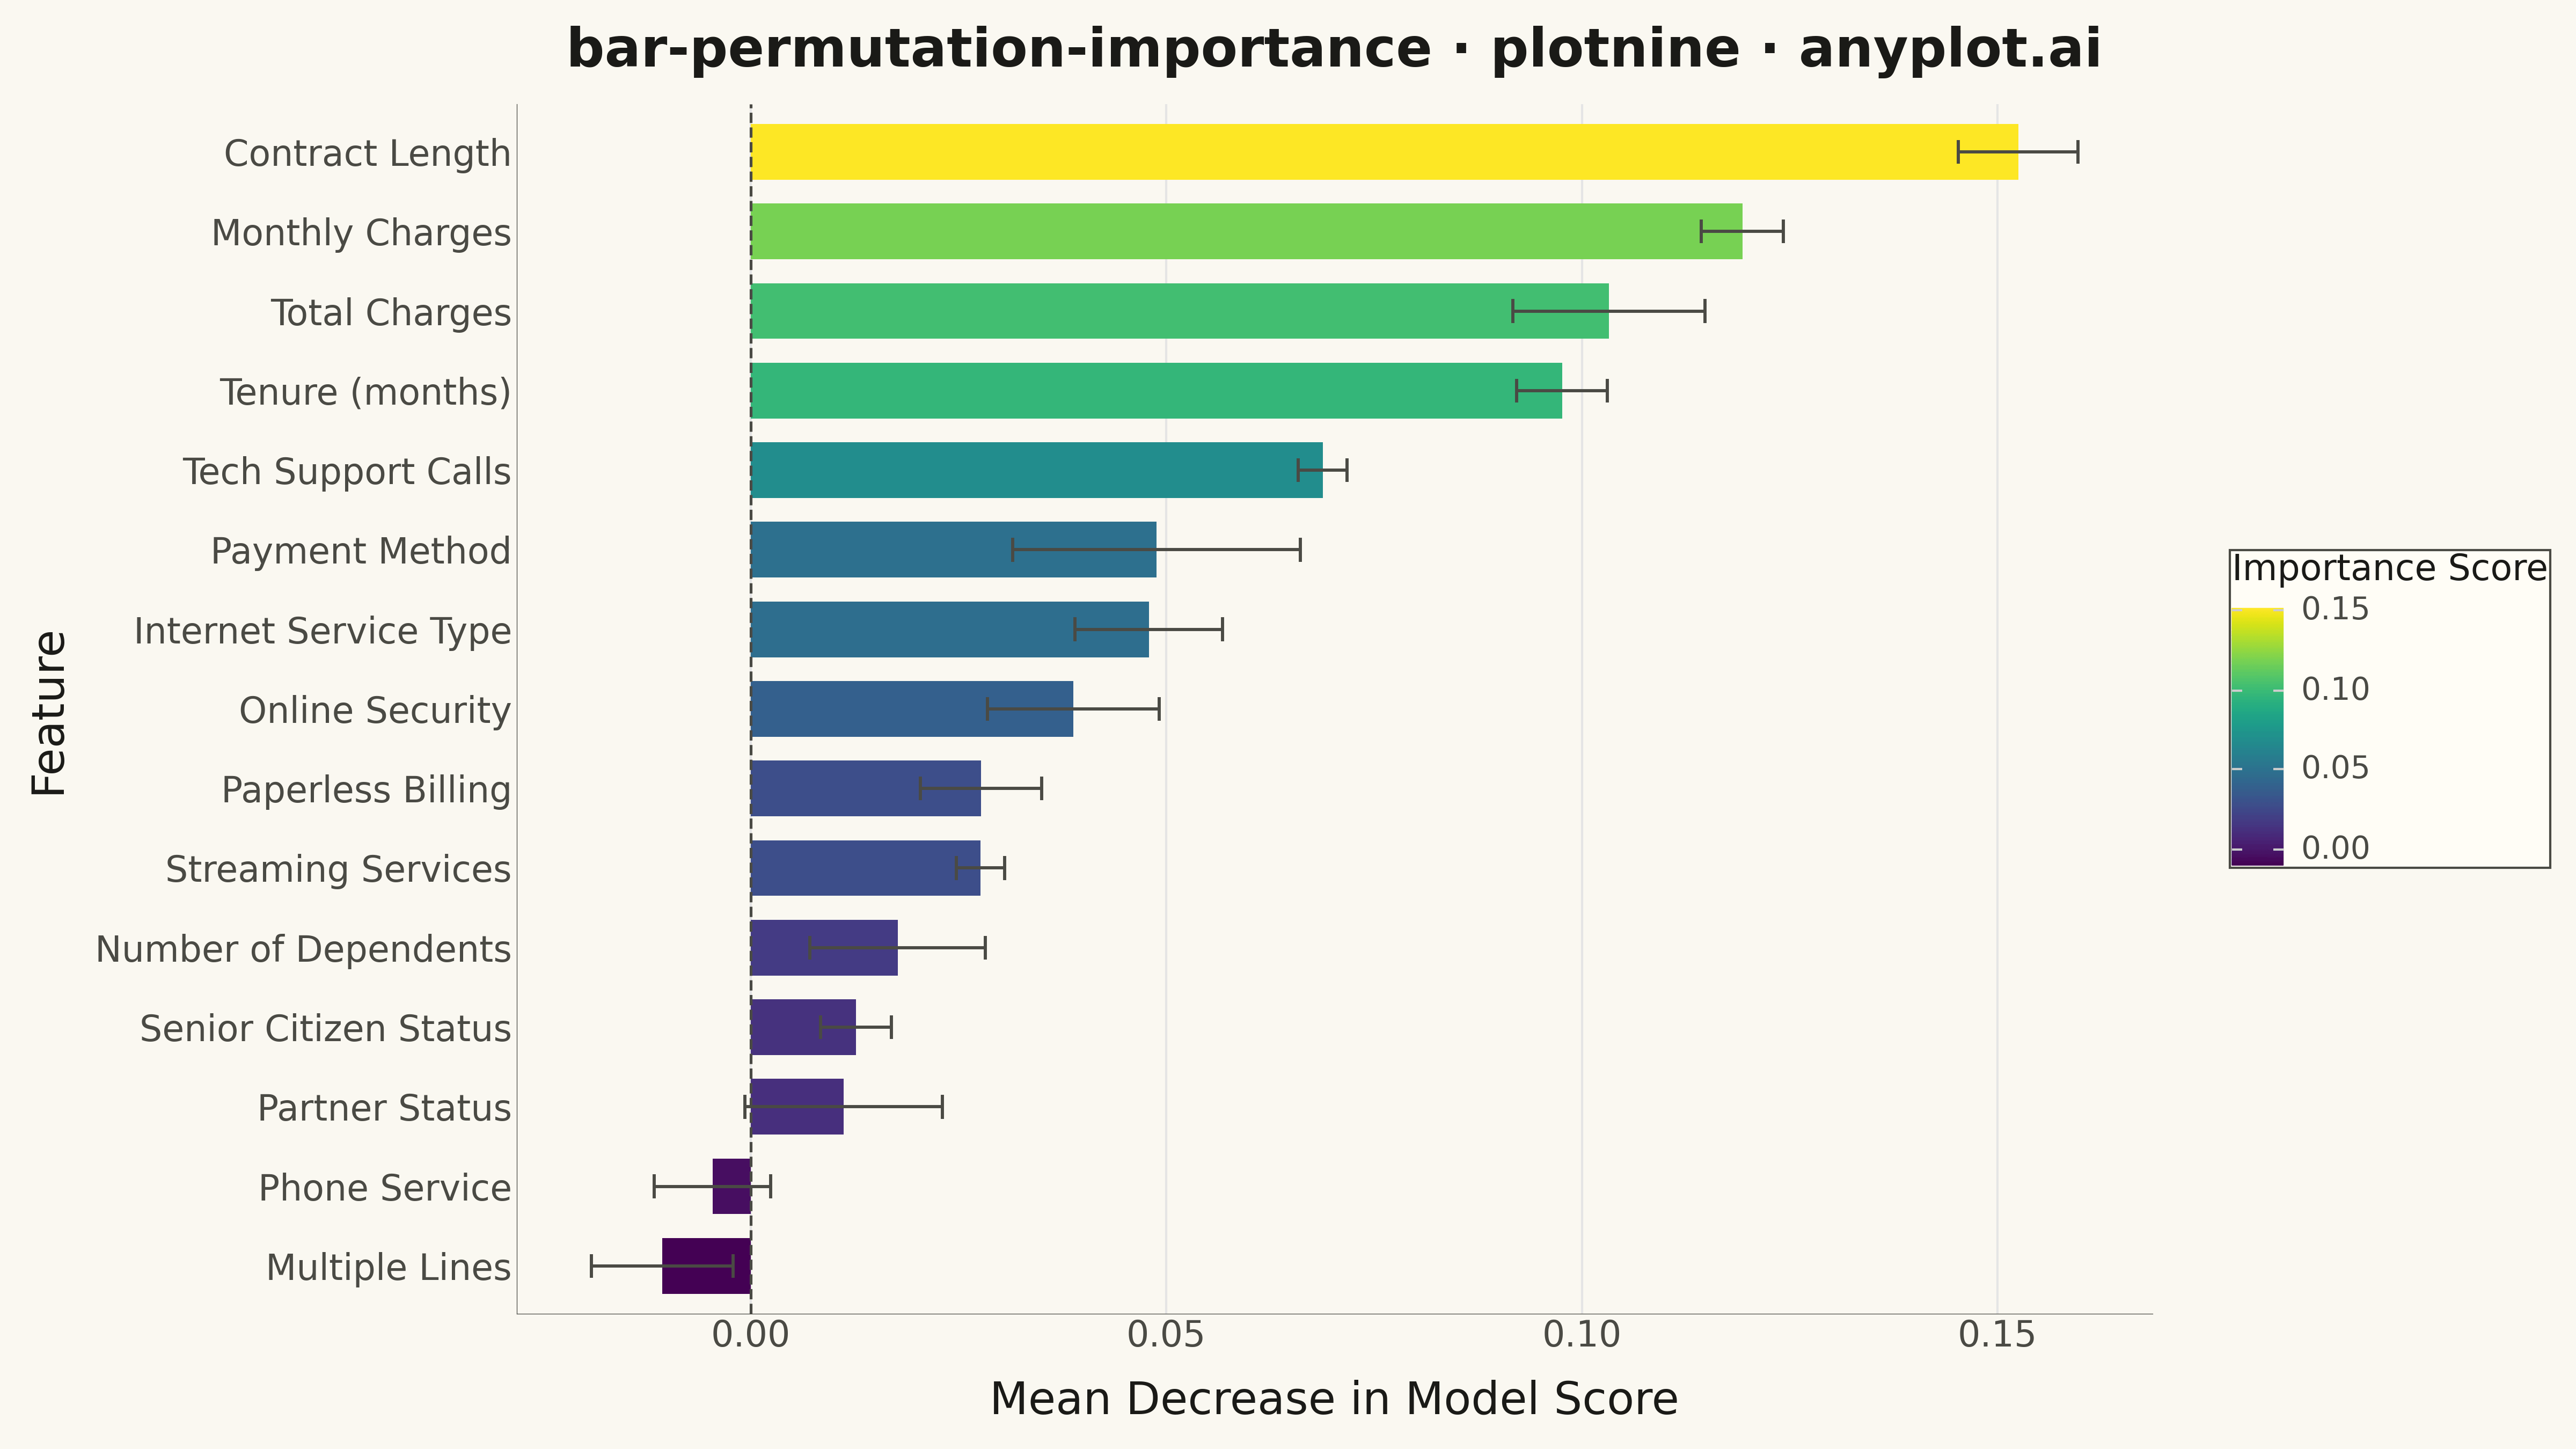
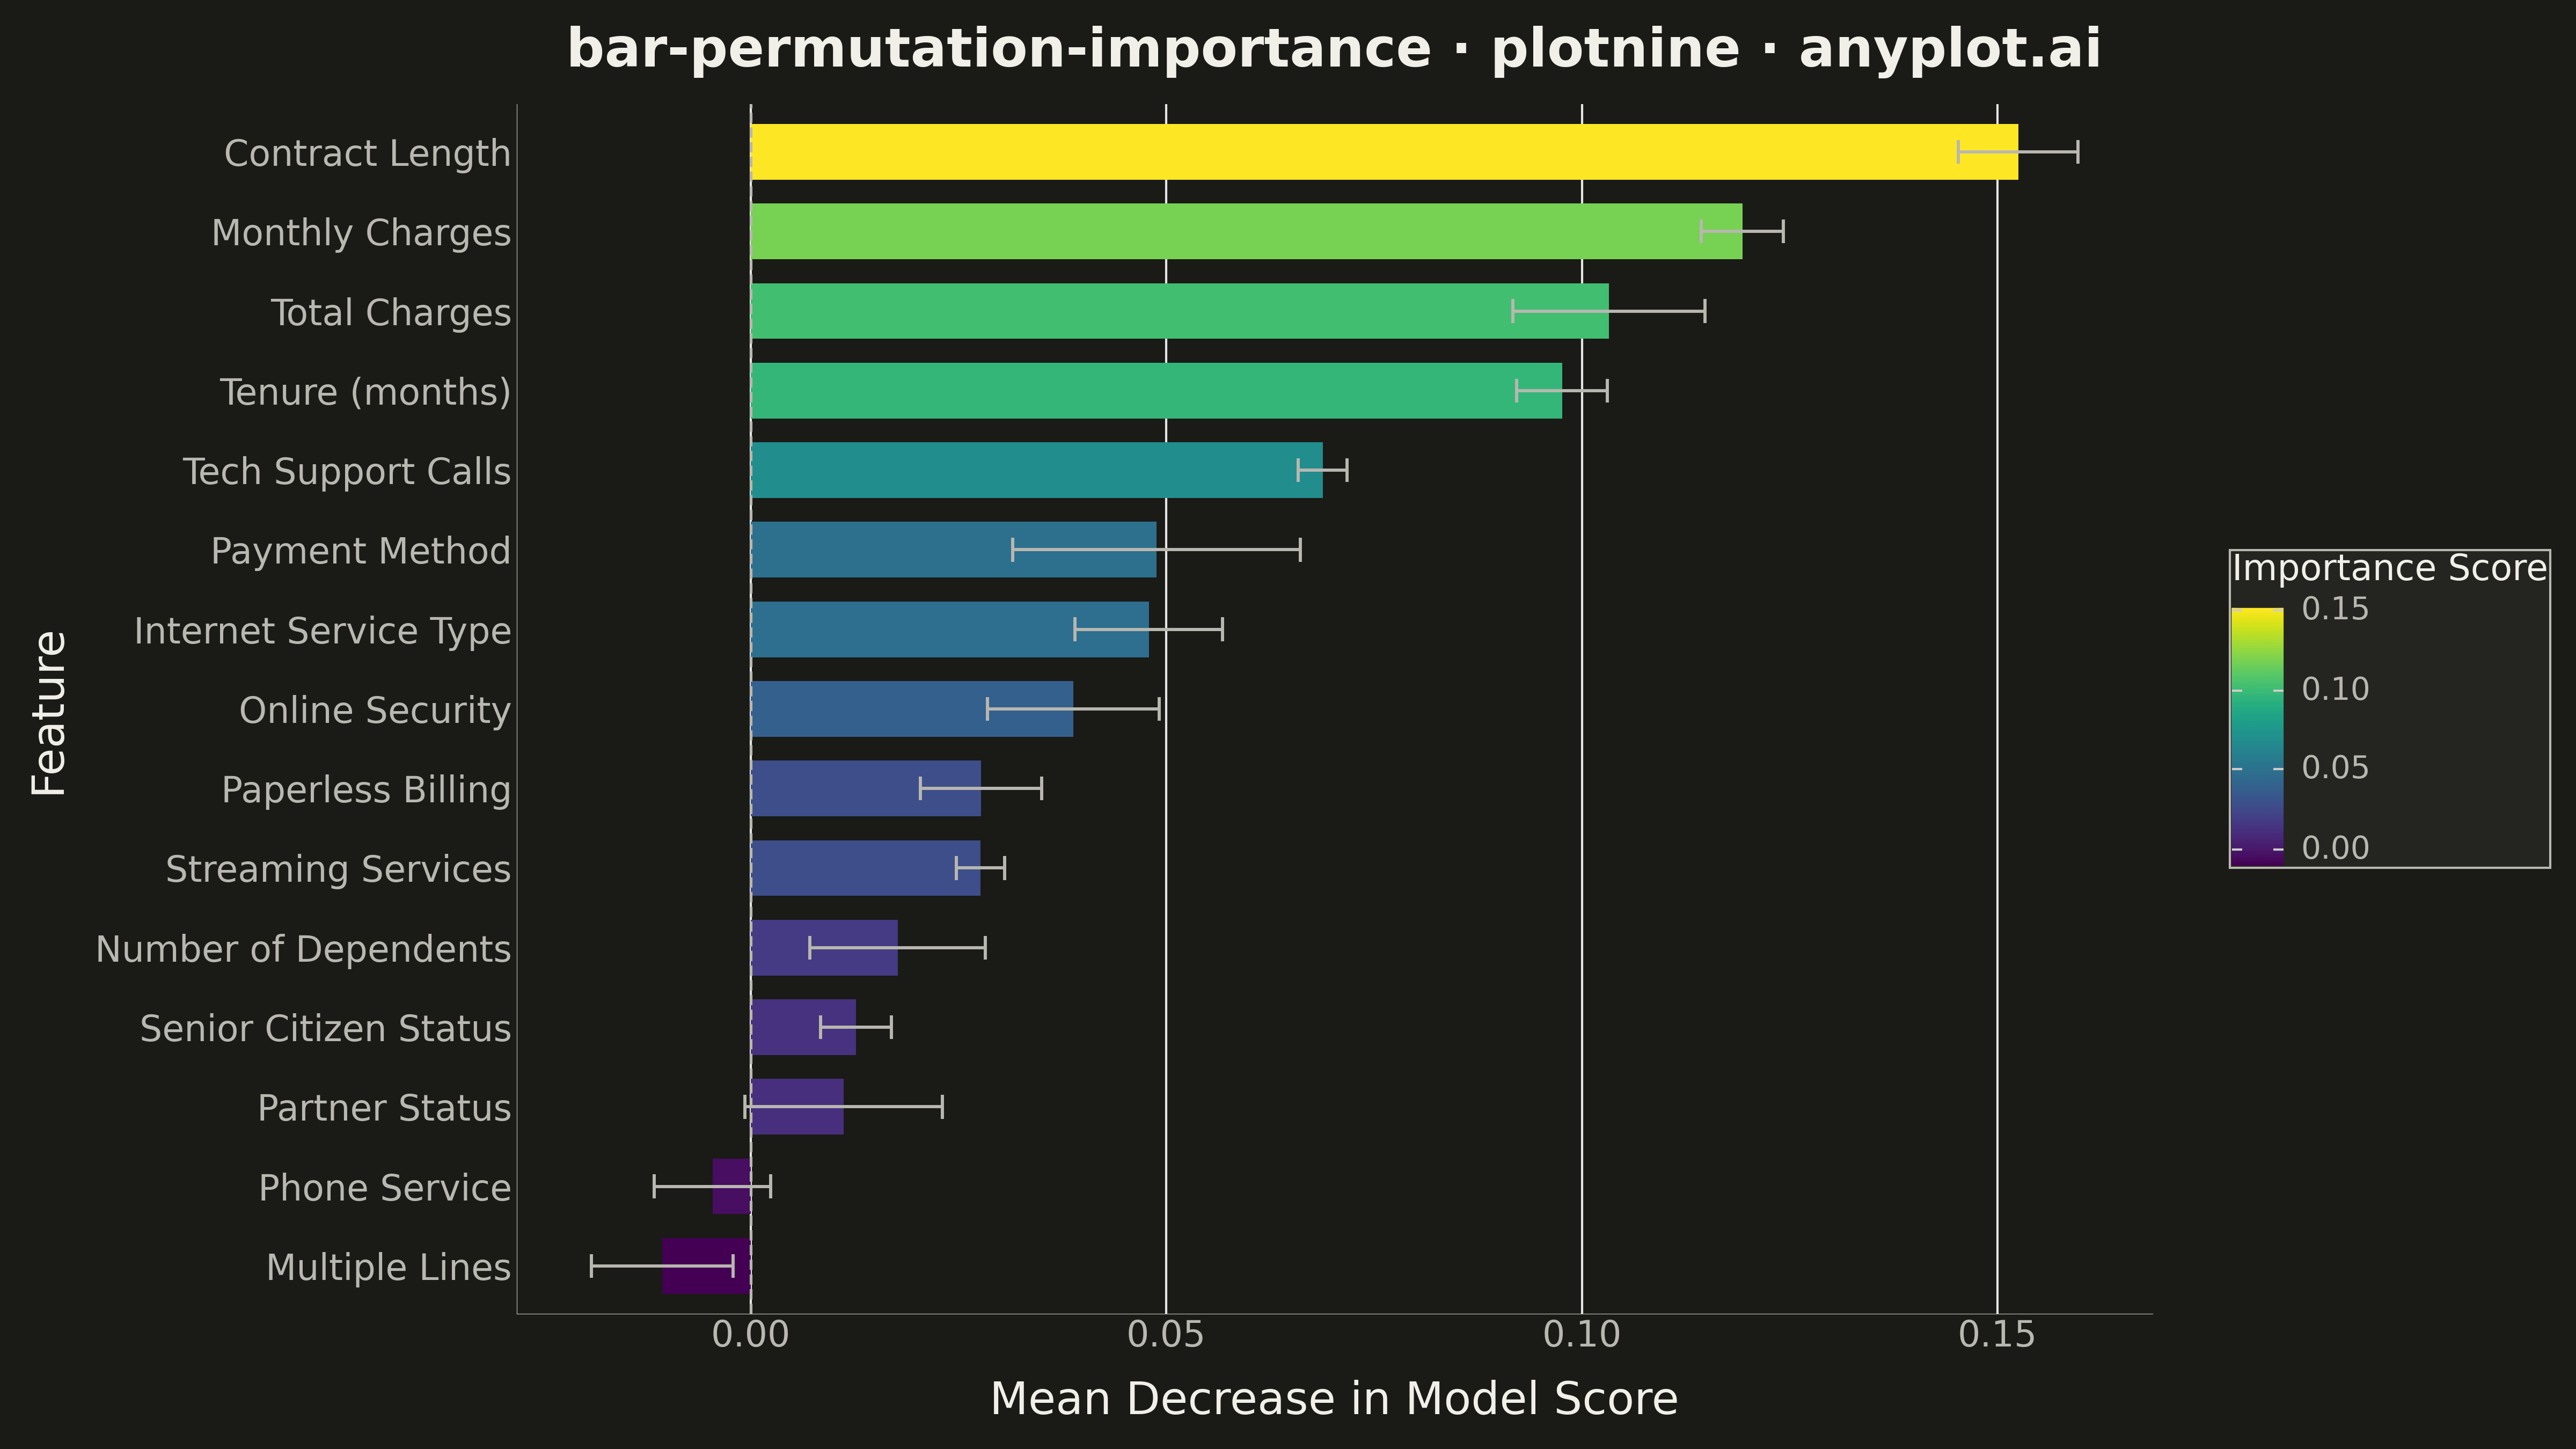
A horizontal bar chart displaying permutation feature importance from machine learning models, showing the decrease in model score when each feature is randomly shuffled. Unlike model-specific feature importances, permutation importance is model-agnostic and measures how much the model's performance degrades when a feature's relationship with the target is broken. Error bars indicate variability across multiple shuffles, providing a confidence measure for each importance score.
""" anyplot.ai
bar-permutation-importance: Permutation Feature Importance Plot
Library: plotnine 0.15.4 | Python 3.13.13
Quality: 90/100 | Updated: 2026-05-17
"""

import os

import numpy as np
import pandas as pd
from plotnine import (
    aes,
    coord_flip,
    element_line,
    element_rect,
    element_text,
    geom_col,
    geom_errorbar,
    geom_hline,
    ggplot,
    labs,
    scale_fill_cmap,
    theme,
    theme_minimal,
)


# Theme tokens (see prompts/default-style-guide.md "Background" + "Theme-adaptive Chrome")
THEME = os.getenv("ANYPLOT_THEME", "light")
PAGE_BG = "#FAF8F1" if THEME == "light" else "#1A1A17"
ELEVATED_BG = "#FFFDF6" if THEME == "light" else "#242420"
INK = "#1A1A17" if THEME == "light" else "#F0EFE8"
INK_SOFT = "#4A4A44" if THEME == "light" else "#B8B7B0"

# Data - Simulating permutation importance results from a random forest model
np.random.seed(42)

# Feature names representing a customer churn prediction model
features = [
    "Contract Length",
    "Monthly Charges",
    "Total Charges",
    "Tenure (months)",
    "Tech Support Calls",
    "Payment Method",
    "Internet Service Type",
    "Online Security",
    "Streaming Services",
    "Paperless Billing",
    "Number of Dependents",
    "Senior Citizen Status",
    "Partner Status",
    "Phone Service",
    "Multiple Lines",
]

# Generate realistic importance values (higher for known predictive features)
base_importances = np.array(
    [0.15, 0.12, 0.10, 0.09, 0.07, 0.05, 0.04, 0.035, 0.03, 0.025, 0.02, 0.015, 0.01, 0.005, -0.002]
)
importance_means = base_importances + np.random.normal(0, 0.005, len(features))
importance_stds = np.abs(np.random.normal(0.01, 0.005, len(features)))

# Create DataFrame and sort by importance
df = pd.DataFrame({"feature": features, "importance_mean": importance_means, "importance_std": importance_stds})
df = df.sort_values("importance_mean", ascending=True).reset_index(drop=True)

# Create ordered categorical for proper sorting in plot
df["feature"] = pd.Categorical(df["feature"], categories=df["feature"], ordered=True)

# Calculate error bar positions (ymin/ymax because coord_flip swaps axes)
df["ymin"] = df["importance_mean"] - df["importance_std"]
df["ymax"] = df["importance_mean"] + df["importance_std"]

# Plot
plot = (
    ggplot(df, aes(x="feature", y="importance_mean", fill="importance_mean"))
    + geom_col(width=0.7)
    + geom_errorbar(aes(ymin="ymin", ymax="ymax"), width=0.3, color=INK_SOFT, size=0.8)
    + geom_hline(yintercept=0, linetype="dashed", color=INK_SOFT, size=0.7)
    + coord_flip()
    + scale_fill_cmap(cmap_name="viridis", name="Importance Score")
    + labs(x="Feature", y="Mean Decrease in Model Score", title="bar-permutation-importance · plotnine · anyplot.ai")
    + theme_minimal()
    + theme(
        figure_size=(16, 9),
        plot_background=element_rect(fill=PAGE_BG, color=PAGE_BG),
        panel_background=element_rect(fill=PAGE_BG),
        panel_grid_major_y=element_line(alpha=0),
        panel_grid_minor=element_line(alpha=0),
        axis_line=element_line(color=INK_SOFT, size=0.3),
        plot_title=element_text(size=24, weight="bold", color=INK),
        axis_title_x=element_text(size=20, color=INK),
        axis_title_y=element_text(size=20, color=INK),
        axis_text_x=element_text(size=16, color=INK_SOFT),
        axis_text_y=element_text(size=16, color=INK_SOFT),
        legend_background=element_rect(fill=ELEVATED_BG, color=INK_SOFT),
        legend_title=element_text(size=16, color=INK),
        legend_text=element_text(size=14, color=INK_SOFT),
    )
)

# Save
plot.save(f"plot-{THEME}.png", dpi=300, verbose=False)
Runnable source as JSON, for any HTTP client: https://api.anyplot.ai/specs/bar-permutation-importance/plotnine/code. Any spec id and library id listed in llms-full.txt fit the same URL shape; every URL below is complete and callable.
{
  "spec_id": "bar-permutation-importance",
  "language": "python",
  "library": "plotnine",
  "page": "https://anyplot.ai/bar-permutation-importance/python/plotnine",
  "hub": "https://anyplot.ai/bar-permutation-importance",
  "code_json": "https://api.anyplot.ai/specs/bar-permutation-importance/plotnine/code",
  "spec_json": "https://api.anyplot.ai/specs/bar-permutation-importance",
  "render_light_png": "https://storage.googleapis.com/anyplot-images/plots/bar-permutation-importance/python/plotnine/plot-light.png",
  "render_dark_png": "https://storage.googleapis.com/anyplot-images/plots/bar-permutation-importance/python/plotnine/plot-dark.png",
  "quality_score": 90.0,
  "license": "MIT",
  "guide": "https://anyplot.ai/llms.txt"
}
Part of Permutation Feature Importance Plot on anyplot.ai.