The same plot in 14 other libraries — JavaScript: Chart.js, D3.js, Highcharts, MUI X Charts; Python: Altair, Bokeh, lets-plot, Matplotlib, Plotly, plotnine, Pygal, Seaborn; R: ggplot2; Julia: Makie.jl. Compare all 15 side by side: Permutation Feature Importance Plot in Python, R, Julia and JavaScript.
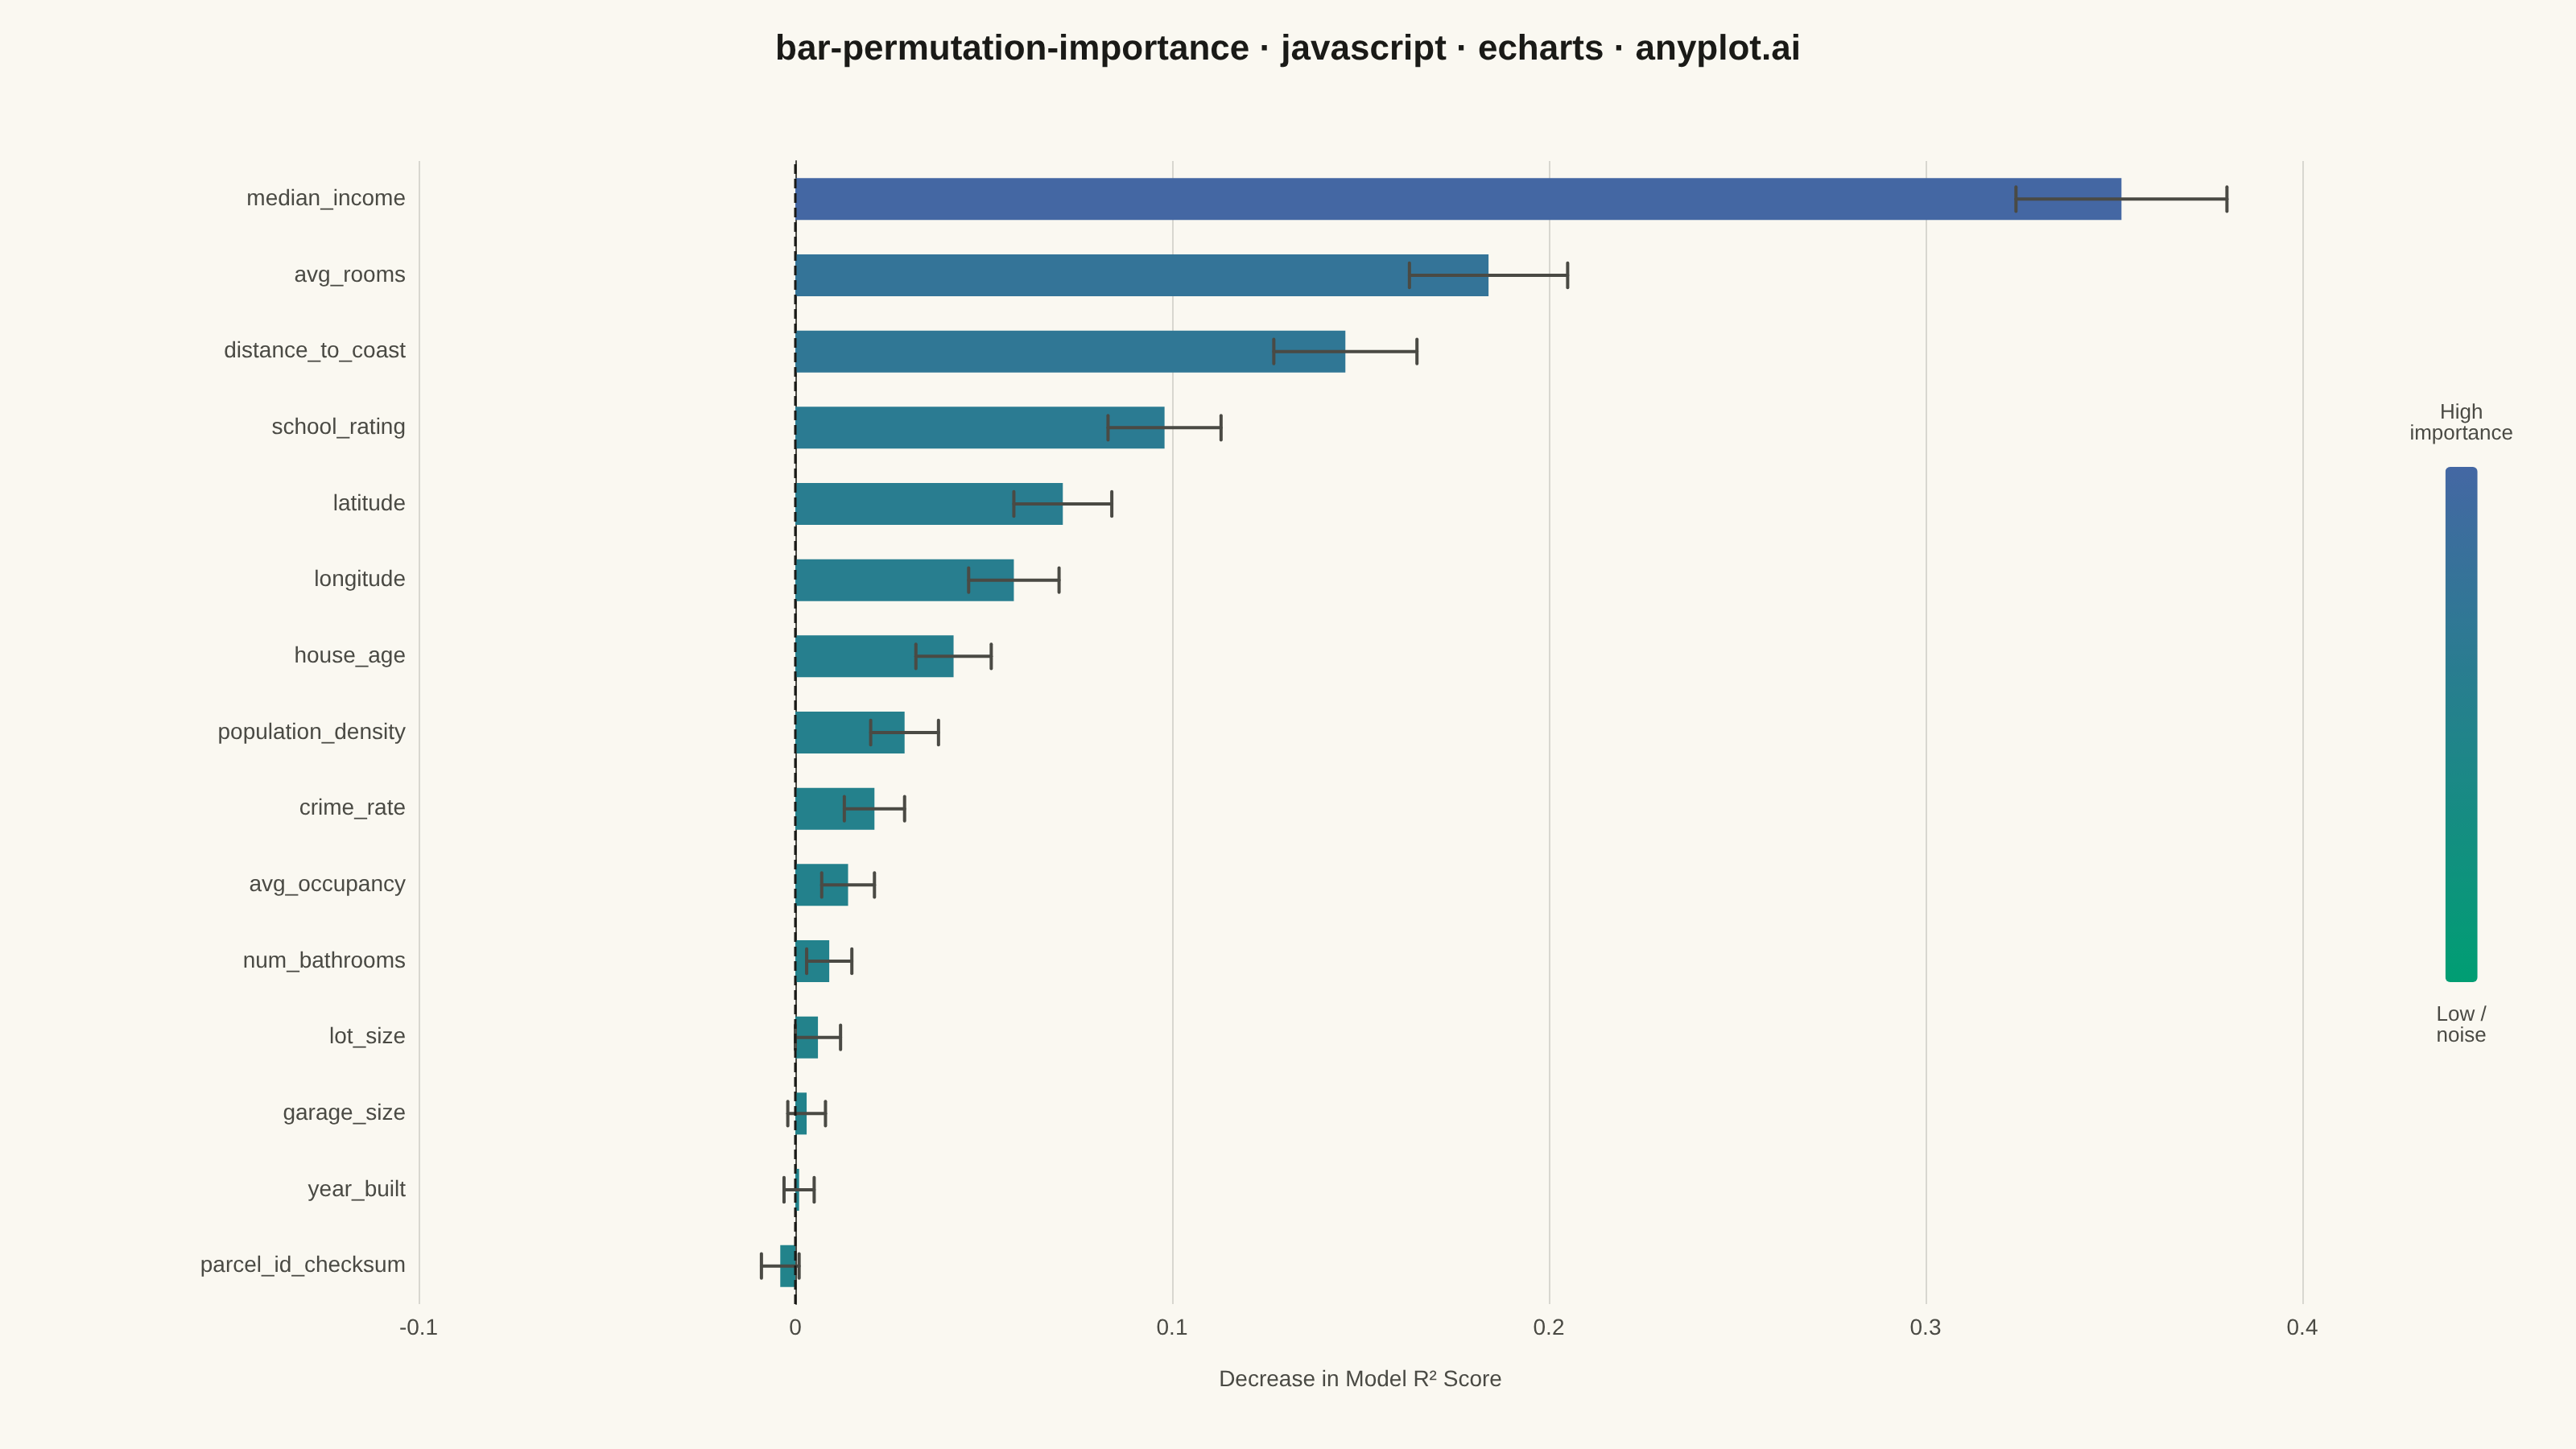
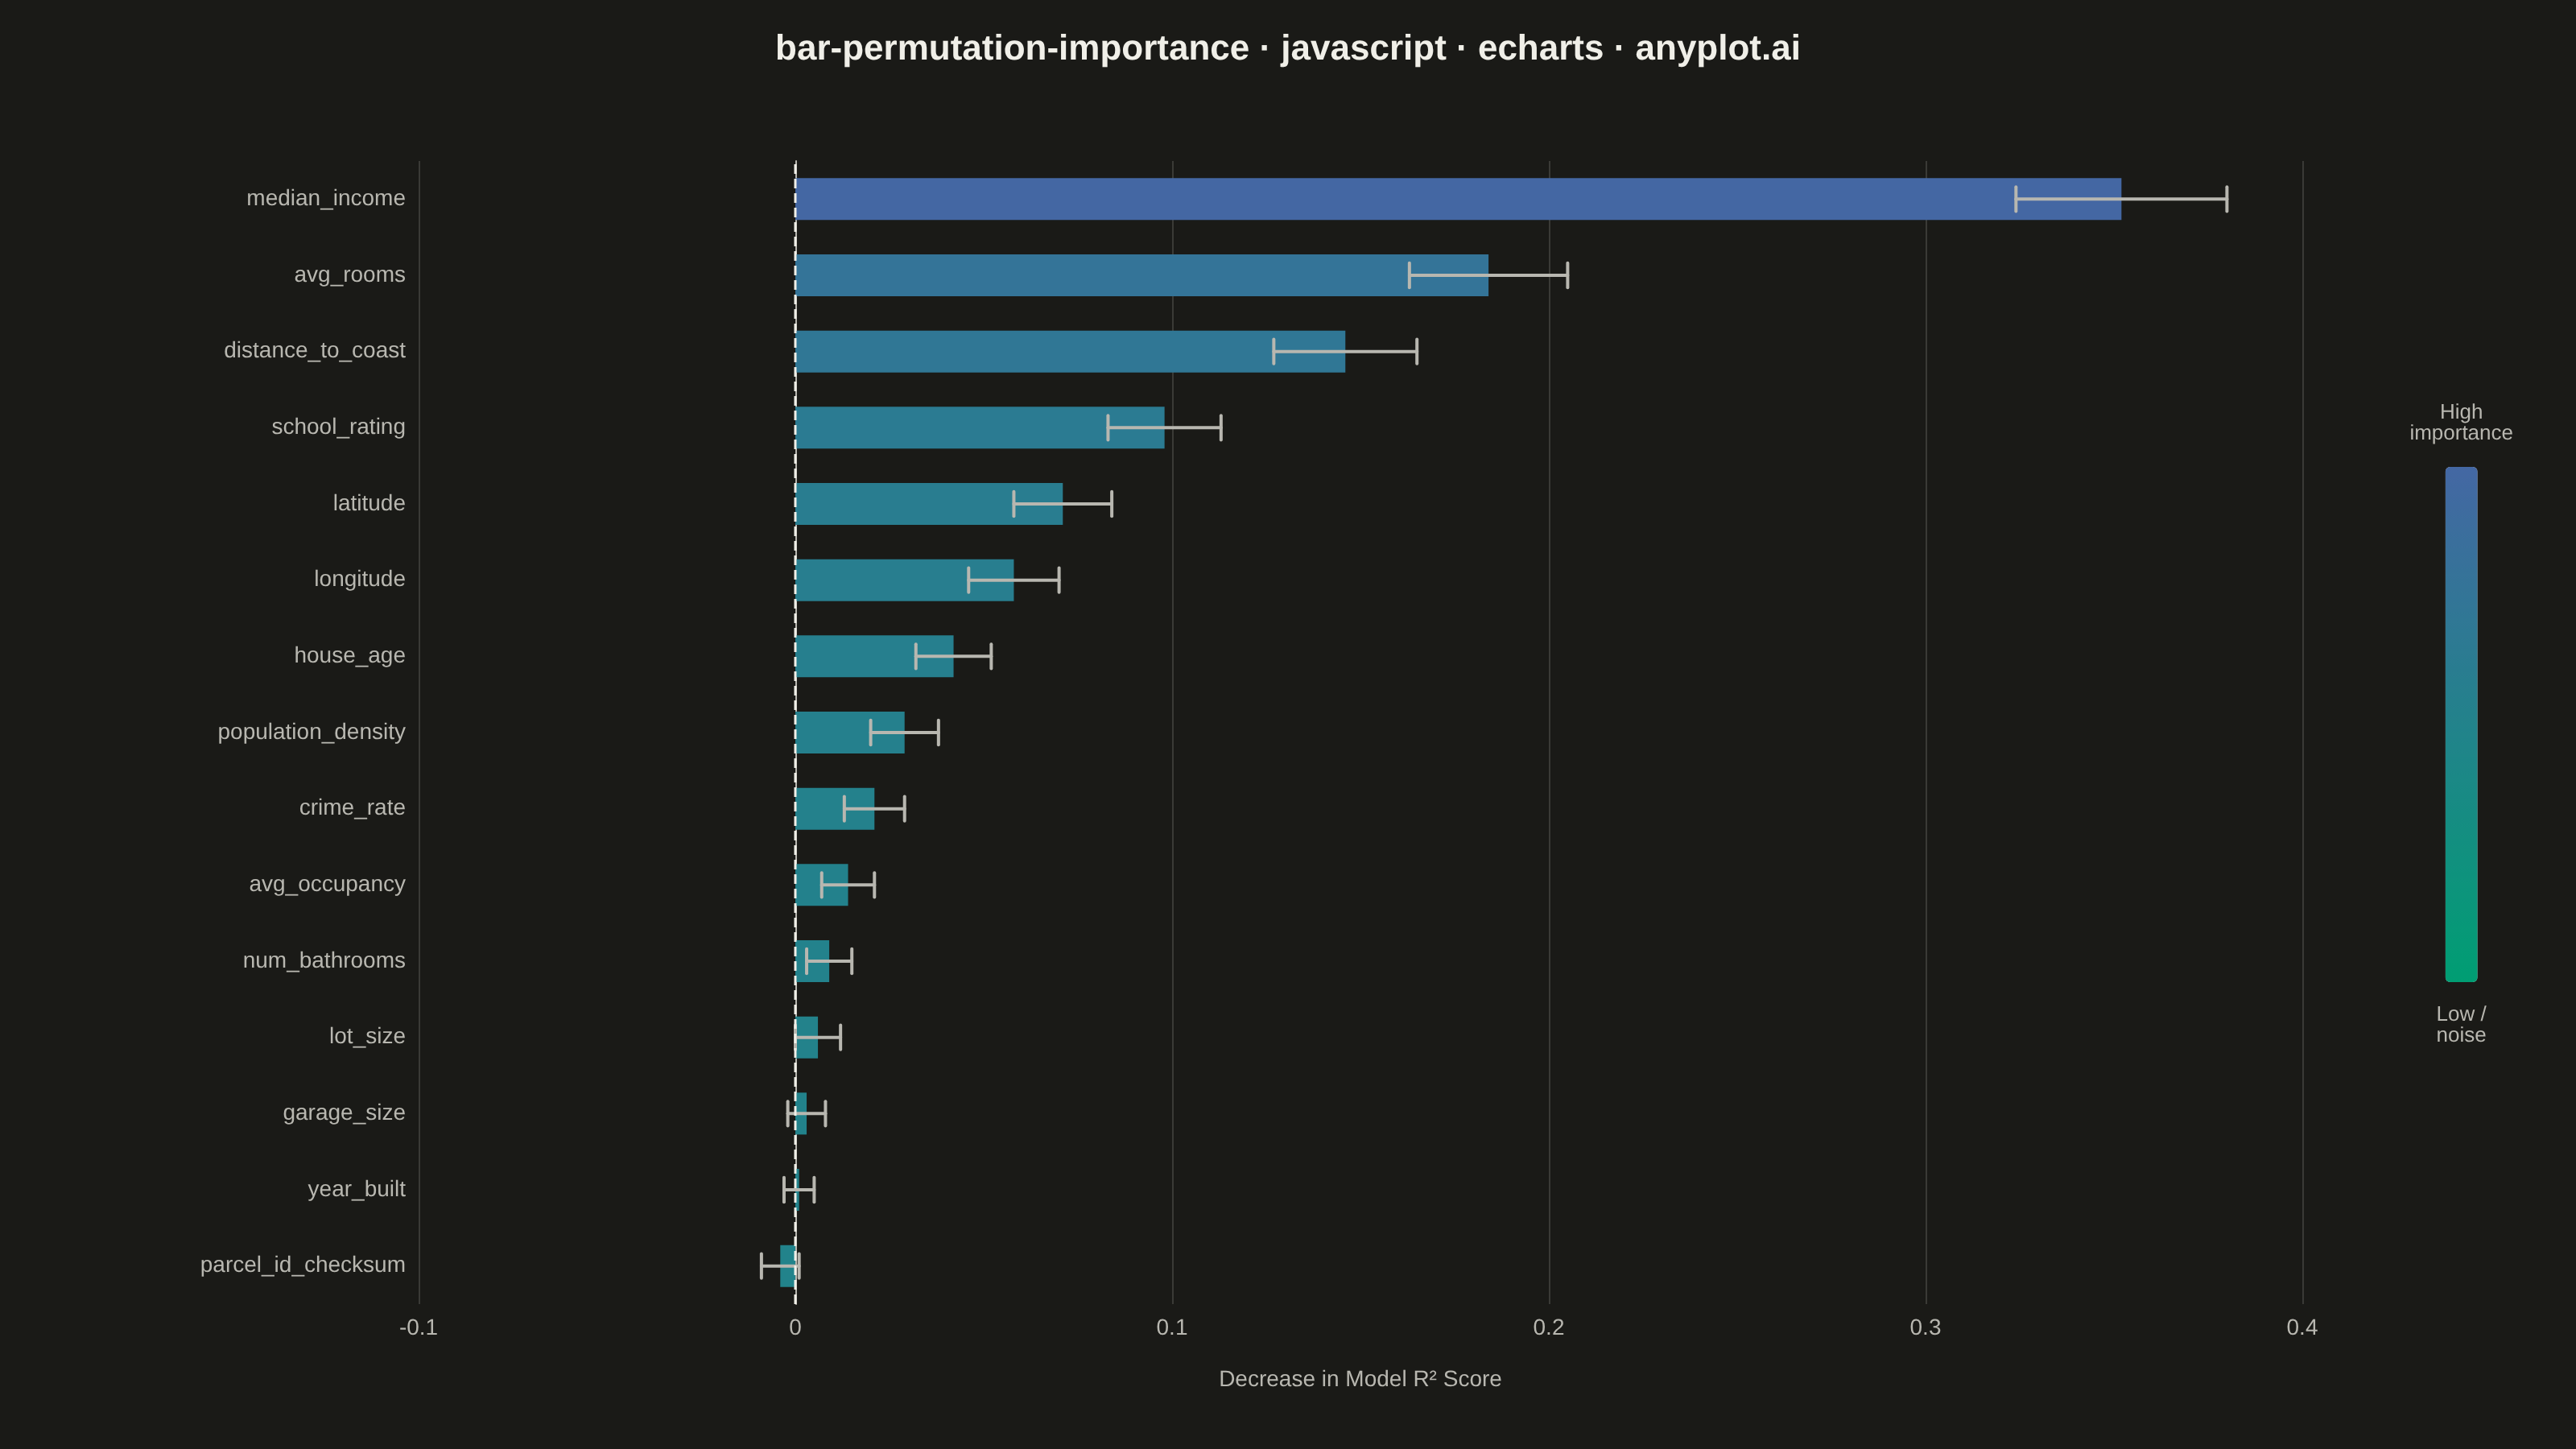
A horizontal bar chart displaying permutation feature importance from machine learning models, showing the decrease in model score when each feature is randomly shuffled. Unlike model-specific feature importances, permutation importance is model-agnostic and measures how much the model's performance degrades when a feature's relationship with the target is broken. Error bars indicate variability across multiple shuffles, providing a confidence measure for each importance score.
// anyplot.ai
// bar-permutation-importance: Permutation Feature Importance Plot
// Library: echarts 6.1.0 | JavaScript 22.23.2
// Quality: 90/100 | Created: 2026-08-26

const t = window.ANYPLOT_TOKENS;

// --- Data (in-memory, deterministic) ----------------------------------------
// Permutation importance for a random forest predicting house sale price.
// Ordered highest → lowest, then reversed so ECharts (which stacks category
// entries bottom-to-top) renders the highest importance at the top.
const features = [
  ["median_income", 0.352, 0.028],
  ["avg_rooms", 0.184, 0.021],
  ["distance_to_coast", 0.146, 0.019],
  ["school_rating", 0.098, 0.015],
  ["latitude", 0.071, 0.013],
  ["longitude", 0.058, 0.012],
  ["house_age", 0.042, 0.01],
  ["population_density", 0.029, 0.009],
  ["crime_rate", 0.021, 0.008],
  ["avg_occupancy", 0.014, 0.007],
  ["num_bathrooms", 0.009, 0.006],
  ["lot_size", 0.006, 0.006],
  ["garage_size", 0.003, 0.005],
  ["year_built", 0.001, 0.004],
  ["parcel_id_checksum", -0.004, 0.005],
].reverse();

const featureNames = features.map((d) => d[0]);
const importanceMeans = features.map((d) => d[1]);
const maxAbsImportance = Math.max(...importanceMeans.map(Math.abs));

// --- Init --------------------------------------------------------------------
const chart = echarts.init(document.getElementById("container"));

// --- Error-bar renderer (±1 SD whiskers around each bar's mean) -------------
function renderErrorBar(params, api) {
  const idx = params.dataIndex;
  const mean = api.value(0);
  const std = api.value(1);
  const y = api.coord([0, idx])[1];
  const lowPt = api.coord([mean - std, idx]);
  const highPt = api.coord([mean + std, idx]);
  const capHalf = Math.max(6, api.size([0, 1])[1] * 0.16);
  const style = { stroke: t.inkSoft, lineWidth: 2, lineCap: "round" };
  return {
    type: "group",
    children: [
      { type: "line", shape: { x1: lowPt[0], y1: y, x2: highPt[0], y2: y }, style },
      { type: "line", shape: { x1: lowPt[0], y1: y - capHalf, x2: lowPt[0], y2: y + capHalf }, style },
      { type: "line", shape: { x1: highPt[0], y1: y - capHalf, x2: highPt[0], y2: y + capHalf }, style },
    ],
  };
}

// --- Option -------------------------------------------------------------------
chart.setOption({
  animation: false,
  backgroundColor: "transparent",
  title: {
    text: "bar-permutation-importance · javascript · echarts · anyplot.ai",
    left: "center",
    textStyle: { color: t.ink, fontSize: 22 },
  },
  grid: { left: 260, right: 170, top: 100, bottom: 90 },
  xAxis: {
    type: "value",
    name: "Decrease in Model R² Score",
    nameLocation: "middle",
    nameGap: 40,
    nameTextStyle: { color: t.inkSoft, fontSize: 14 },
    axisLabel: { color: t.inkSoft, fontSize: 14 },
    axisLine: { lineStyle: { color: t.inkSoft } },
    splitLine: { lineStyle: { color: t.grid } },
  },
  yAxis: {
    type: "category",
    data: featureNames,
    axisLabel: { color: t.inkSoft, fontSize: 14 },
    axisLine: { lineStyle: { color: t.inkSoft } },
    axisTick: { show: false },
    splitLine: { show: false },
  },
  visualMap: {
    type: "continuous",
    dimension: 0,
    seriesIndex: 0,
    min: -maxAbsImportance,
    max: maxAbsImportance,
    calculable: false,
    orient: "vertical",
    right: 24,
    top: "middle",
    itemWidth: 20,
    itemHeight: 320,
    text: ["High\nimportance", "Low /\nnoise"],
    textGap: 14,
    textStyle: { color: t.inkSoft, fontSize: 13 },
    inRange: { color: t.seq },
  },
  series: [
    {
      type: "bar",
      name: "Importance",
      data: importanceMeans.map((v) => ({ value: v })),
      barWidth: "55%",
      z: 2,
      markLine: {
        silent: true,
        symbol: "none",
        lineStyle: { color: t.ink, type: "dashed", width: 1.5 },
        label: { show: false },
        data: [{ xAxis: 0 }],
      },
    },
    {
      type: "custom",
      name: "Variability (±1 SD)",
      coordinateSystem: "cartesian2d",
      renderItem: renderErrorBar,
      data: features.map((d) => [d[1], d[2]]),
      z: 3,
    },
  ],
});
Runnable source as JSON, for any HTTP client: https://api.anyplot.ai/specs/bar-permutation-importance/echarts/code. Any spec id and library id listed in llms-full.txt fit the same URL shape; every URL below is complete and callable.
{
  "spec_id": "bar-permutation-importance",
  "language": "javascript",
  "library": "echarts",
  "page": "https://anyplot.ai/bar-permutation-importance/javascript/echarts",
  "hub": "https://anyplot.ai/bar-permutation-importance",
  "code_json": "https://api.anyplot.ai/specs/bar-permutation-importance/echarts/code",
  "spec_json": "https://api.anyplot.ai/specs/bar-permutation-importance",
  "render_light_png": "https://storage.googleapis.com/anyplot-images/plots/bar-permutation-importance/javascript/echarts/plot-light.png",
  "render_dark_png": "https://storage.googleapis.com/anyplot-images/plots/bar-permutation-importance/javascript/echarts/plot-dark.png",
  "interactive_light_html": "https://storage.googleapis.com/anyplot-images/plots/bar-permutation-importance/javascript/echarts/plot-light.html",
  "interactive_dark_html": "https://storage.googleapis.com/anyplot-images/plots/bar-permutation-importance/javascript/echarts/plot-dark.html",
  "quality_score": 90.0,
  "license": "MIT",
  "guide": "https://anyplot.ai/llms.txt"
}
Part of Permutation Feature Importance Plot on anyplot.ai.