The same plot in 14 other libraries — JavaScript: Chart.js, D3.js, Apache ECharts, Highcharts; Python: Altair, Bokeh, lets-plot, Matplotlib, Plotly, plotnine, Pygal, Seaborn; R: ggplot2; Julia: Makie.jl. Compare all 15 side by side: Permutation Feature Importance Plot in Python, R, Julia and JavaScript.
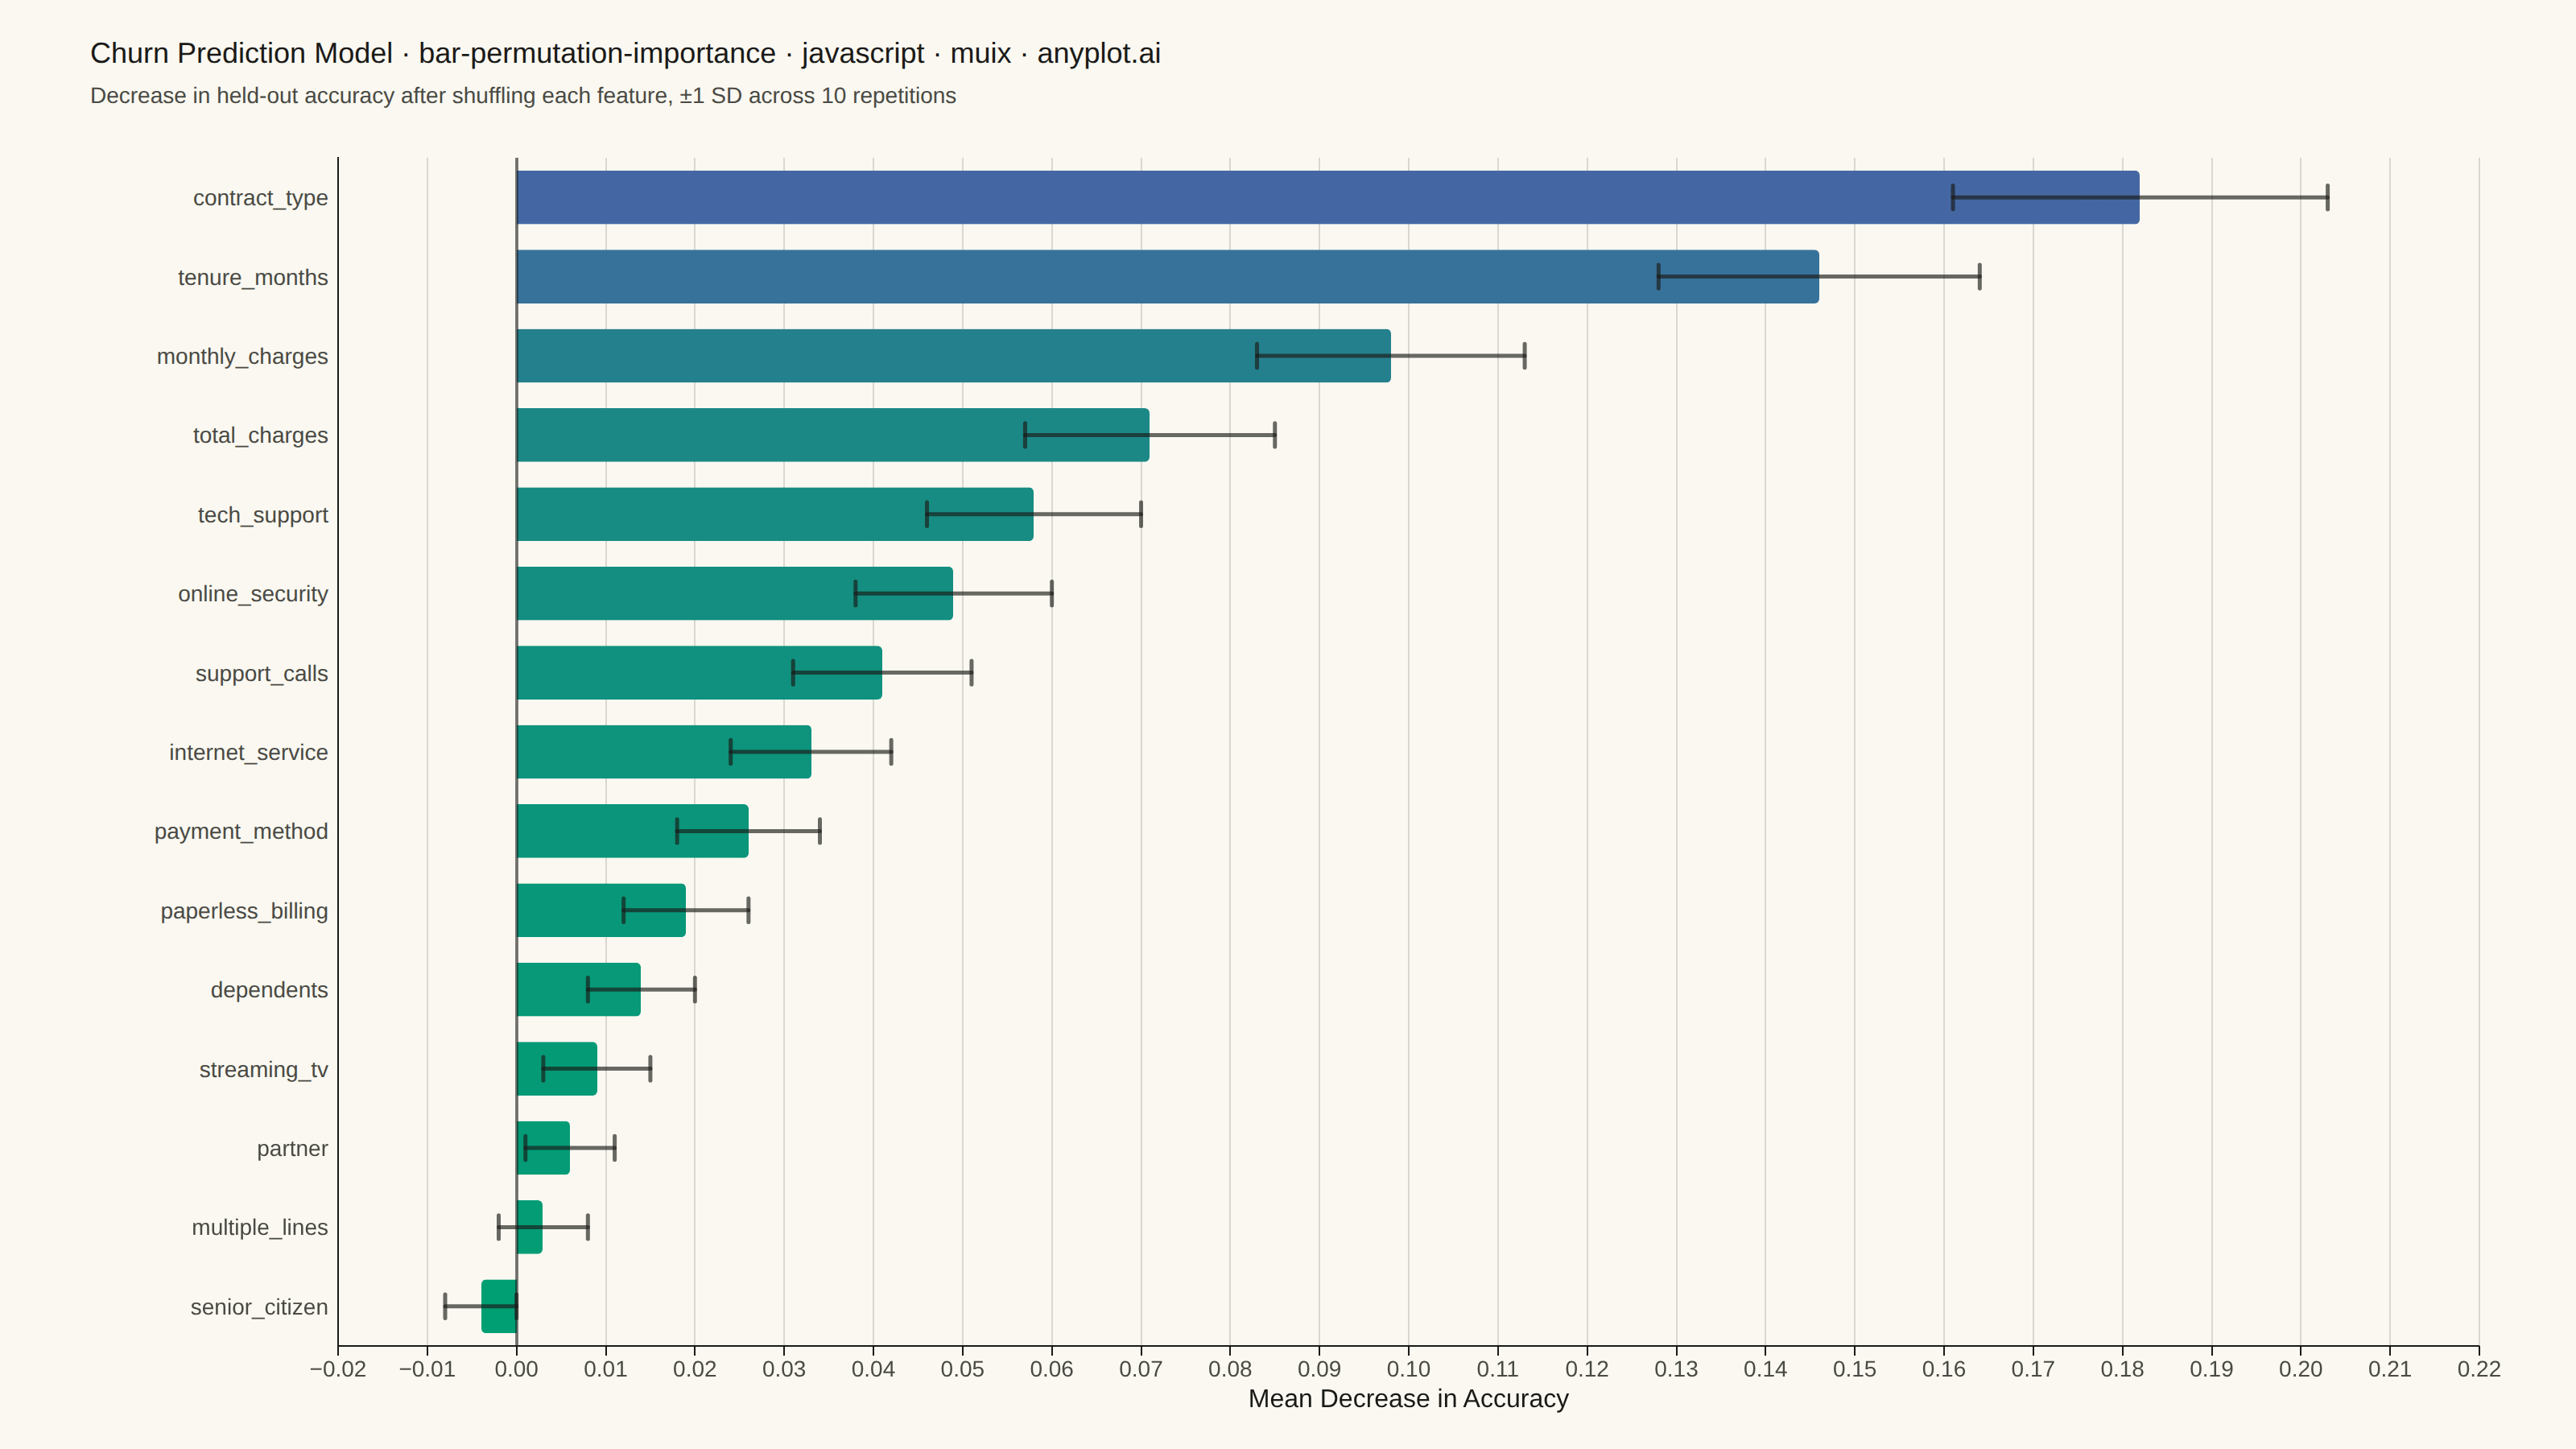
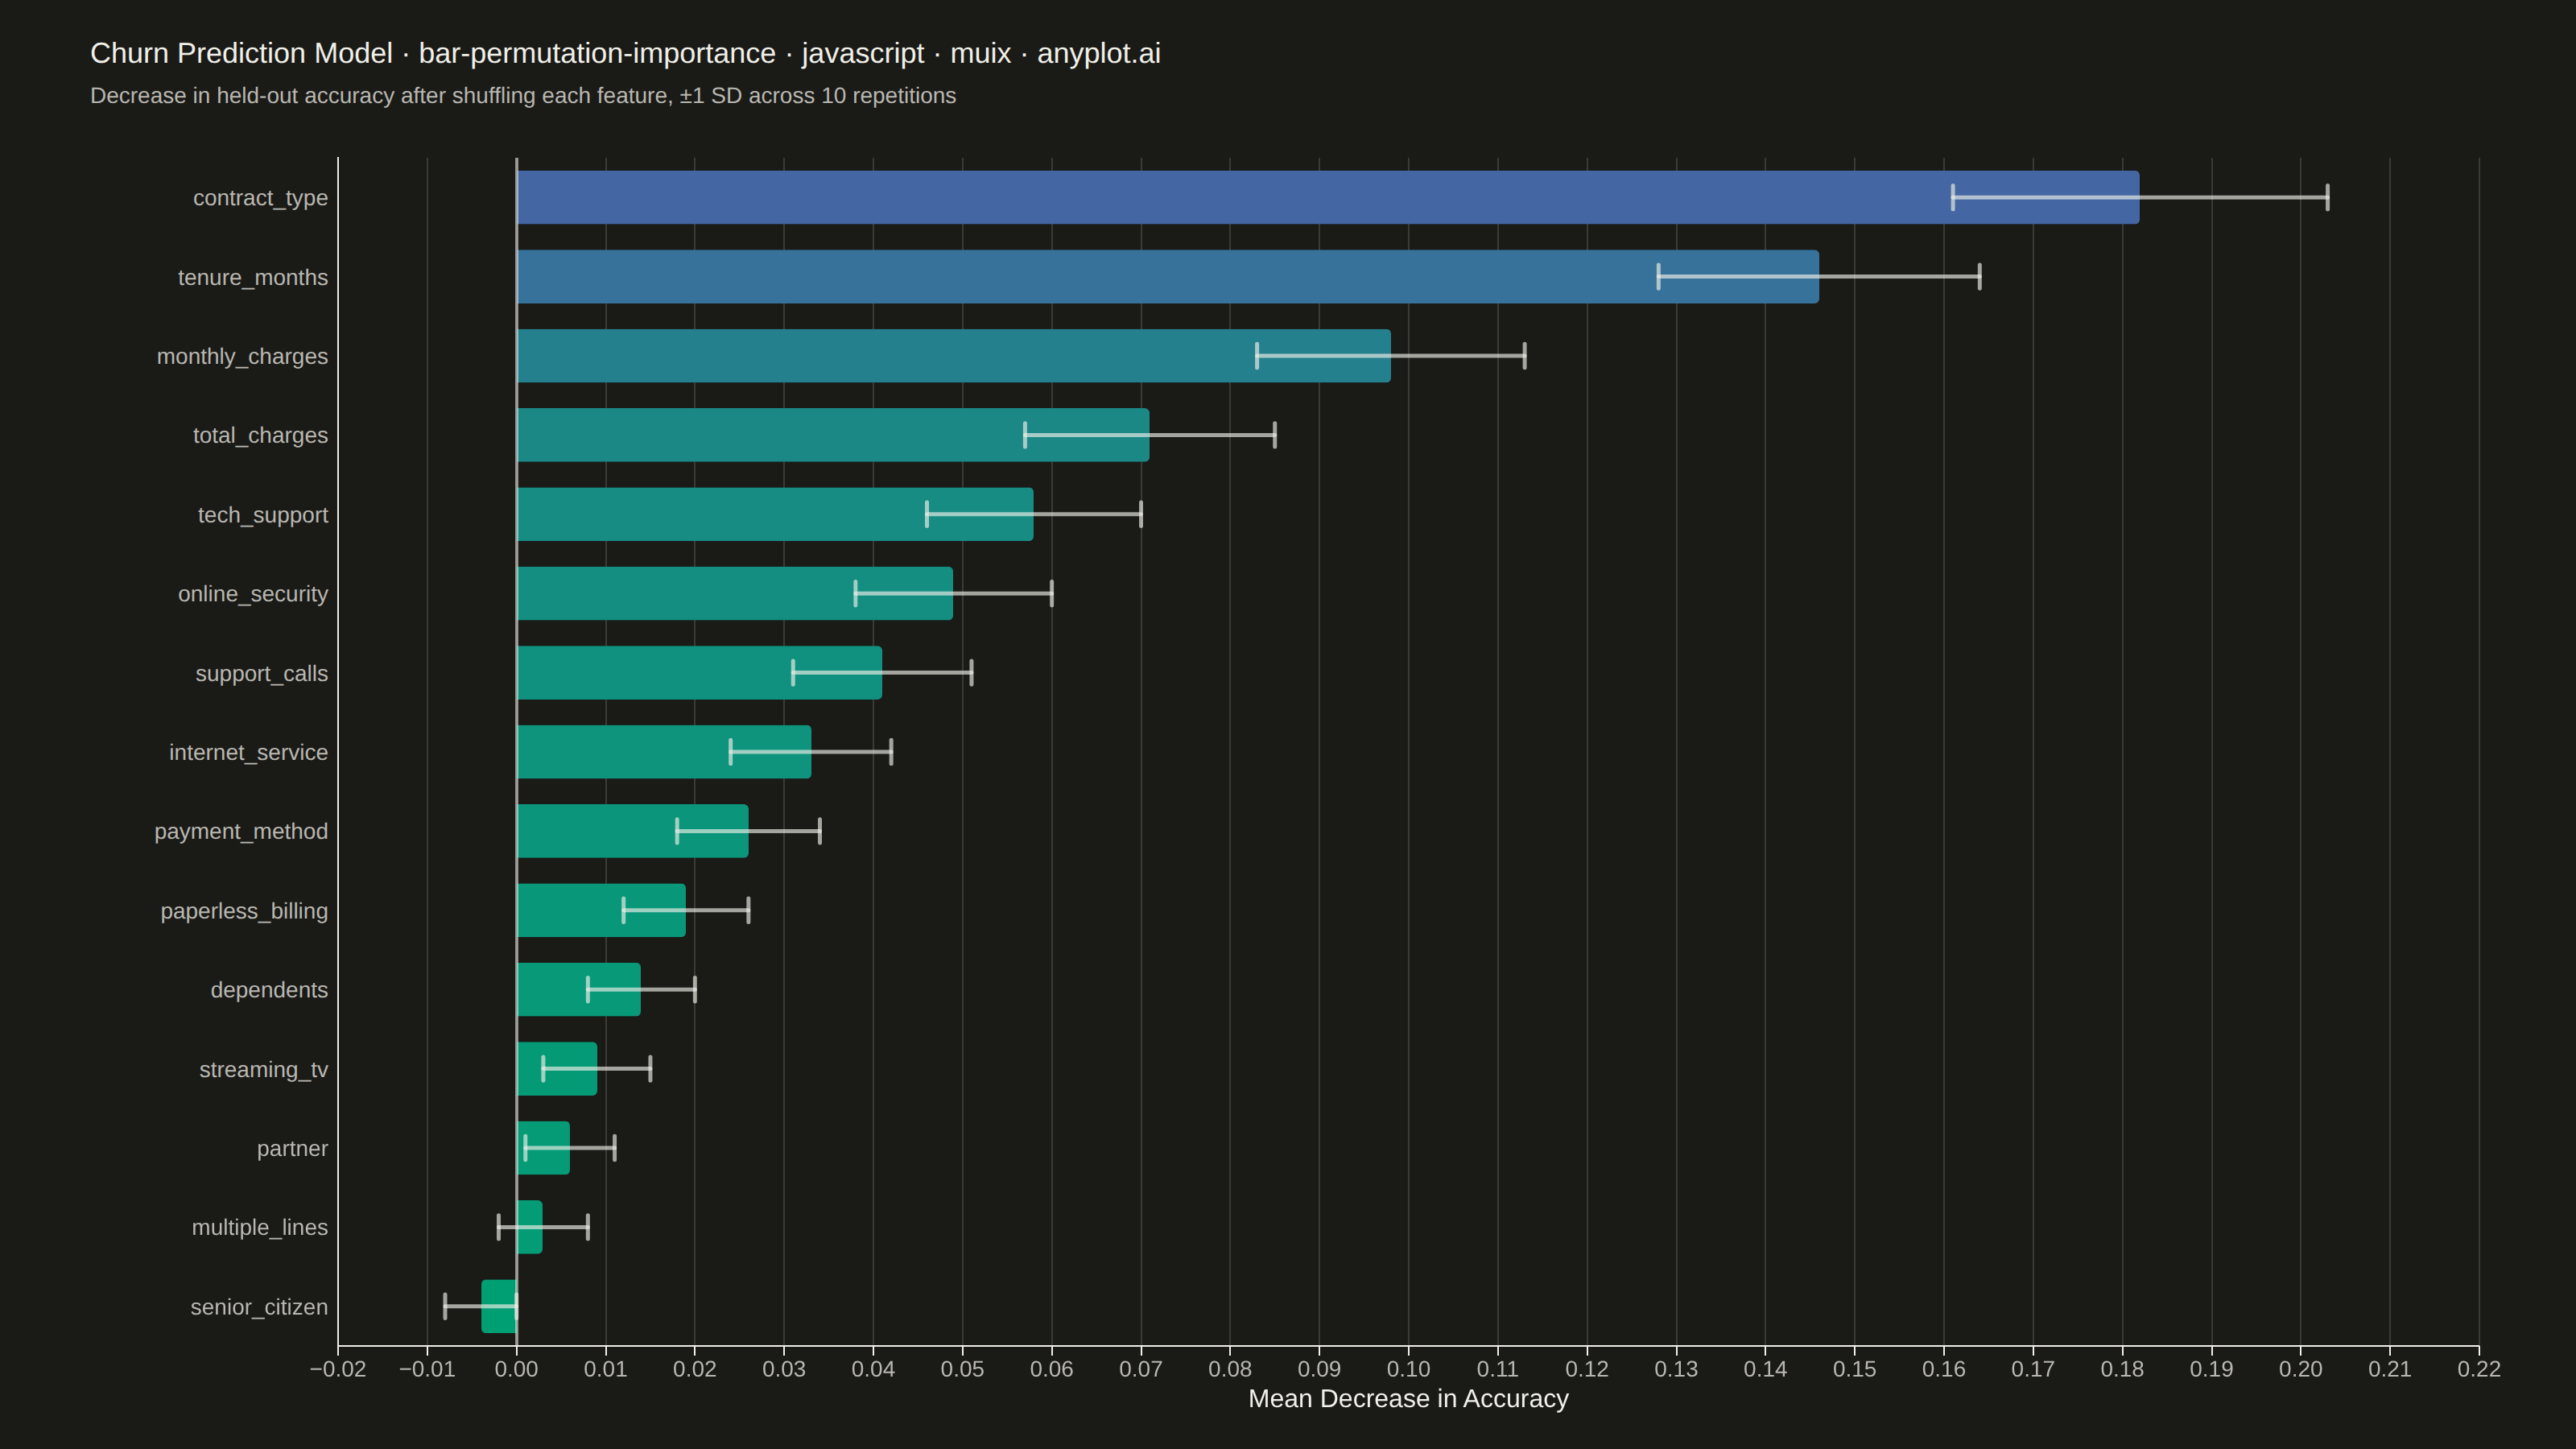
A horizontal bar chart displaying permutation feature importance from machine learning models, showing the decrease in model score when each feature is randomly shuffled. Unlike model-specific feature importances, permutation importance is model-agnostic and measures how much the model's performance degrades when a feature's relationship with the target is broken. Error bars indicate variability across multiple shuffles, providing a confidence measure for each importance score.
// anyplot.ai
// bar-permutation-importance: Permutation Feature Importance Plot
// Library: muix 7.29.1 | JavaScript 22.23.2
// Quality: 92/100 | Created: 2026-08-26
//# anyplot-orientation: landscape
// anyplot.ai
// bar-permutation-importance: Permutation Feature Importance Plot
// Library: MUI X Charts | React | Node 22
// License: @mui/x-charts — MIT (community). Pro/Premium are out of scope.
// Quality: pending | Created: 2026-08-26

import { ChartContainer } from "@mui/x-charts/ChartContainer";
import { BarPlot } from "@mui/x-charts/BarChart";
import { ChartsXAxis } from "@mui/x-charts/ChartsXAxis";
import { ChartsYAxis } from "@mui/x-charts/ChartsYAxis";
import { ChartsGrid } from "@mui/x-charts/ChartsGrid";
import { ChartsReferenceLine } from "@mui/x-charts/ChartsReferenceLine";
import { useXScale, useYScale } from "@mui/x-charts/hooks";
import Box from "@mui/material/Box";
import Typography from "@mui/material/Typography";

const t = window.ANYPLOT_TOKENS;

// Churn-prediction random forest, sklearn.inspection.permutation_importance
// (n_repeats=10) — decrease in held-out accuracy when each feature is
// shuffled. Sorted so the strongest driver renders at the top of the ranking.
const FEATURES = [
  "contract_type",
  "tenure_months",
  "monthly_charges",
  "total_charges",
  "tech_support",
  "online_security",
  "support_calls",
  "internet_service",
  "payment_method",
  "paperless_billing",
  "dependents",
  "streaming_tv",
  "partner",
  "multiple_lines",
  "senior_citizen",
];
const MEANS = [0.182, 0.146, 0.098, 0.071, 0.058, 0.049, 0.041, 0.033, 0.026, 0.019, 0.014, 0.009, 0.006, 0.003, -0.004];
const STDS  = [0.021, 0.018, 0.015, 0.014, 0.012, 0.011, 0.010, 0.009, 0.008, 0.007, 0.006, 0.006, 0.005, 0.005, 0.004];

// --- Colour: sequential Imprint colormap (imprint_seq), one stop per bar ----
function hexToRgb(hex) {
  const int = parseInt(hex.slice(1), 16);
  return [(int >> 16) & 255, (int >> 8) & 255, int & 255];
}

function lerp(a, b, ratio) {
  return Math.round(a + (b - a) * ratio);
}

function imprintSeqInterpolator(stops) {
  const [low, high] = stops.map(hexToRgb);
  return (position) => {
    const ratio = Math.min(1, Math.max(0, position));
    const [r, g, b] = [0, 1, 2].map((channel) => lerp(low[channel], high[channel], ratio));
    return `rgb(${r}, ${g}, ${b})`;
  };
}

const seqColor = imprintSeqInterpolator(t.seq);
const MIN_MEAN = Math.min(...MEANS);
const MAX_MEAN = Math.max(...MEANS);
const BAR_COLORS = MEANS.map((v) => seqColor((v - MIN_MEAN) / (MAX_MEAN - MIN_MEAN)));

// Horizontal ±1 SD whiskers across the shuffle repetitions, drawn with the
// CartesianContext scales so they line up exactly with the bars underneath.
function ErrorBars() {
  const xScale = useXScale("x");
  const yScale = useYScale("y");
  if (!xScale || !yScale) return null;

  const bw = yScale.bandwidth();
  const cap = bw * 0.34;

  return (
    <g>
      {FEATURES.map((feature, i) => {
        const cy = yScale(feature) + bw / 2;
        const xLo = xScale(MEANS[i] - STDS[i]);
        const xHi = xScale(MEANS[i] + STDS[i]);
        return (
          <g key={feature} stroke={t.ink} strokeWidth={3} strokeOpacity={0.8} strokeLinecap="round">
            <line x1={xLo} y1={cy} x2={xHi} y2={cy} />
            <line x1={xLo} y1={cy - cap} x2={xLo} y2={cy + cap} />
            <line x1={xHi} y1={cy - cap} x2={xHi} y2={cy + cap} />
          </g>
        );
      })}
    </g>
  );
}

export default function Chart() {
  const W = window.ANYPLOT_SIZE.width; // 1600 CSS px (landscape mount)
  const H = window.ANYPLOT_SIZE.height; // 900 CSS px
  const CHART_TOP = 84;

  const title = "Churn Prediction Model · bar-permutation-importance · javascript · muix · anyplot.ai";
  const titleSize = title.length > 67 ? Math.round(22 * 67 / title.length) : 22;

  return (
    <Box sx={{ position: "relative", width: W, height: H, bgcolor: t.pageBg }}>
      {/* Title + subtitle */}
      <Box sx={{ position: "absolute", top: 22, left: 56, right: 56 }}>
        <Typography sx={{ color: t.ink, fontSize: titleSize, fontWeight: 500, lineHeight: 1.25 }}>
          {title}
        </Typography>
        <Typography sx={{ color: t.inkSoft, fontSize: 14, mt: 0.5 }}>
          Decrease in held-out accuracy after shuffling each feature, ±1 SD across 10 repetitions
        </Typography>
      </Box>

      {/* Chart */}
      <Box sx={{ position: "absolute", top: CHART_TOP, left: 0, right: 0, bottom: 0 }}>
        <ChartContainer
          width={W}
          height={H - CHART_TOP}
          series={[
            {
              type: "bar",
              id: "importance",
              data: MEANS,
              layout: "horizontal",
              xAxisId: "x",
              yAxisId: "y",
              label: "Permutation importance",
              valueFormatter: (v, ctx) => {
                const i = ctx?.dataIndex ?? 0;
                return `${v.toFixed(3)} ± ${STDS[i].toFixed(3)} accuracy`;
              },
            },
          ]}
          xAxis={[
            {
              id: "x",
              scaleType: "linear",
              min: -0.02,
              max: 0.22,
              label: "Mean Decrease in Accuracy",
              labelStyle: { fontSize: 16, fill: t.ink },
              tickLabelStyle: { fontSize: 14, fill: t.inkSoft },
              tickInterval: [0, 0.04, 0.08, 0.12, 0.16, 0.2],
            },
          ]}
          yAxis={[
            {
              id: "y",
              scaleType: "band",
              data: FEATURES,
              colorMap: { type: "ordinal", values: FEATURES, colors: BAR_COLORS },
              categoryGapRatio: 0.32,
              tickLabelStyle: { fontSize: 14, fill: t.inkSoft },
              disableTicks: true,
            },
          ]}
          margin={{ top: 14, right: 60, bottom: 64, left: 210 }}
          sx={{
            "& .MuiChartsAxis-line": { stroke: t.inkSoft },
            "& .MuiChartsGrid-line": { stroke: t.grid },
            "& .MuiBarElement-root": { stroke: t.pageBg, strokeWidth: 1.5 },
          }}
        >
          <ChartsGrid vertical />
          <BarPlot skipAnimation borderRadius={3} />
          <ErrorBars />
          <ChartsReferenceLine
            x={0}
            axisId="x"
            lineStyle={{ stroke: t.ink, strokeWidth: 2, strokeOpacity: 0.55 }}
          />
          <ChartsXAxis axisId="x" />
          <ChartsYAxis axisId="y" />
        </ChartContainer>
      </Box>
    </Box>
  );
}
Runnable source as JSON, for any HTTP client: https://api.anyplot.ai/specs/bar-permutation-importance/muix/code. Any spec id and library id listed in llms-full.txt fit the same URL shape; every URL below is complete and callable.
{
  "spec_id": "bar-permutation-importance",
  "language": "javascript",
  "library": "muix",
  "page": "https://anyplot.ai/bar-permutation-importance/javascript/muix",
  "hub": "https://anyplot.ai/bar-permutation-importance",
  "code_json": "https://api.anyplot.ai/specs/bar-permutation-importance/muix/code",
  "spec_json": "https://api.anyplot.ai/specs/bar-permutation-importance",
  "render_light_png": "https://storage.googleapis.com/anyplot-images/plots/bar-permutation-importance/javascript/muix/plot-light.png",
  "render_dark_png": "https://storage.googleapis.com/anyplot-images/plots/bar-permutation-importance/javascript/muix/plot-dark.png",
  "interactive_light_html": "https://storage.googleapis.com/anyplot-images/plots/bar-permutation-importance/javascript/muix/plot-light.html",
  "interactive_dark_html": "https://storage.googleapis.com/anyplot-images/plots/bar-permutation-importance/javascript/muix/plot-dark.html",
  "quality_score": 92.0,
  "license": "MIT",
  "guide": "https://anyplot.ai/llms.txt"
}
Part of Permutation Feature Importance Plot on anyplot.ai.