The same plot in 14 other libraries — JavaScript: Chart.js, Apache ECharts, Highcharts, MUI X Charts; Python: Altair, Bokeh, lets-plot, Matplotlib, Plotly, plotnine, Pygal, Seaborn; R: ggplot2; Julia: Makie.jl. Compare all 15 side by side: Permutation Feature Importance Plot in Python, R, Julia and JavaScript.
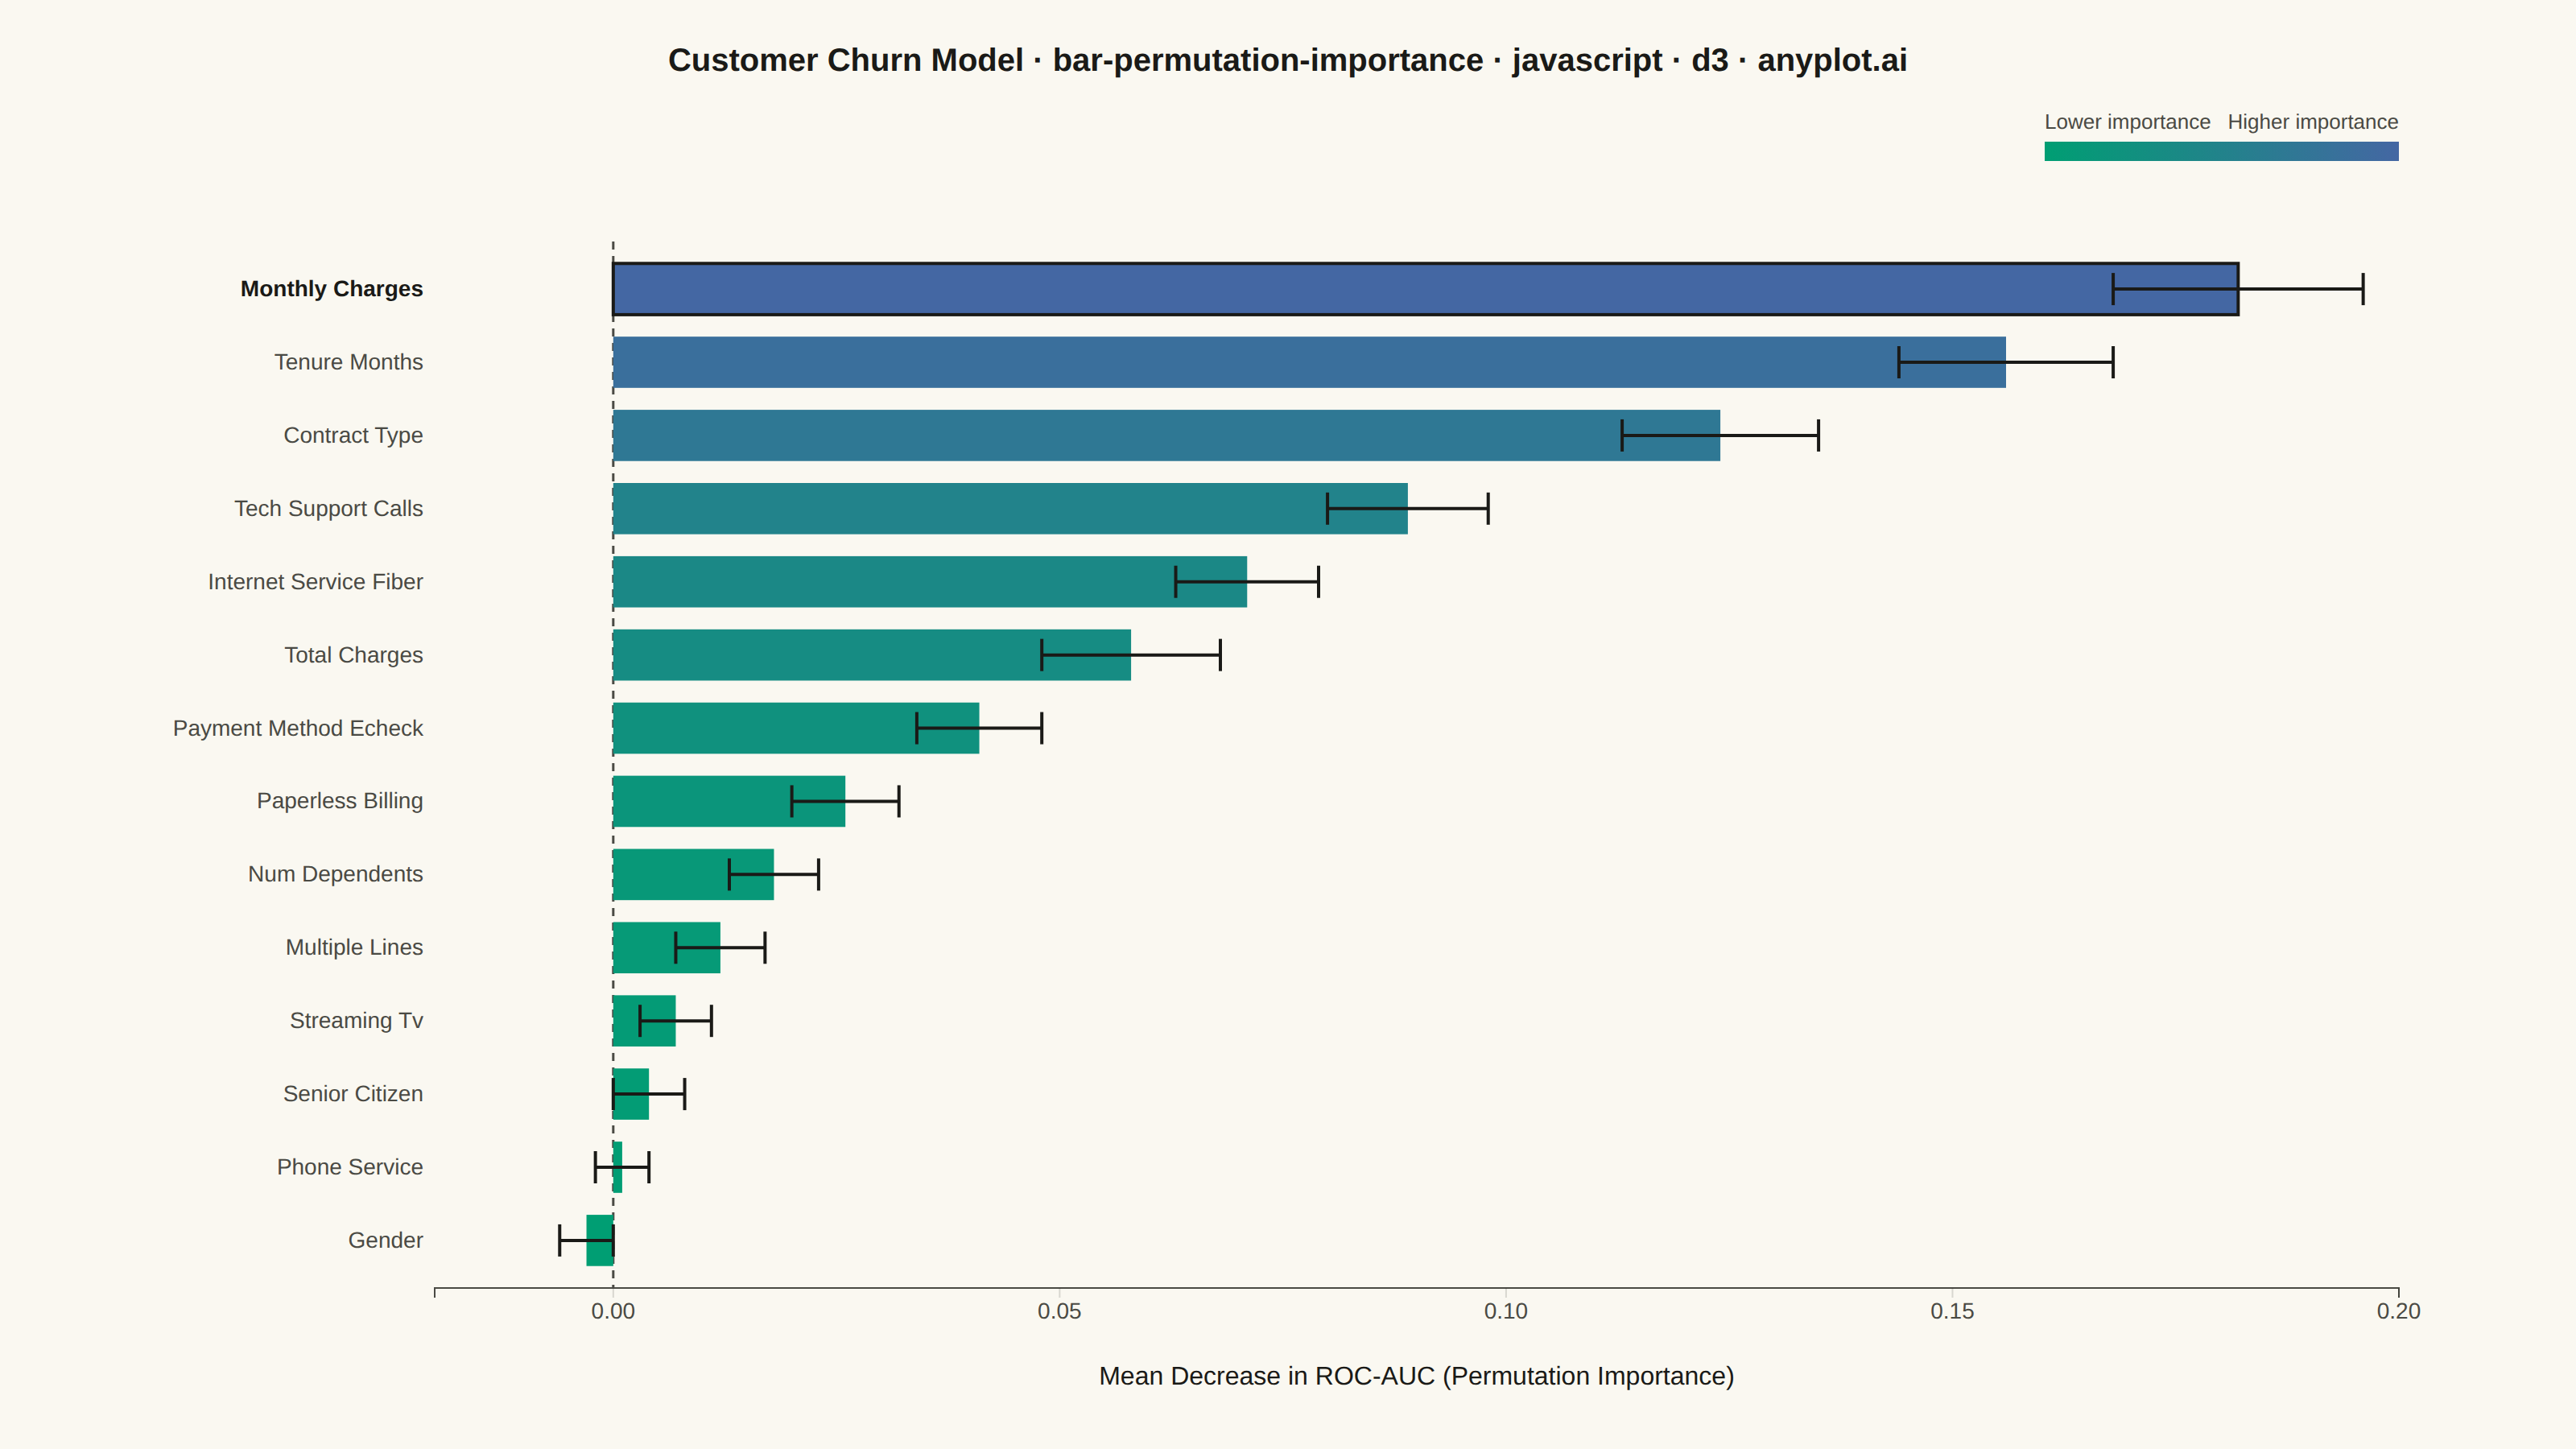
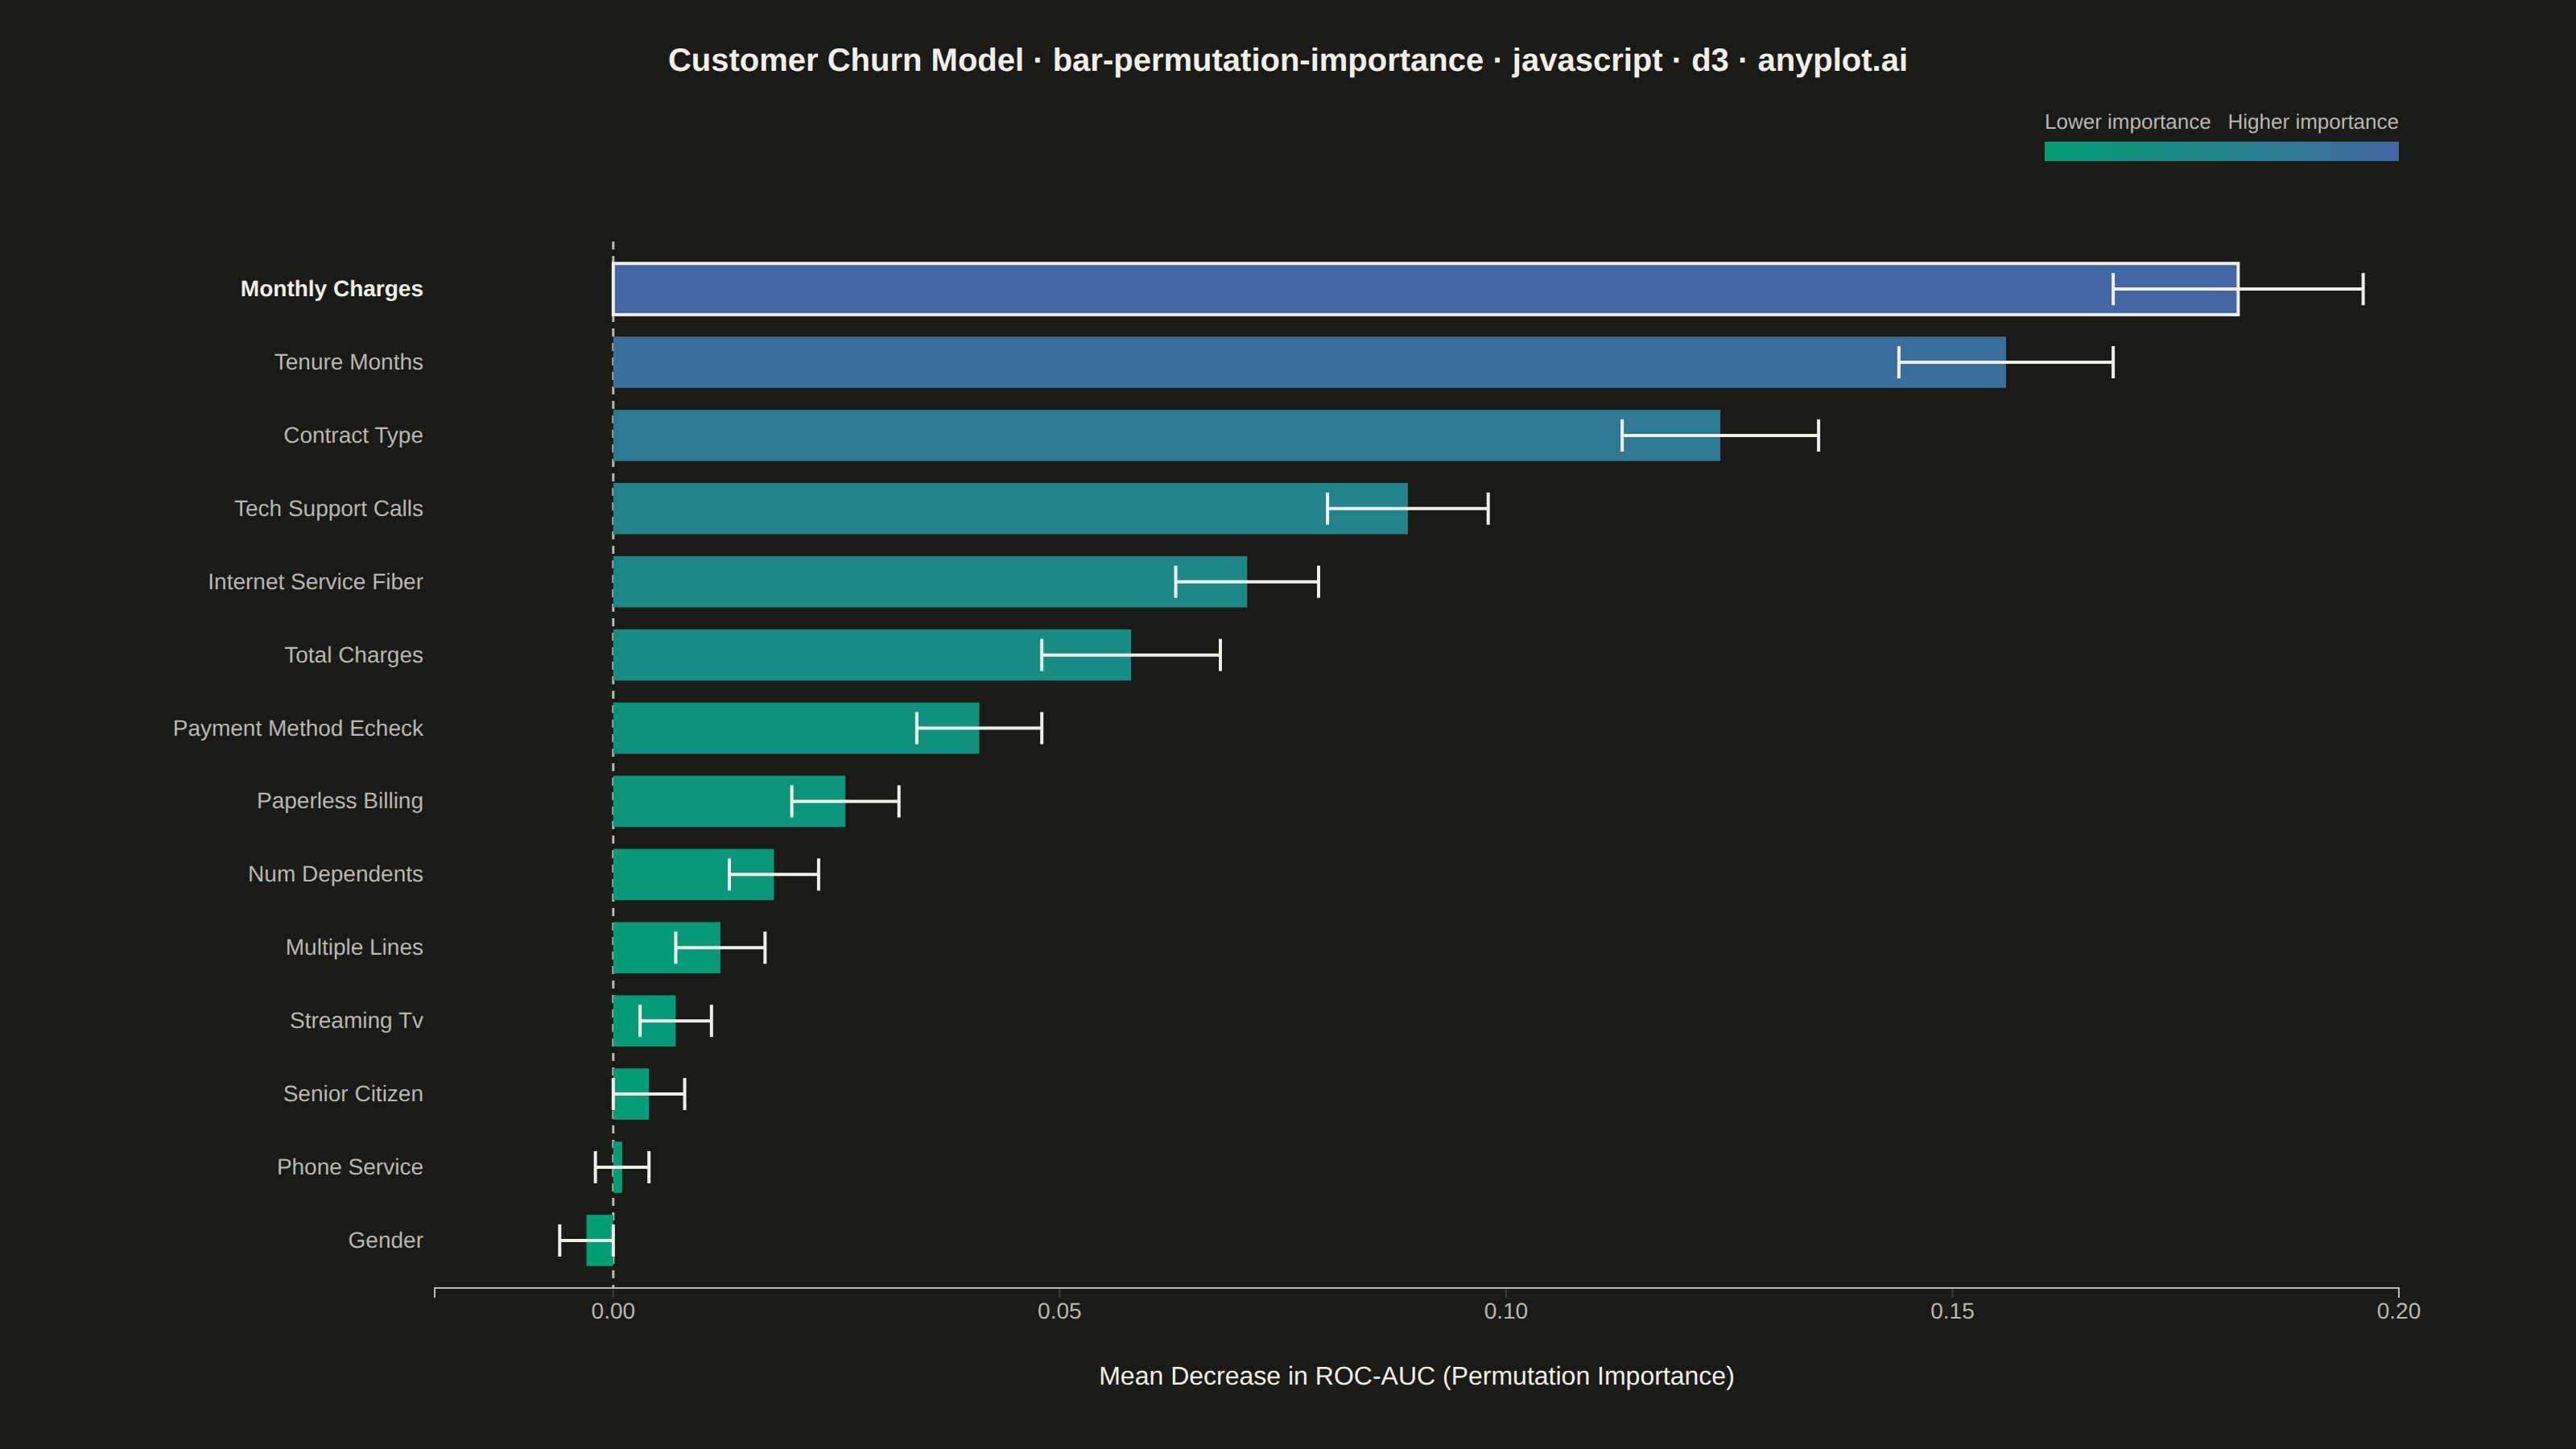
A horizontal bar chart displaying permutation feature importance from machine learning models, showing the decrease in model score when each feature is randomly shuffled. Unlike model-specific feature importances, permutation importance is model-agnostic and measures how much the model's performance degrades when a feature's relationship with the target is broken. Error bars indicate variability across multiple shuffles, providing a confidence measure for each importance score.
// anyplot.ai
// bar-permutation-importance: Permutation Feature Importance Plot
// Library: d3 7.9.0 | JavaScript 22.23.2
// Quality: 92/100 | Created: 2026-08-26

const t = window.ANYPLOT_TOKENS;
const { width, height } = window.ANYPLOT_SIZE;
const margin = { top: 150, right: 110, bottom: 100, left: 270 };
const iw = width - margin.left - margin.right;
const ih = height - margin.top - margin.bottom;

// --- Data: permutation importance for a churn-prediction model -------------
// (feature, mean decrease in ROC-AUC across n_repeats=10 shuffles, std dev)
const data = [
  { feature: "monthly_charges", mean: 0.182, std: 0.014 },
  { feature: "tenure_months", mean: 0.156, std: 0.012 },
  { feature: "contract_type", mean: 0.124, std: 0.011 },
  { feature: "tech_support_calls", mean: 0.089, std: 0.009 },
  { feature: "internet_service_fiber", mean: 0.071, std: 0.008 },
  { feature: "total_charges", mean: 0.058, std: 0.01 },
  { feature: "payment_method_echeck", mean: 0.041, std: 0.007 },
  { feature: "paperless_billing", mean: 0.026, std: 0.006 },
  { feature: "num_dependents", mean: 0.018, std: 0.005 },
  { feature: "multiple_lines", mean: 0.012, std: 0.005 },
  { feature: "streaming_tv", mean: 0.007, std: 0.004 },
  { feature: "senior_citizen", mean: 0.004, std: 0.004 },
  { feature: "phone_service", mean: 0.001, std: 0.003 },
  { feature: "gender", mean: -0.003, std: 0.003 },
]; // pre-sorted by mean, descending — highest importance at top

const labelize = (s) =>
  s
    .split("_")
    .map((w) => w[0].toUpperCase() + w.slice(1))
    .join(" ");

// --- SVG mount ---------------------------------------------------------------
const svg = d3.select("#container").append("svg").attr("width", width).attr("height", height);
const g = svg.append("g").attr("transform", `translate(${margin.left},${margin.top})`);

// --- Scales --------------------------------------------------------------------
const y = d3
  .scaleBand()
  .domain(data.map((d) => d.feature))
  .range([0, ih])
  .padding(0.3);

const x = d3
  .scaleLinear()
  .domain([d3.min(data, (d) => d.mean - d.std), d3.max(data, (d) => d.mean + d.std)])
  .nice()
  .range([0, iw]);

const color = d3.scaleSequential(d3.interpolateRgbBasis(t.seq)).domain(d3.extent(data, (d) => d.mean));

// --- Reference line at x = 0 ----------------------------------------------------
g.append("line")
  .attr("x1", x(0))
  .attr("x2", x(0))
  .attr("y1", 0)
  .attr("y2", ih)
  .attr("stroke", t.inkSoft)
  .attr("stroke-width", 1.5)
  .attr("stroke-dasharray", "5,4");

// --- Bars ------------------------------------------------------------------------
const bars = g.selectAll(".bar").data(data).join("g").attr("class", "bar");

bars
  .append("rect")
  .attr("x", (d) => Math.min(x(0), x(d.mean)))
  .attr("y", (d) => y(d.feature))
  .attr("width", (d) => Math.abs(x(d.mean) - x(0)))
  .attr("height", y.bandwidth())
  .attr("fill", (d) => color(d.mean))
  .attr("stroke", (d, i) => (i === 0 ? t.ink : "none"))
  .attr("stroke-width", (d, i) => (i === 0 ? 2 : 0));

// --- Error bars (horizontal, showing shuffle variability) -----------------------
const capHalf = Math.min(10, y.bandwidth() * 0.35);
bars.each(function (d) {
  const cy = y(d.feature) + y.bandwidth() / 2;
  const errG = d3.select(this);
  errG
    .append("line")
    .attr("x1", x(d.mean - d.std))
    .attr("x2", x(d.mean + d.std))
    .attr("y1", cy)
    .attr("y2", cy)
    .attr("stroke", t.ink)
    .attr("stroke-width", 2);
  for (const xv of [d.mean - d.std, d.mean + d.std]) {
    errG
      .append("line")
      .attr("x1", x(xv))
      .attr("x2", x(xv))
      .attr("y1", cy - capHalf)
      .attr("y2", cy + capHalf)
      .attr("stroke", t.ink)
      .attr("stroke-width", 2);
  }
});

// --- Axes --------------------------------------------------------------------
const xAxis = g.append("g").attr("transform", `translate(0,${ih})`).call(d3.axisBottom(x).ticks(6).tickFormat(d3.format(".2f")));
const yAxis = g.append("g").call(d3.axisLeft(y).tickFormat(labelize).tickSize(0));

xAxis.selectAll("text").attr("fill", t.inkSoft).style("font-size", "14px");
xAxis.selectAll("line").attr("stroke", t.grid);
xAxis.select(".domain").attr("stroke", t.inkSoft);

yAxis.selectAll("text").attr("fill", t.inkSoft).style("font-size", "14px").attr("dx", "-4px");
yAxis.select(".domain").remove();

// Emphasize the top-ranked feature (the story: which feature matters most)
yAxis
  .selectAll("text")
  .filter((d, i) => i === 0)
  .attr("fill", t.ink)
  .style("font-weight", "700");

g.append("text")
  .attr("x", iw / 2)
  .attr("y", ih + 60)
  .attr("text-anchor", "middle")
  .attr("fill", t.ink)
  .style("font-size", "16px")
  .text("Mean Decrease in ROC-AUC (Permutation Importance)");

// --- Title ---------------------------------------------------------------------
const title = "Customer Churn Model · bar-permutation-importance · javascript · d3 · anyplot.ai";
const titleSize = title.length > 67 ? Math.max(20, Math.round((22 * 67) / title.length)) : 22;
svg
  .append("text")
  .attr("x", width / 2)
  .attr("y", 44)
  .attr("text-anchor", "middle")
  .attr("fill", t.ink)
  .style("font-size", `${titleSize}px`)
  .style("font-weight", "600")
  .text(title);

// --- Color legend (sequential gradient encoding importance magnitude) ----------
const legendW = 220;
const legendX = width - margin.right - legendW;
const legendY = 88;
const gradientId = "importance-gradient";
const defs = svg.append("defs");
const gradient = defs.append("linearGradient").attr("id", gradientId).attr("x1", "0%").attr("x2", "100%");
gradient.append("stop").attr("offset", "0%").attr("stop-color", t.seq[0]);
gradient.append("stop").attr("offset", "100%").attr("stop-color", t.seq[1]);

svg
  .append("rect")
  .attr("x", legendX)
  .attr("y", legendY)
  .attr("width", legendW)
  .attr("height", 12)
  .attr("fill", `url(#${gradientId})`);

svg
  .append("text")
  .attr("x", legendX)
  .attr("y", legendY - 8)
  .attr("text-anchor", "start")
  .attr("fill", t.inkSoft)
  .style("font-size", "13px")
  .text("Lower importance");

svg
  .append("text")
  .attr("x", legendX + legendW)
  .attr("y", legendY - 8)
  .attr("text-anchor", "end")
  .attr("fill", t.inkSoft)
  .style("font-size", "13px")
  .text("Higher importance");
Runnable source as JSON, for any HTTP client: https://api.anyplot.ai/specs/bar-permutation-importance/d3/code. Any spec id and library id listed in llms-full.txt fit the same URL shape; every URL below is complete and callable.
{
  "spec_id": "bar-permutation-importance",
  "language": "javascript",
  "library": "d3",
  "page": "https://anyplot.ai/bar-permutation-importance/javascript/d3",
  "hub": "https://anyplot.ai/bar-permutation-importance",
  "code_json": "https://api.anyplot.ai/specs/bar-permutation-importance/d3/code",
  "spec_json": "https://api.anyplot.ai/specs/bar-permutation-importance",
  "render_light_png": "https://storage.googleapis.com/anyplot-images/plots/bar-permutation-importance/javascript/d3/plot-light.png",
  "render_dark_png": "https://storage.googleapis.com/anyplot-images/plots/bar-permutation-importance/javascript/d3/plot-dark.png",
  "interactive_light_html": "https://storage.googleapis.com/anyplot-images/plots/bar-permutation-importance/javascript/d3/plot-light.html",
  "interactive_dark_html": "https://storage.googleapis.com/anyplot-images/plots/bar-permutation-importance/javascript/d3/plot-dark.html",
  "quality_score": 92.0,
  "license": "MIT",
  "guide": "https://anyplot.ai/llms.txt"
}
Part of Permutation Feature Importance Plot on anyplot.ai.