The same plot in 14 other libraries — JavaScript: Chart.js, D3.js, Apache ECharts, MUI X Charts; Python: Altair, Bokeh, lets-plot, Matplotlib, Plotly, plotnine, Pygal, Seaborn; R: ggplot2; Julia: Makie.jl. Compare all 15 side by side: Permutation Feature Importance Plot in Python, R, Julia and JavaScript.
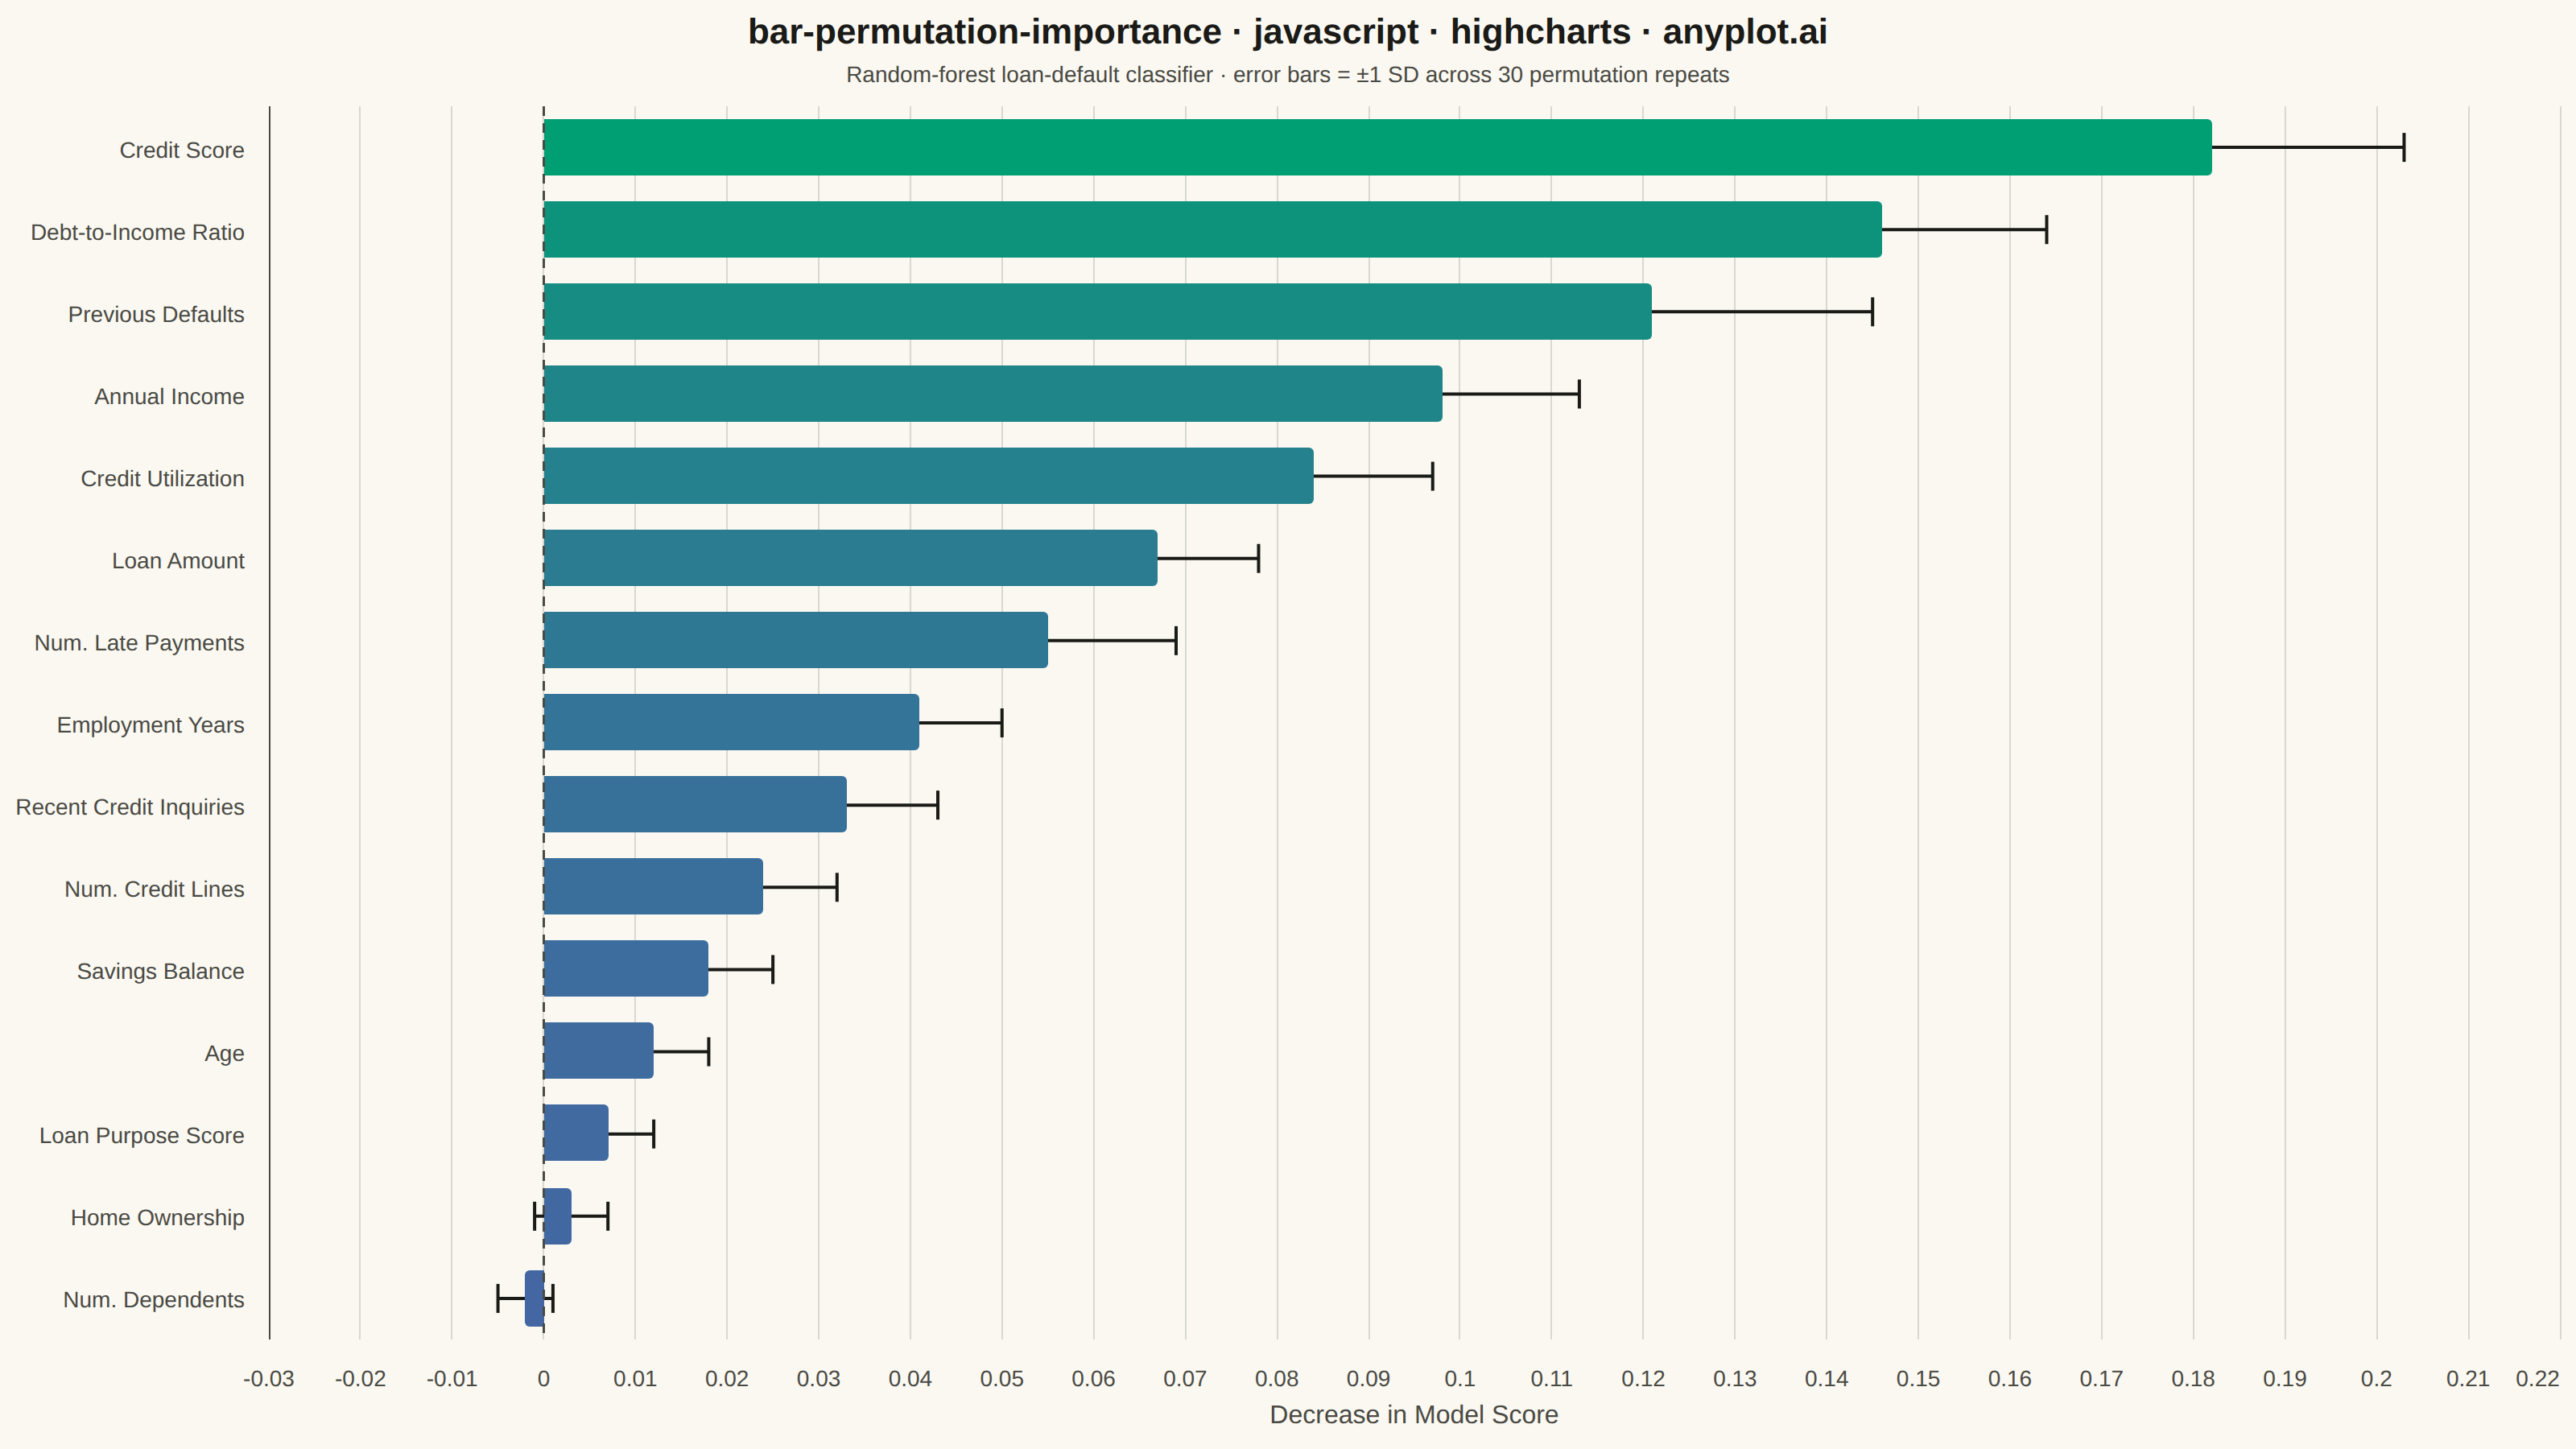
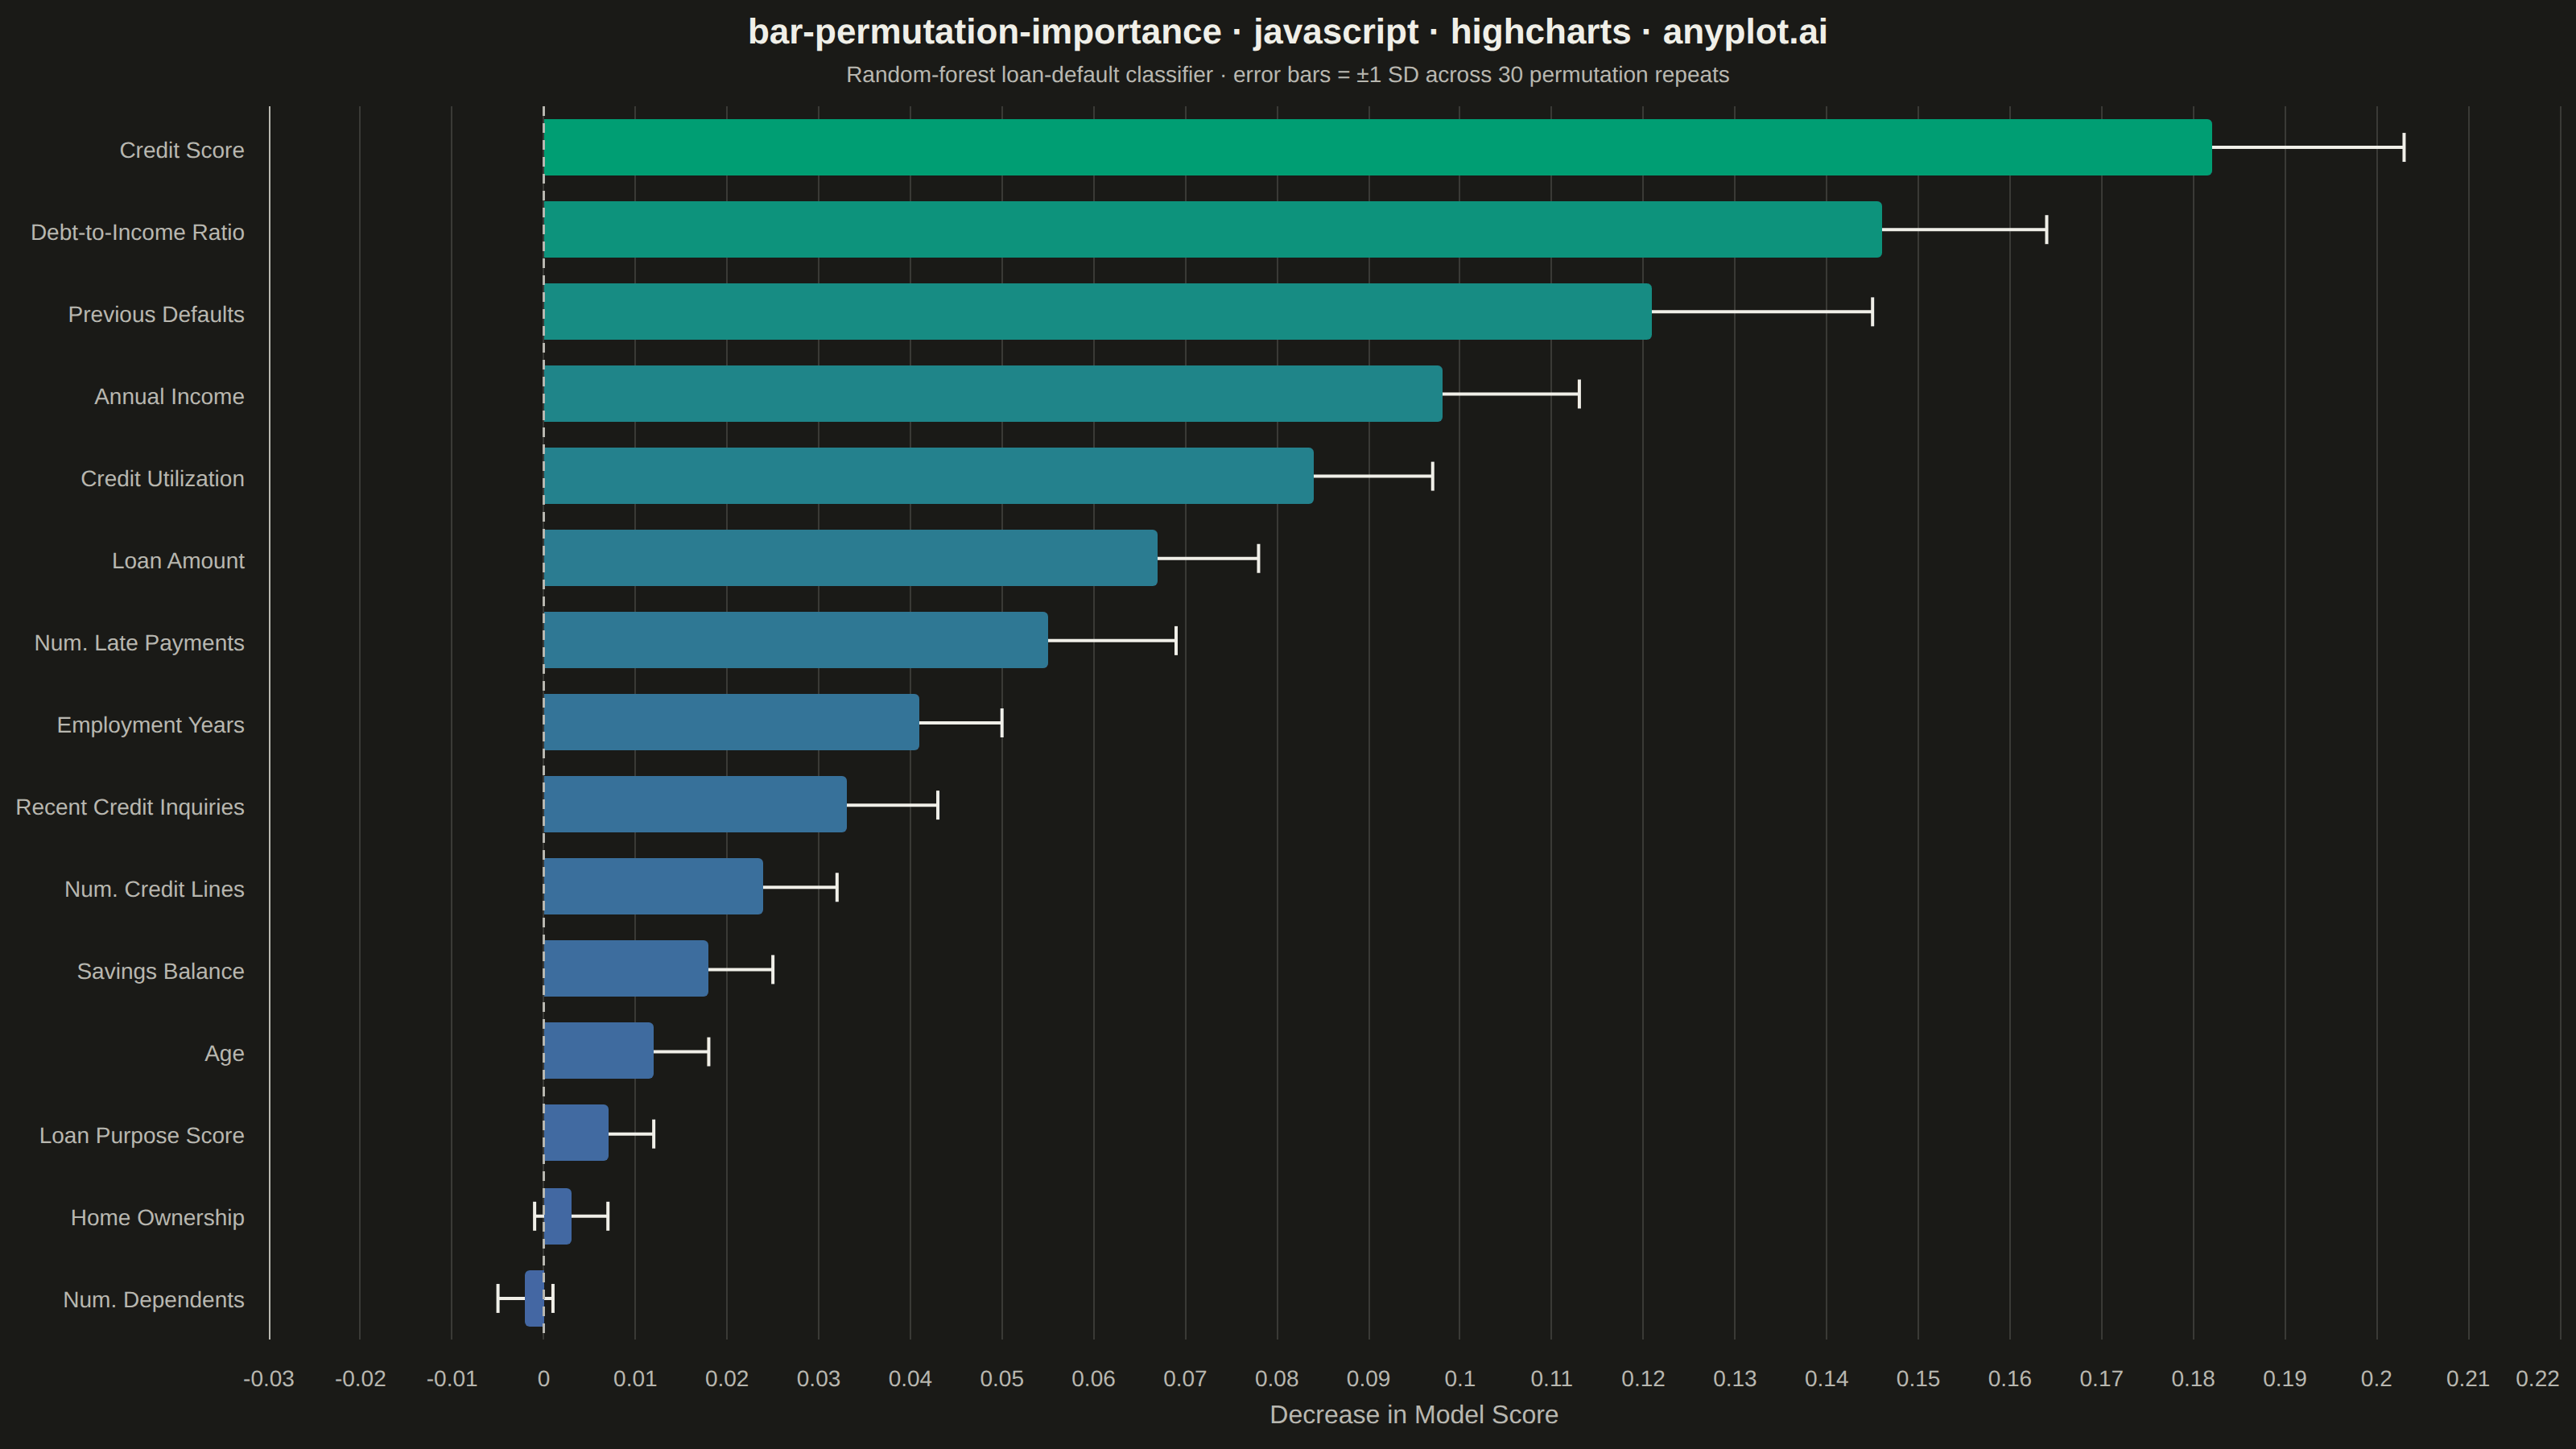
A horizontal bar chart displaying permutation feature importance from machine learning models, showing the decrease in model score when each feature is randomly shuffled. Unlike model-specific feature importances, permutation importance is model-agnostic and measures how much the model's performance degrades when a feature's relationship with the target is broken. Error bars indicate variability across multiple shuffles, providing a confidence measure for each importance score.
// anyplot.ai
// bar-permutation-importance: Permutation Feature Importance Plot
// Library: highcharts 12.6.0 | JavaScript 22.23.2
// Quality: 92/100 | Created: 2026-08-26

//# anyplot-orientation: landscape
const t = window.ANYPLOT_TOKENS;

// --- Data (in-memory, deterministic) ----------------------------------------
// Permutation importance for a random-forest classifier predicting loan
// default risk (n_repeats = 30). Sorted by importance_mean, highest first.
const importance = [
  { feature: "Credit Score", mean: 0.182, std: 0.021 },
  { feature: "Debt-to-Income Ratio", mean: 0.146, std: 0.018 },
  { feature: "Previous Defaults", mean: 0.121, std: 0.024 },
  { feature: "Annual Income", mean: 0.098, std: 0.015 },
  { feature: "Credit Utilization", mean: 0.084, std: 0.013 },
  { feature: "Loan Amount", mean: 0.067, std: 0.011 },
  { feature: "Num. Late Payments", mean: 0.055, std: 0.014 },
  { feature: "Employment Years", mean: 0.041, std: 0.009 },
  { feature: "Recent Credit Inquiries", mean: 0.033, std: 0.01 },
  { feature: "Num. Credit Lines", mean: 0.024, std: 0.008 },
  { feature: "Savings Balance", mean: 0.018, std: 0.007 },
  { feature: "Age", mean: 0.012, std: 0.006 },
  { feature: "Loan Purpose Score", mean: 0.007, std: 0.005 },
  { feature: "Home Ownership", mean: 0.003, std: 0.004 },
  { feature: "Num. Dependents", mean: -0.002, std: 0.003 },
];

// --- Sequential color gradient (Imprint imprint_seq), mapped to importance --
function hexToRgb(hex) {
  const n = parseInt(hex.slice(1), 16);
  return [(n >> 16) & 255, (n >> 8) & 255, n & 255];
}
function lerpColor(hexA, hexB, frac) {
  const a = hexToRgb(hexA);
  const b = hexToRgb(hexB);
  const rgb = a.map((v, i) => Math.round(v + (b[i] - v) * frac));
  return `rgb(${rgb.join(",")})`;
}

const meanValues = importance.map((d) => d.mean);
const minMean = Math.min(...meanValues);
const maxMean = Math.max(...meanValues);
const span = maxMean - minMean || 1;

const categories = importance.map((d) => d.feature);
const data = importance.map((d) => ({
  name: d.feature,
  y: d.mean,
  color: lerpColor(t.seq[1], t.seq[0], (d.mean - minMean) / span),
}));

// --- Manual error-bar whiskers ------------------------------------------------
// The core bundle has no highcharts-more, so there is no "errorbar" series
// type. Draw real whiskers with the SVG renderer at each point's actual
// axis-computed pixel position instead — this is the documented technique for
// error bars on a plain bar/column series without the add-on module.
let errorBarGroup = null;
function drawErrorBars(chart) {
  if (errorBarGroup) errorBarGroup.destroy();
  errorBarGroup = chart.renderer.g("error-bars").add();
  const yAxis = chart.yAxis[0];
  const xAxis = chart.xAxis[0];
  const capHalf = 9;
  chart.series[0].points.forEach((point, i) => {
    const d = importance[i];
    const xPix = xAxis.toPixels(i, false);
    const loPix = yAxis.toPixels(d.mean - d.std, false);
    const hiPix = yAxis.toPixels(d.mean + d.std, false);
    chart.renderer
      .path(["M", loPix, xPix, "L", hiPix, xPix])
      .attr({ "stroke-width": 2, stroke: t.ink, zIndex: 6 })
      .add(errorBarGroup);
    [loPix, hiPix].forEach((px) => {
      chart.renderer
        .path(["M", px, xPix - capHalf, "L", px, xPix + capHalf])
        .attr({ "stroke-width": 2, stroke: t.ink, zIndex: 6 })
        .add(errorBarGroup);
    });
  });
}

// --- Chart -------------------------------------------------------------------
Highcharts.chart("container", {
  chart: {
    type: "bar",
    backgroundColor: "transparent",
    animation: false,
    style: { fontFamily: "inherit" },
    events: {
      render: function () {
        drawErrorBars(this);
      },
    },
  },
  credits: { enabled: false },
  colors: t.palette,
  title: {
    text: "bar-permutation-importance · javascript · highcharts · anyplot.ai",
    style: { color: t.ink, fontSize: "22px", fontWeight: "600" },
  },
  subtitle: {
    text: "Random-forest loan-default classifier · error bars = ±1 SD across 30 permutation repeats",
    style: { color: t.inkSoft, fontSize: "14px" },
  },
  xAxis: {
    categories,
    reversed: true,
    lineColor: t.inkSoft,
    tickColor: t.inkSoft,
    labels: { style: { color: t.inkSoft, fontSize: "14px" } },
  },
  yAxis: {
    title: { text: "Decrease in Model Score", style: { color: t.inkSoft, fontSize: "16px" } },
    gridLineColor: t.grid,
    min: -0.03,
    max: 0.22,
    labels: { style: { color: t.inkSoft, fontSize: "14px" } },
    plotLines: [{ value: 0, color: t.inkSoft, width: 1.5, dashStyle: "Dash", zIndex: 5 }],
  },
  legend: { enabled: false },
  plotOptions: {
    series: { animation: false },
    bar: { borderWidth: 0, pointPadding: 0.08, groupPadding: 0.1 },
  },
  series: [{ name: "Importance", data }],
});
Runnable source as JSON, for any HTTP client: https://api.anyplot.ai/specs/bar-permutation-importance/highcharts/code. Any spec id and library id listed in llms-full.txt fit the same URL shape; every URL below is complete and callable.
{
  "spec_id": "bar-permutation-importance",
  "language": "javascript",
  "library": "highcharts",
  "page": "https://anyplot.ai/bar-permutation-importance/javascript/highcharts",
  "hub": "https://anyplot.ai/bar-permutation-importance",
  "code_json": "https://api.anyplot.ai/specs/bar-permutation-importance/highcharts/code",
  "spec_json": "https://api.anyplot.ai/specs/bar-permutation-importance",
  "render_light_png": "https://storage.googleapis.com/anyplot-images/plots/bar-permutation-importance/javascript/highcharts/plot-light.png",
  "render_dark_png": "https://storage.googleapis.com/anyplot-images/plots/bar-permutation-importance/javascript/highcharts/plot-dark.png",
  "interactive_light_html": "https://storage.googleapis.com/anyplot-images/plots/bar-permutation-importance/javascript/highcharts/plot-light.html",
  "interactive_dark_html": "https://storage.googleapis.com/anyplot-images/plots/bar-permutation-importance/javascript/highcharts/plot-dark.html",
  "quality_score": 92.0,
  "license": "MIT",
  "guide": "https://anyplot.ai/llms.txt"
}
Part of Permutation Feature Importance Plot on anyplot.ai.