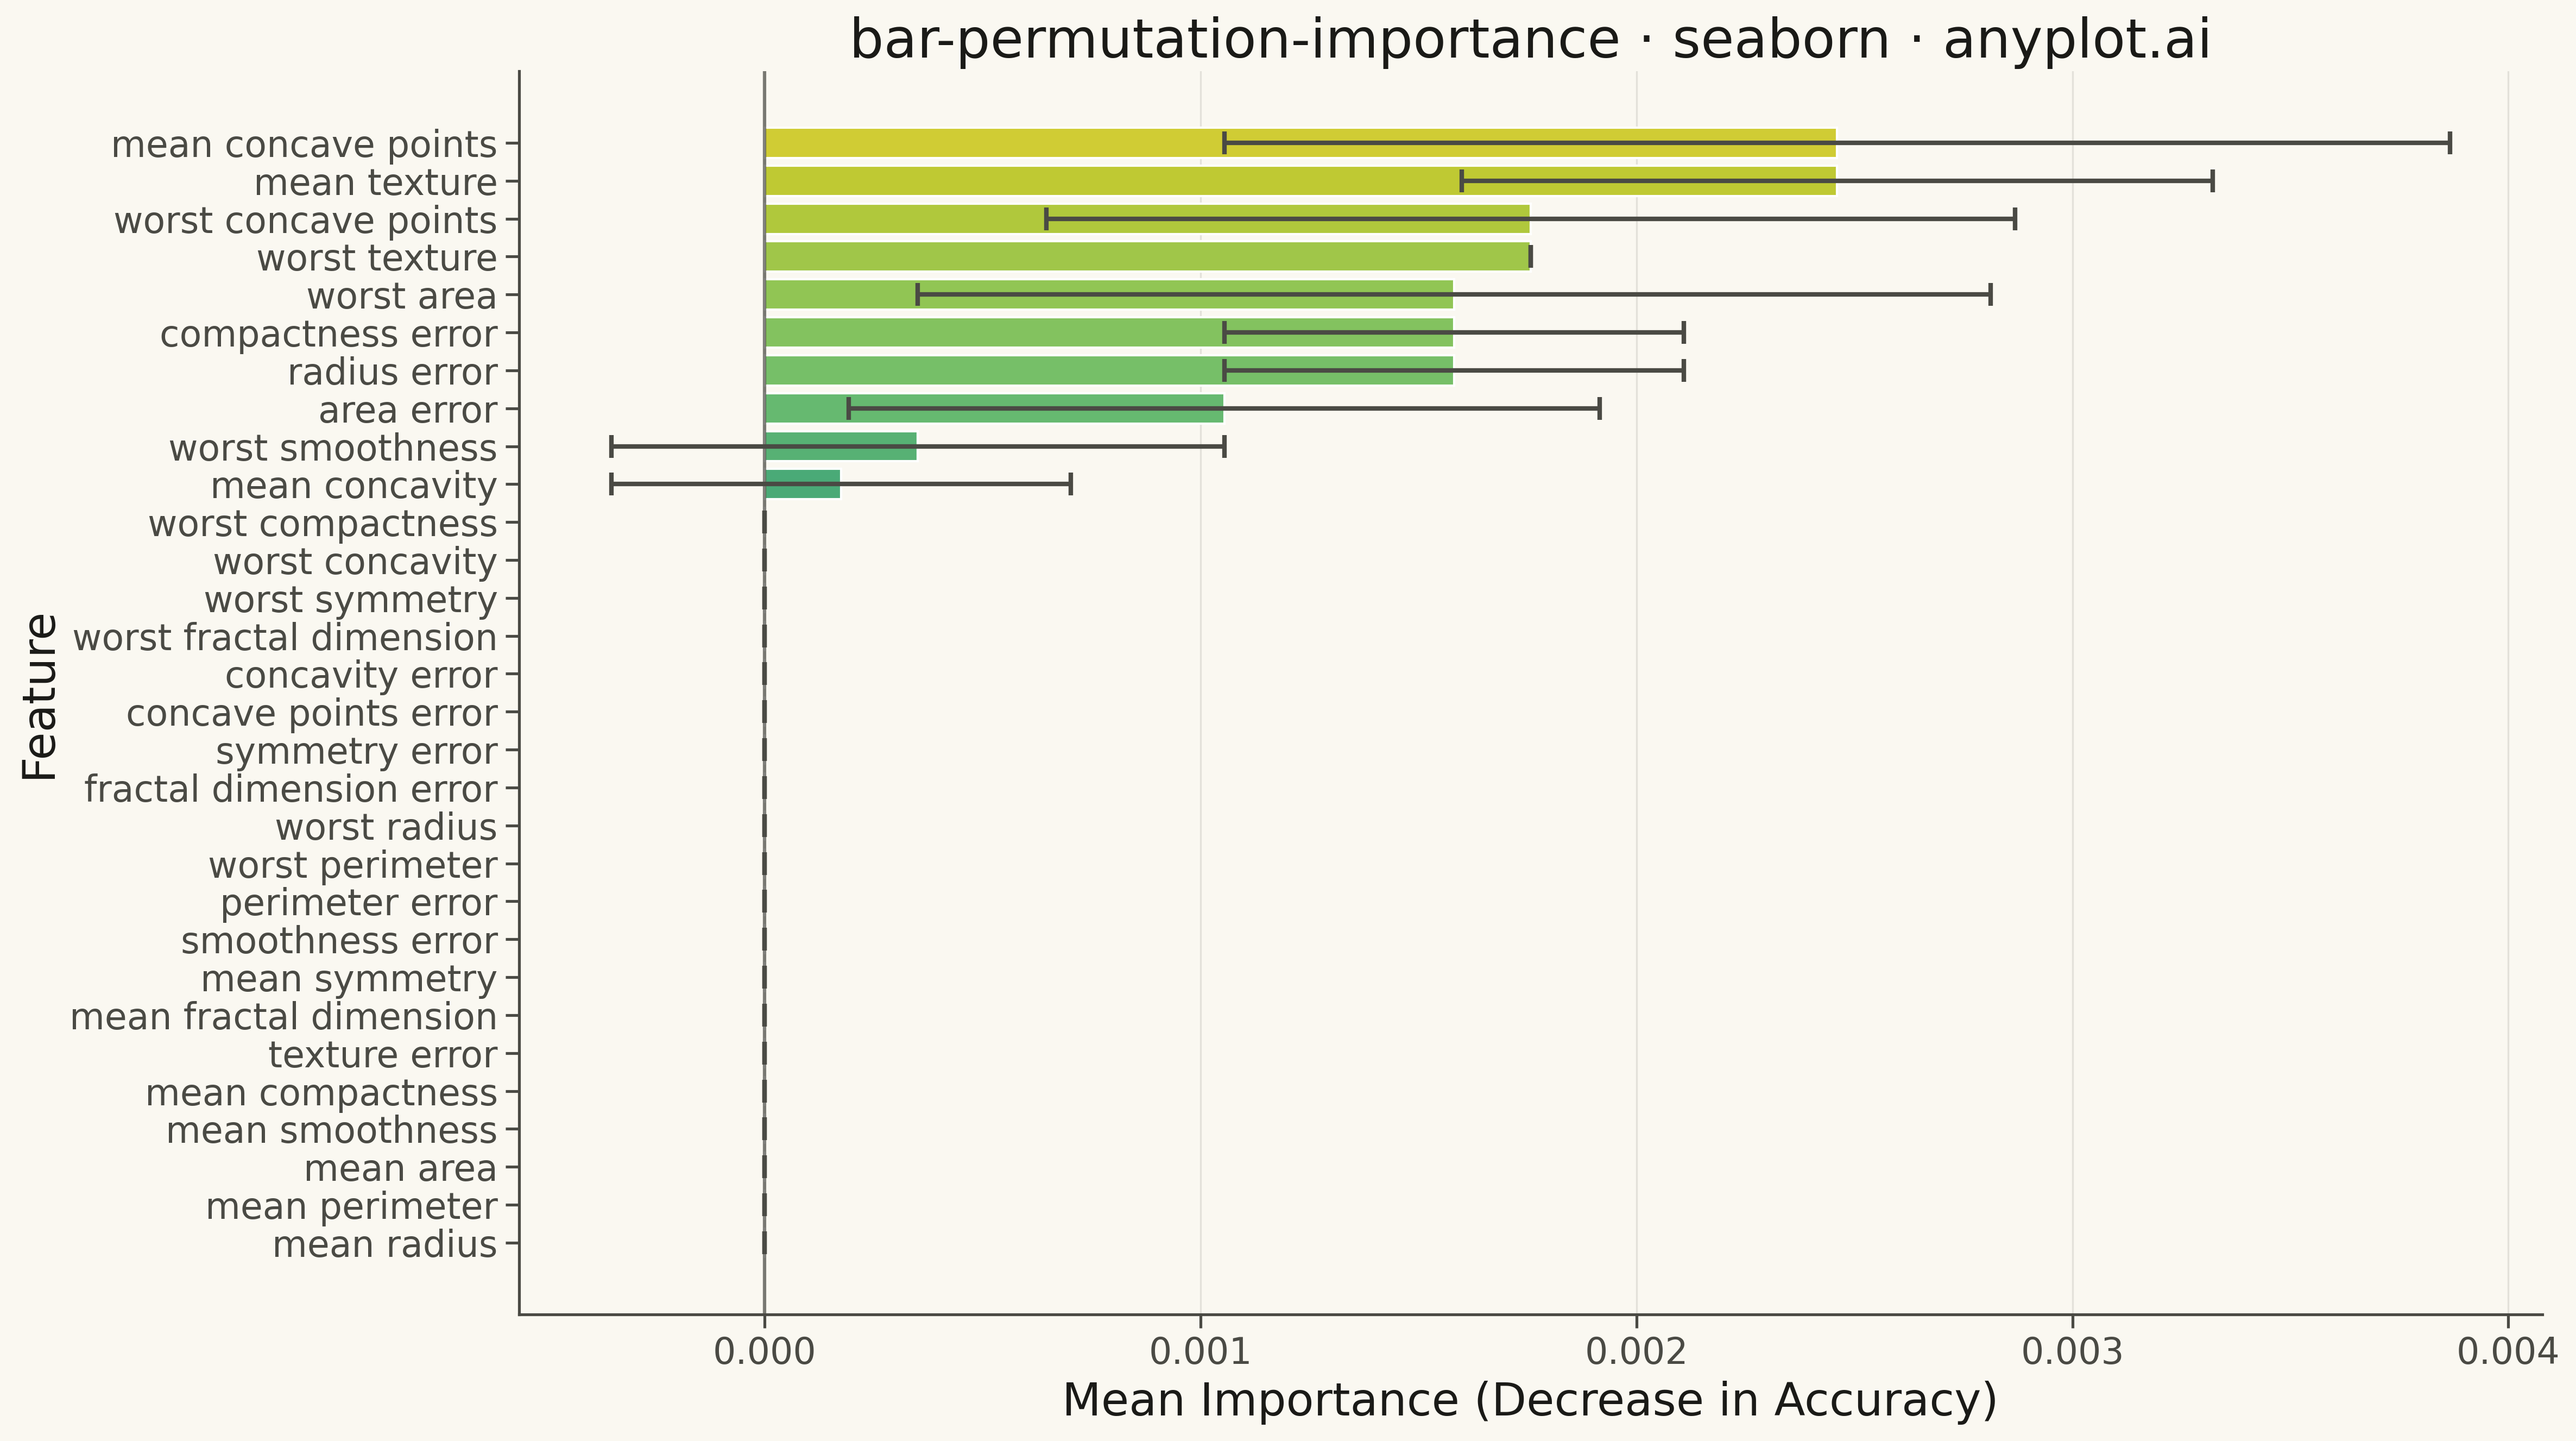
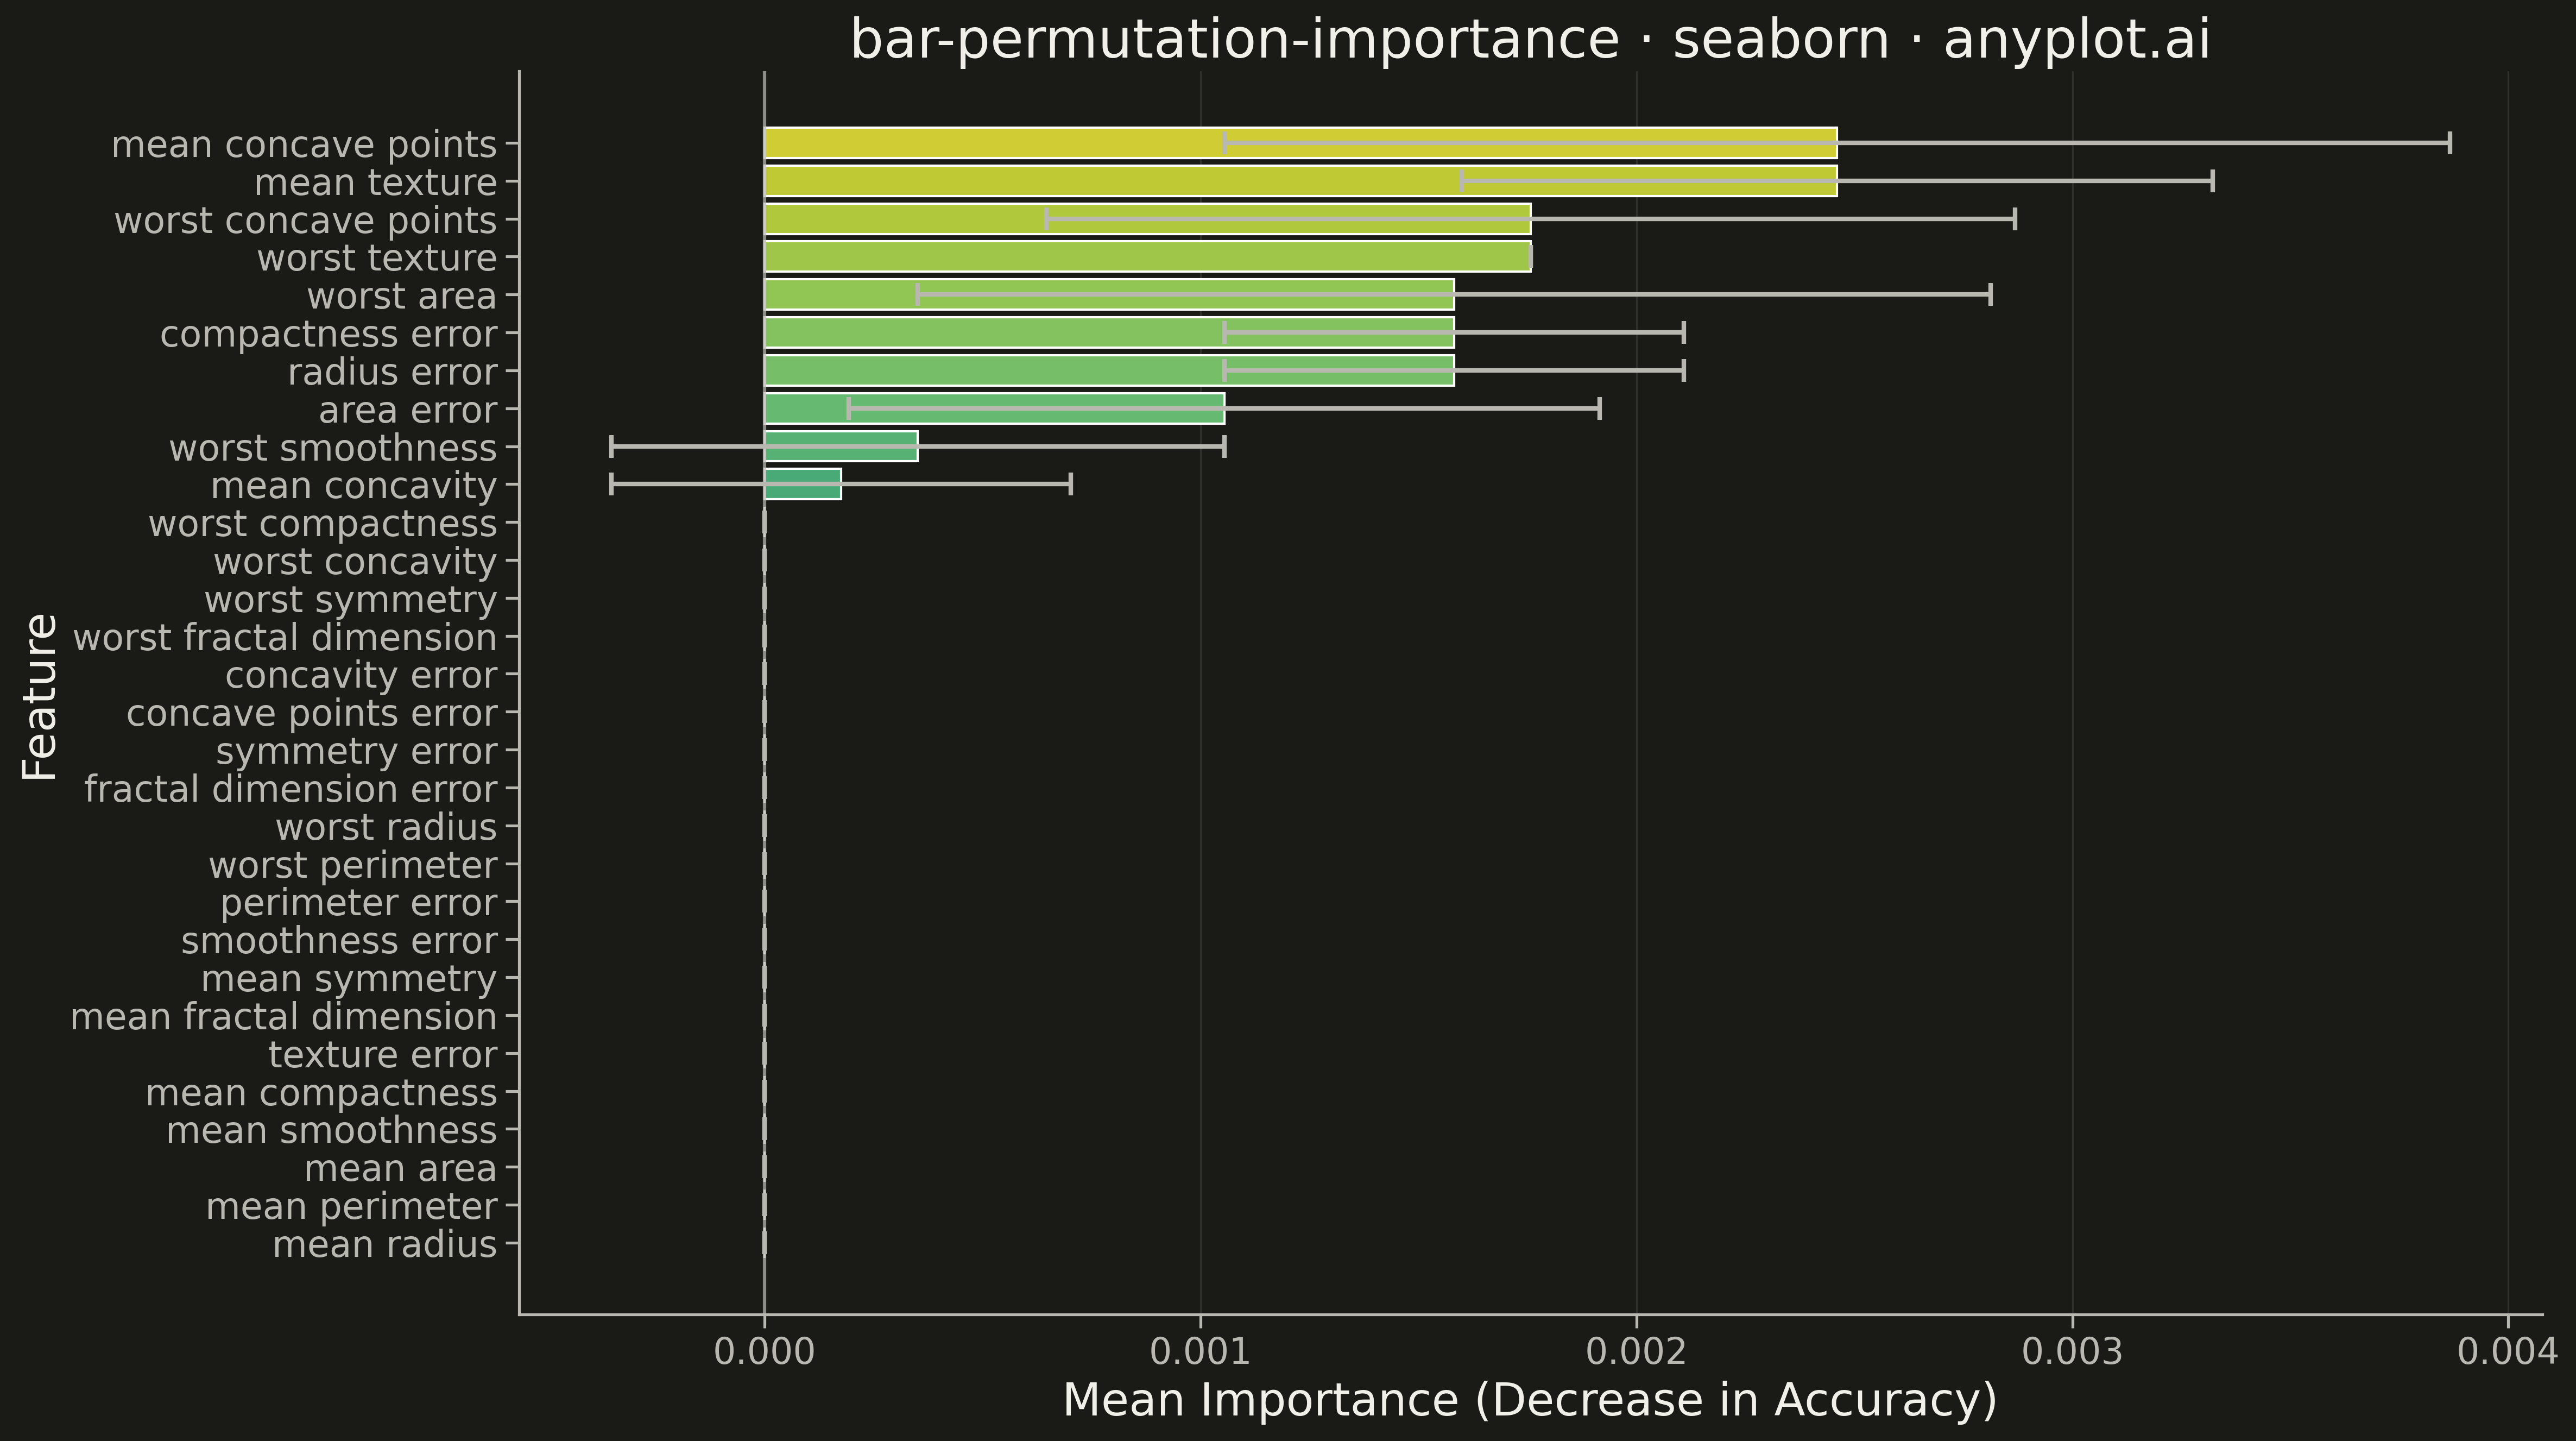
A horizontal bar chart displaying permutation feature importance from machine learning models, showing the decrease in model score when each feature is randomly shuffled. Unlike model-specific feature importances, permutation importance is model-agnostic and measures how much the model's performance degrades when a feature's relationship with the target is broken. Error bars indicate variability across multiple shuffles, providing a confidence measure for each importance score.
""" anyplot.ai
bar-permutation-importance: Permutation Feature Importance Plot
Library: seaborn 0.13.2 | Python 3.13.13
Quality: 84/100 | Updated: 2026-05-17
"""

import os

import matplotlib.pyplot as plt
import numpy as np
import seaborn as sns
from sklearn.datasets import load_breast_cancer
from sklearn.ensemble import RandomForestClassifier
from sklearn.inspection import permutation_importance


THEME = os.getenv("ANYPLOT_THEME", "light")
PAGE_BG = "#FAF8F1" if THEME == "light" else "#1A1A17"
INK = "#1A1A17" if THEME == "light" else "#F0EFE8"
INK_SOFT = "#4A4A44" if THEME == "light" else "#B8B7B0"

# Theme-adaptive setup
sns.set_theme(
    style="ticks",
    rc={
        "figure.facecolor": PAGE_BG,
        "axes.facecolor": PAGE_BG,
        "axes.edgecolor": INK_SOFT,
        "axes.labelcolor": INK,
        "text.color": INK,
        "xtick.color": INK_SOFT,
        "ytick.color": INK_SOFT,
        "grid.color": INK,
        "grid.alpha": 0.10,
    },
)

# Data - Using breast cancer dataset with permutation importance
data = load_breast_cancer()
X, y = data.data, data.target
feature_names = data.feature_names

# Train a Random Forest model
np.random.seed(42)
clf = RandomForestClassifier(n_estimators=100, random_state=42)
clf.fit(X, y)

# Calculate permutation importance
perm_importance = permutation_importance(clf, X, y, n_repeats=10, random_state=42)

# Extract importance values
importance_mean = perm_importance.importances_mean
importance_std = perm_importance.importances_std

# Sort by importance (descending)
sorted_idx = np.argsort(importance_mean)[::-1]
sorted_features = [feature_names[i] for i in sorted_idx]
sorted_mean = importance_mean[sorted_idx]
sorted_std = importance_std[sorted_idx]

# Create plot
fig, ax = plt.subplots(figsize=(16, 9), facecolor=PAGE_BG)
ax.set_facecolor(PAGE_BG)

# Create horizontal bar plot with viridis palette
colors = sns.color_palette("viridis", n_colors=len(sorted_features))
color_order = list(reversed(colors))

y_positions = np.arange(len(sorted_features))
sns.barplot(x=sorted_mean, y=sorted_features, hue=sorted_features, palette=color_order, ax=ax, orient="h", legend=False)

# Add error bars manually
ax.errorbar(sorted_mean, y_positions, xerr=sorted_std, fmt="none", ecolor=INK_SOFT, elinewidth=2, capsize=5, capthick=2)

# Add vertical reference line at x=0
ax.axvline(x=0, color=INK_SOFT, linestyle="-", linewidth=1.5, alpha=0.7)

# Style
ax.set_xlabel("Mean Importance (Decrease in Accuracy)", fontsize=20, color=INK)
ax.set_ylabel("Feature", fontsize=20, color=INK)
ax.set_title("bar-permutation-importance · seaborn · anyplot.ai", fontsize=24, fontweight="medium", color=INK)
ax.tick_params(axis="both", labelsize=16, colors=INK_SOFT)

# Grid
ax.yaxis.grid(False)
ax.xaxis.grid(True, alpha=0.10, linewidth=0.8, linestyle="-")

# Remove top and right spines
ax.spines["top"].set_visible(False)
ax.spines["right"].set_visible(False)
ax.spines["left"].set_color(INK_SOFT)
ax.spines["bottom"].set_color(INK_SOFT)

plt.tight_layout()
plt.savefig(f"plot-{THEME}.png", dpi=300, bbox_inches="tight", facecolor=PAGE_BG)
Runnable source as JSON, for any HTTP client: https://api.anyplot.ai/specs/bar-permutation-importance/seaborn/code. Any spec id and library id listed in llms-full.txt fit the same URL shape; every URL below is complete and callable.
{
  "spec_id": "bar-permutation-importance",
  "language": "python",
  "library": "seaborn",
  "page": "https://anyplot.ai/bar-permutation-importance/python/seaborn",
  "hub": "https://anyplot.ai/bar-permutation-importance",
  "code_json": "https://api.anyplot.ai/specs/bar-permutation-importance/seaborn/code",
  "spec_json": "https://api.anyplot.ai/specs/bar-permutation-importance",
  "render_light_png": "https://storage.googleapis.com/anyplot-images/plots/bar-permutation-importance/python/seaborn/plot-light.png",
  "render_dark_png": "https://storage.googleapis.com/anyplot-images/plots/bar-permutation-importance/python/seaborn/plot-dark.png",
  "quality_score": 84.0,
  "license": "MIT",
  "guide": "https://anyplot.ai/llms.txt"
}
Part of Permutation Feature Importance Plot on anyplot.ai.