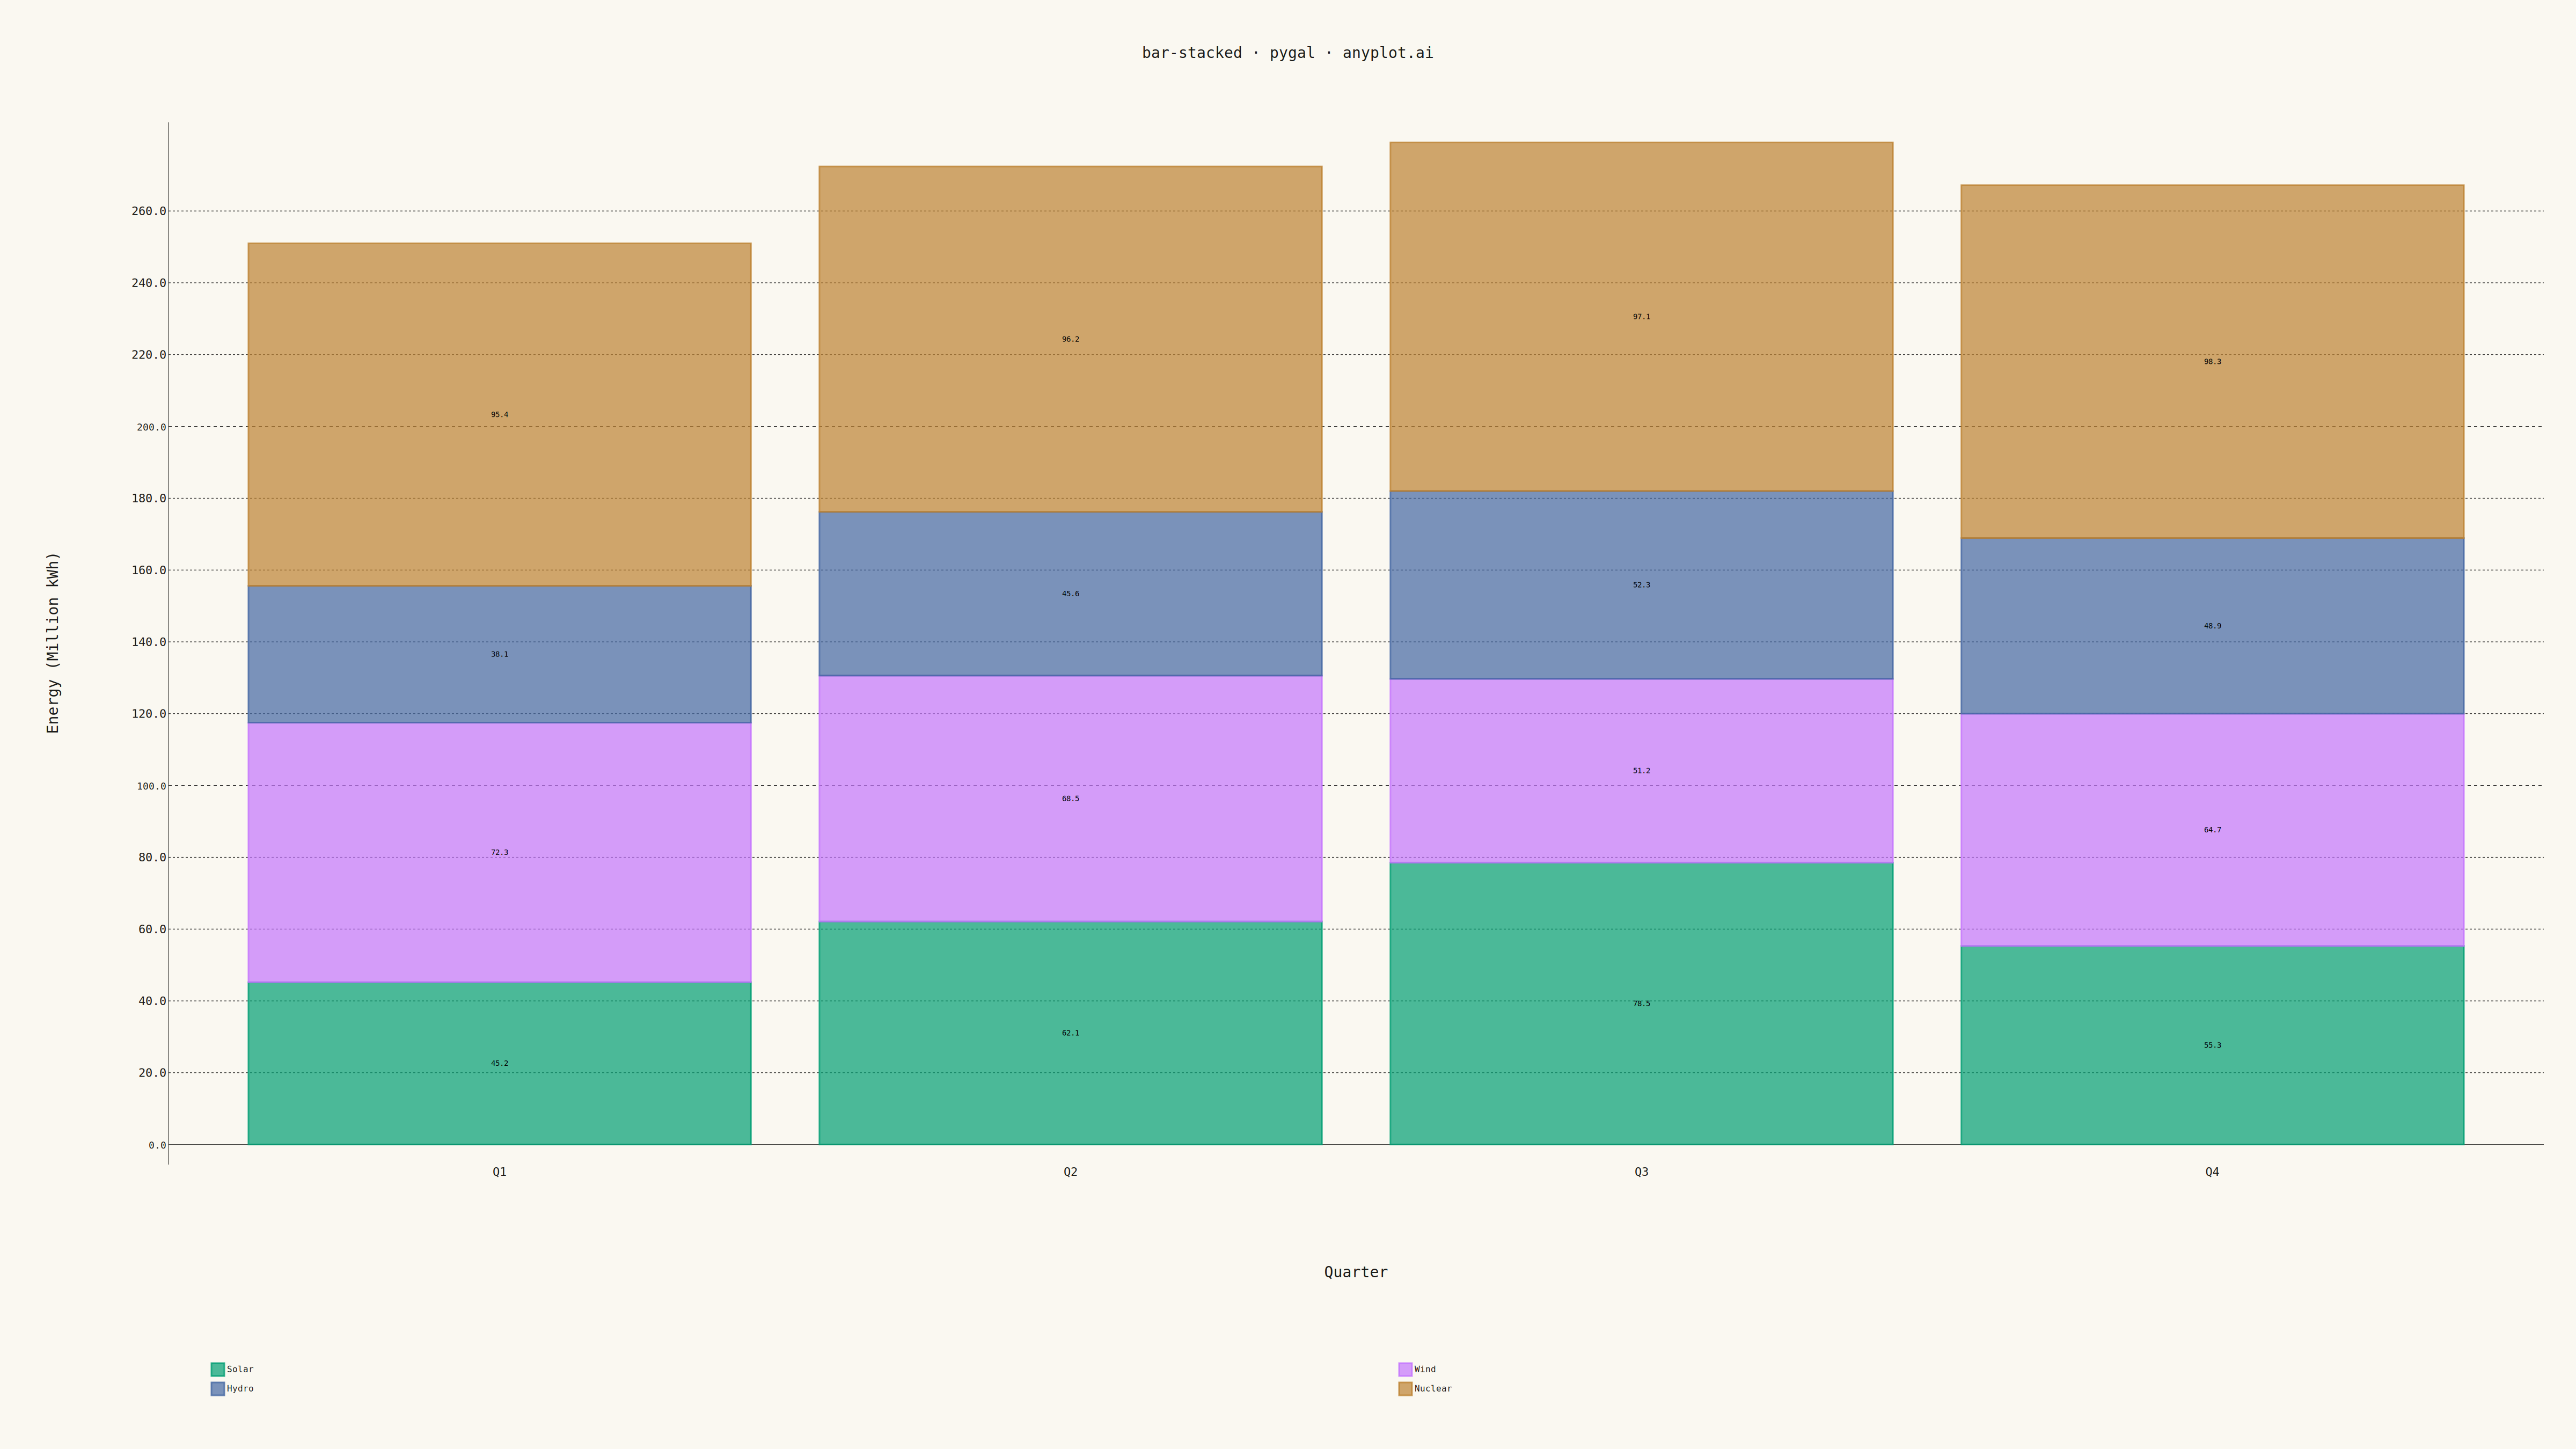
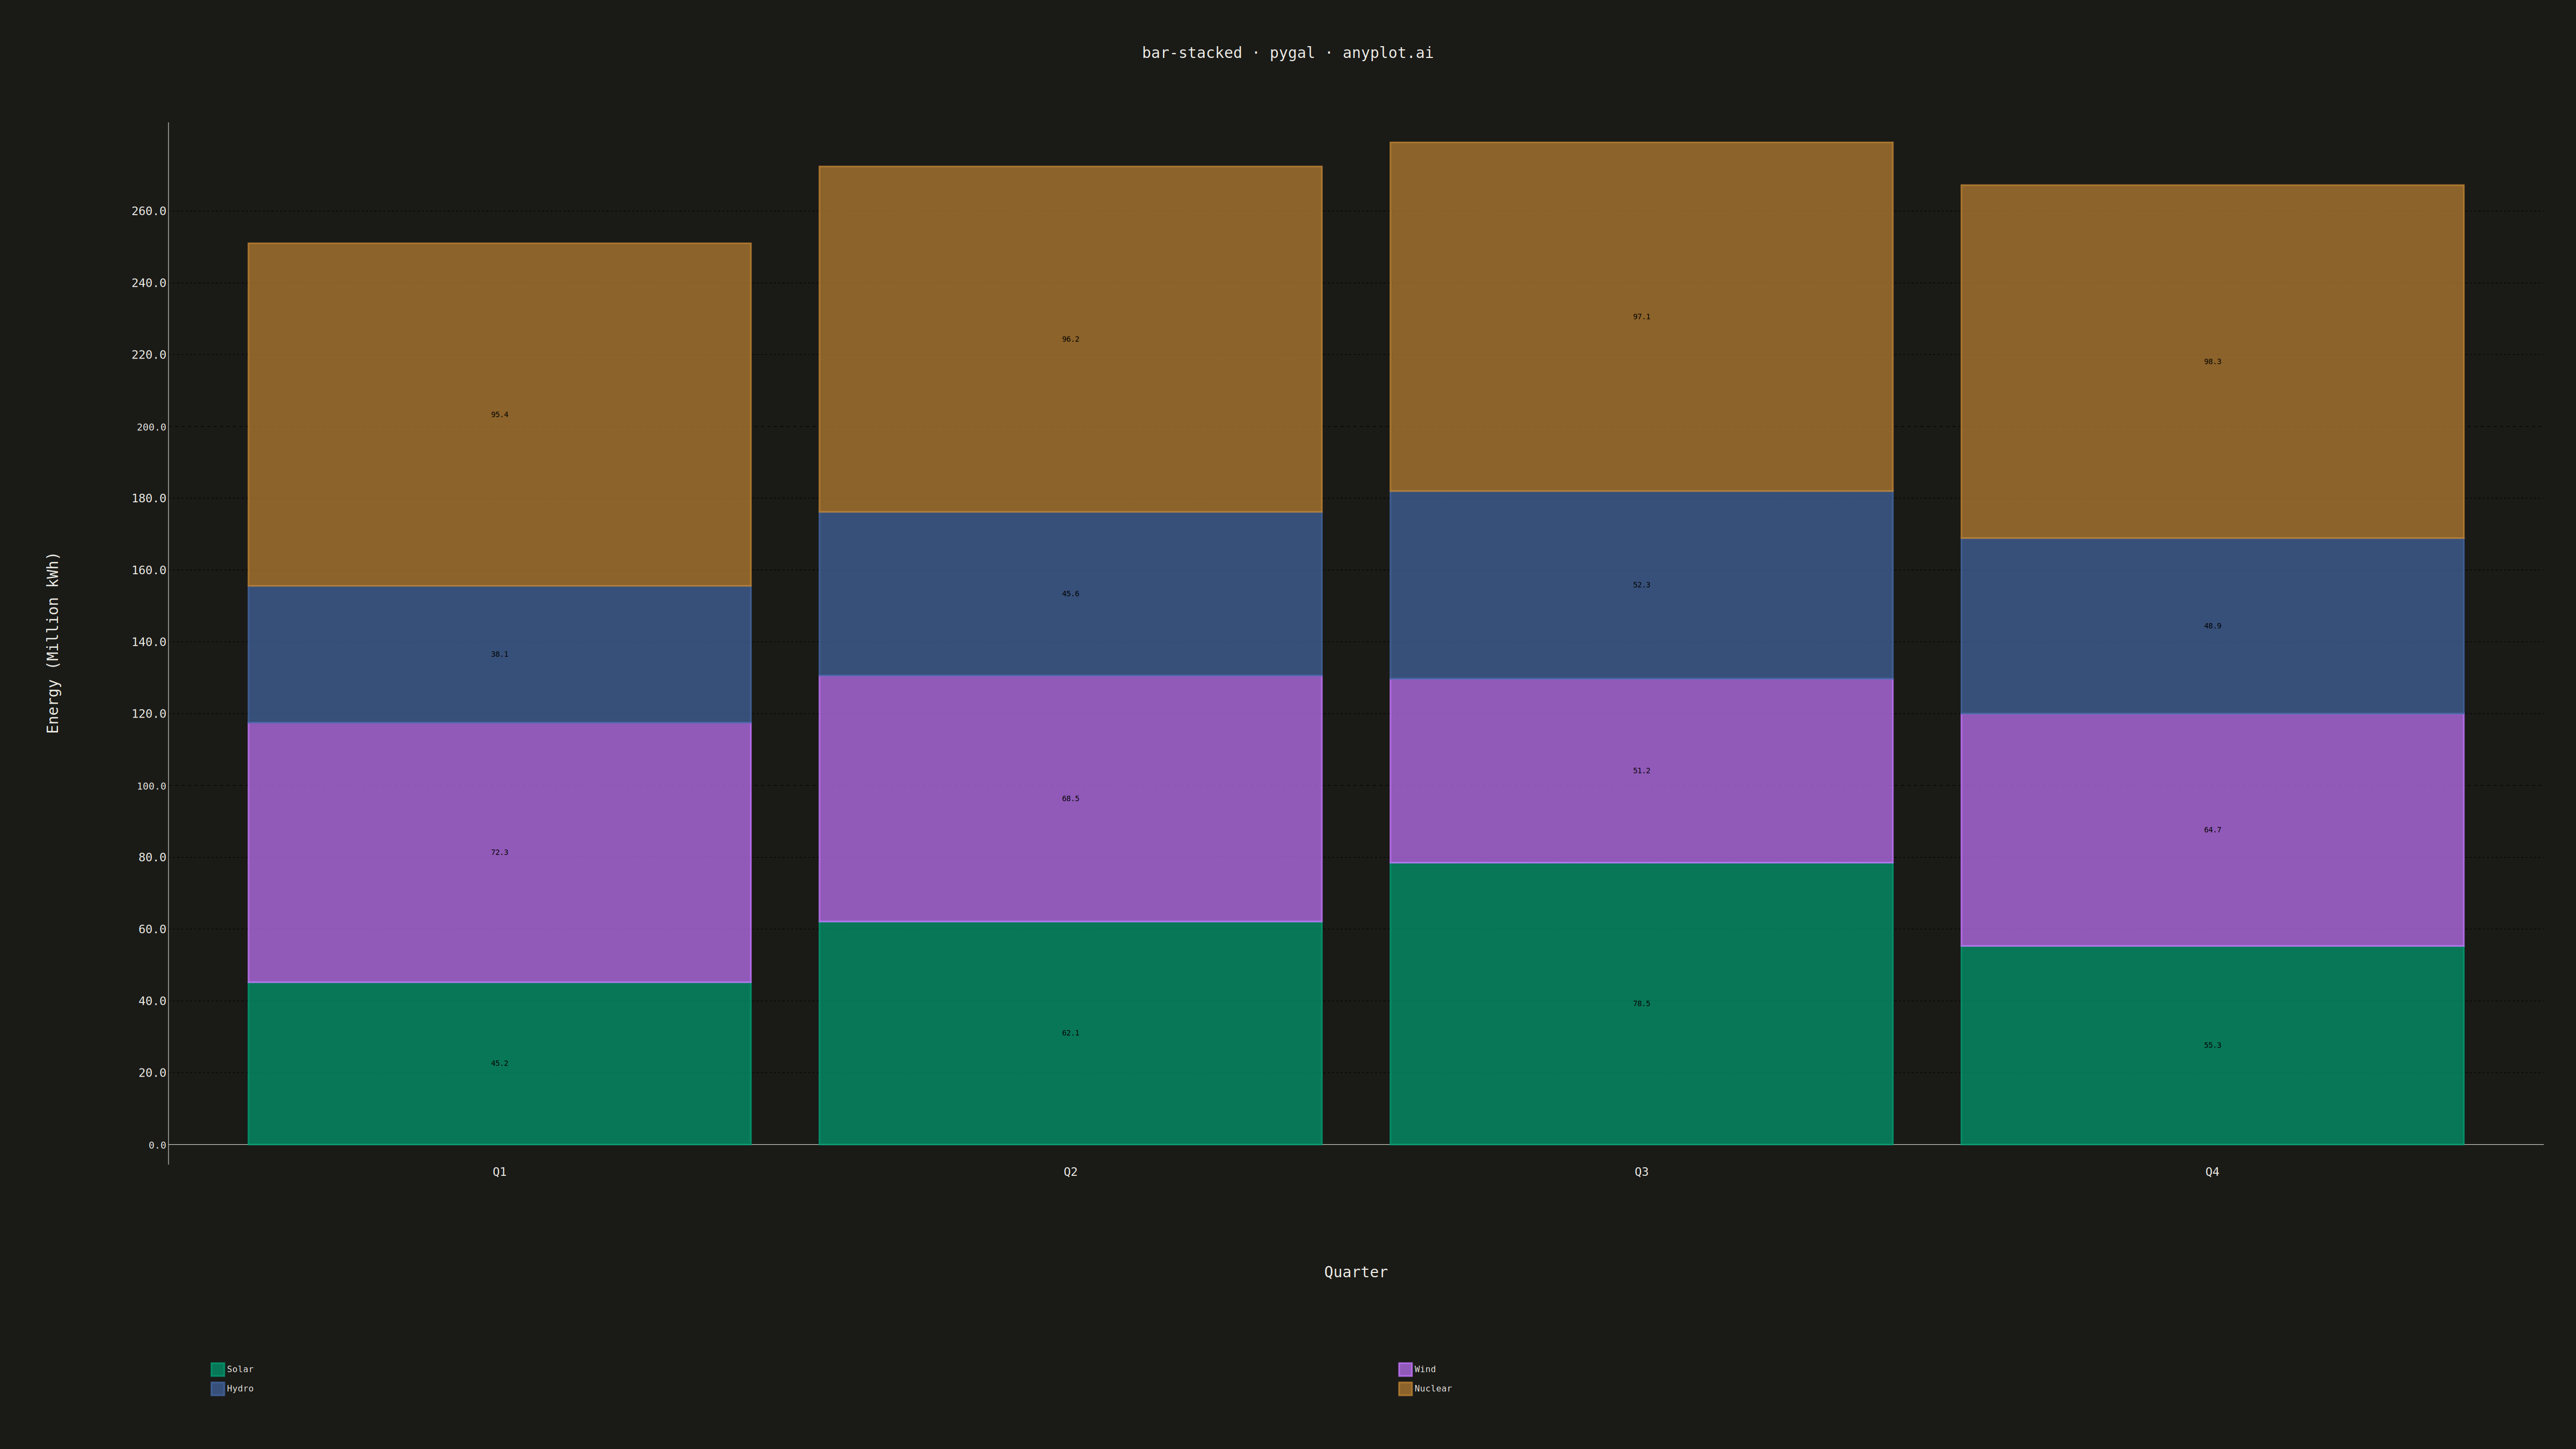
A stacked bar chart that displays multiple data series stacked on top of each other within each category, showing both individual component values and their cumulative totals. This visualization excels at revealing part-to-whole relationships while maintaining the ability to compare totals across categories. Stacked bar charts are particularly effective for composition analysis, where understanding how different components contribute to a whole is as important as comparing totals.
Preview render from the Pygal implementation.