The same plot in 14 other libraries — JavaScript: Chart.js, D3.js, Apache ECharts, Highcharts; Python: Altair, Bokeh, lets-plot, Matplotlib, Plotly, plotnine, Pygal, Seaborn; R: ggplot2; Julia: Makie.jl. Compare all 15 side by side: Stacked Bar Chart in Python, R, Julia and JavaScript.
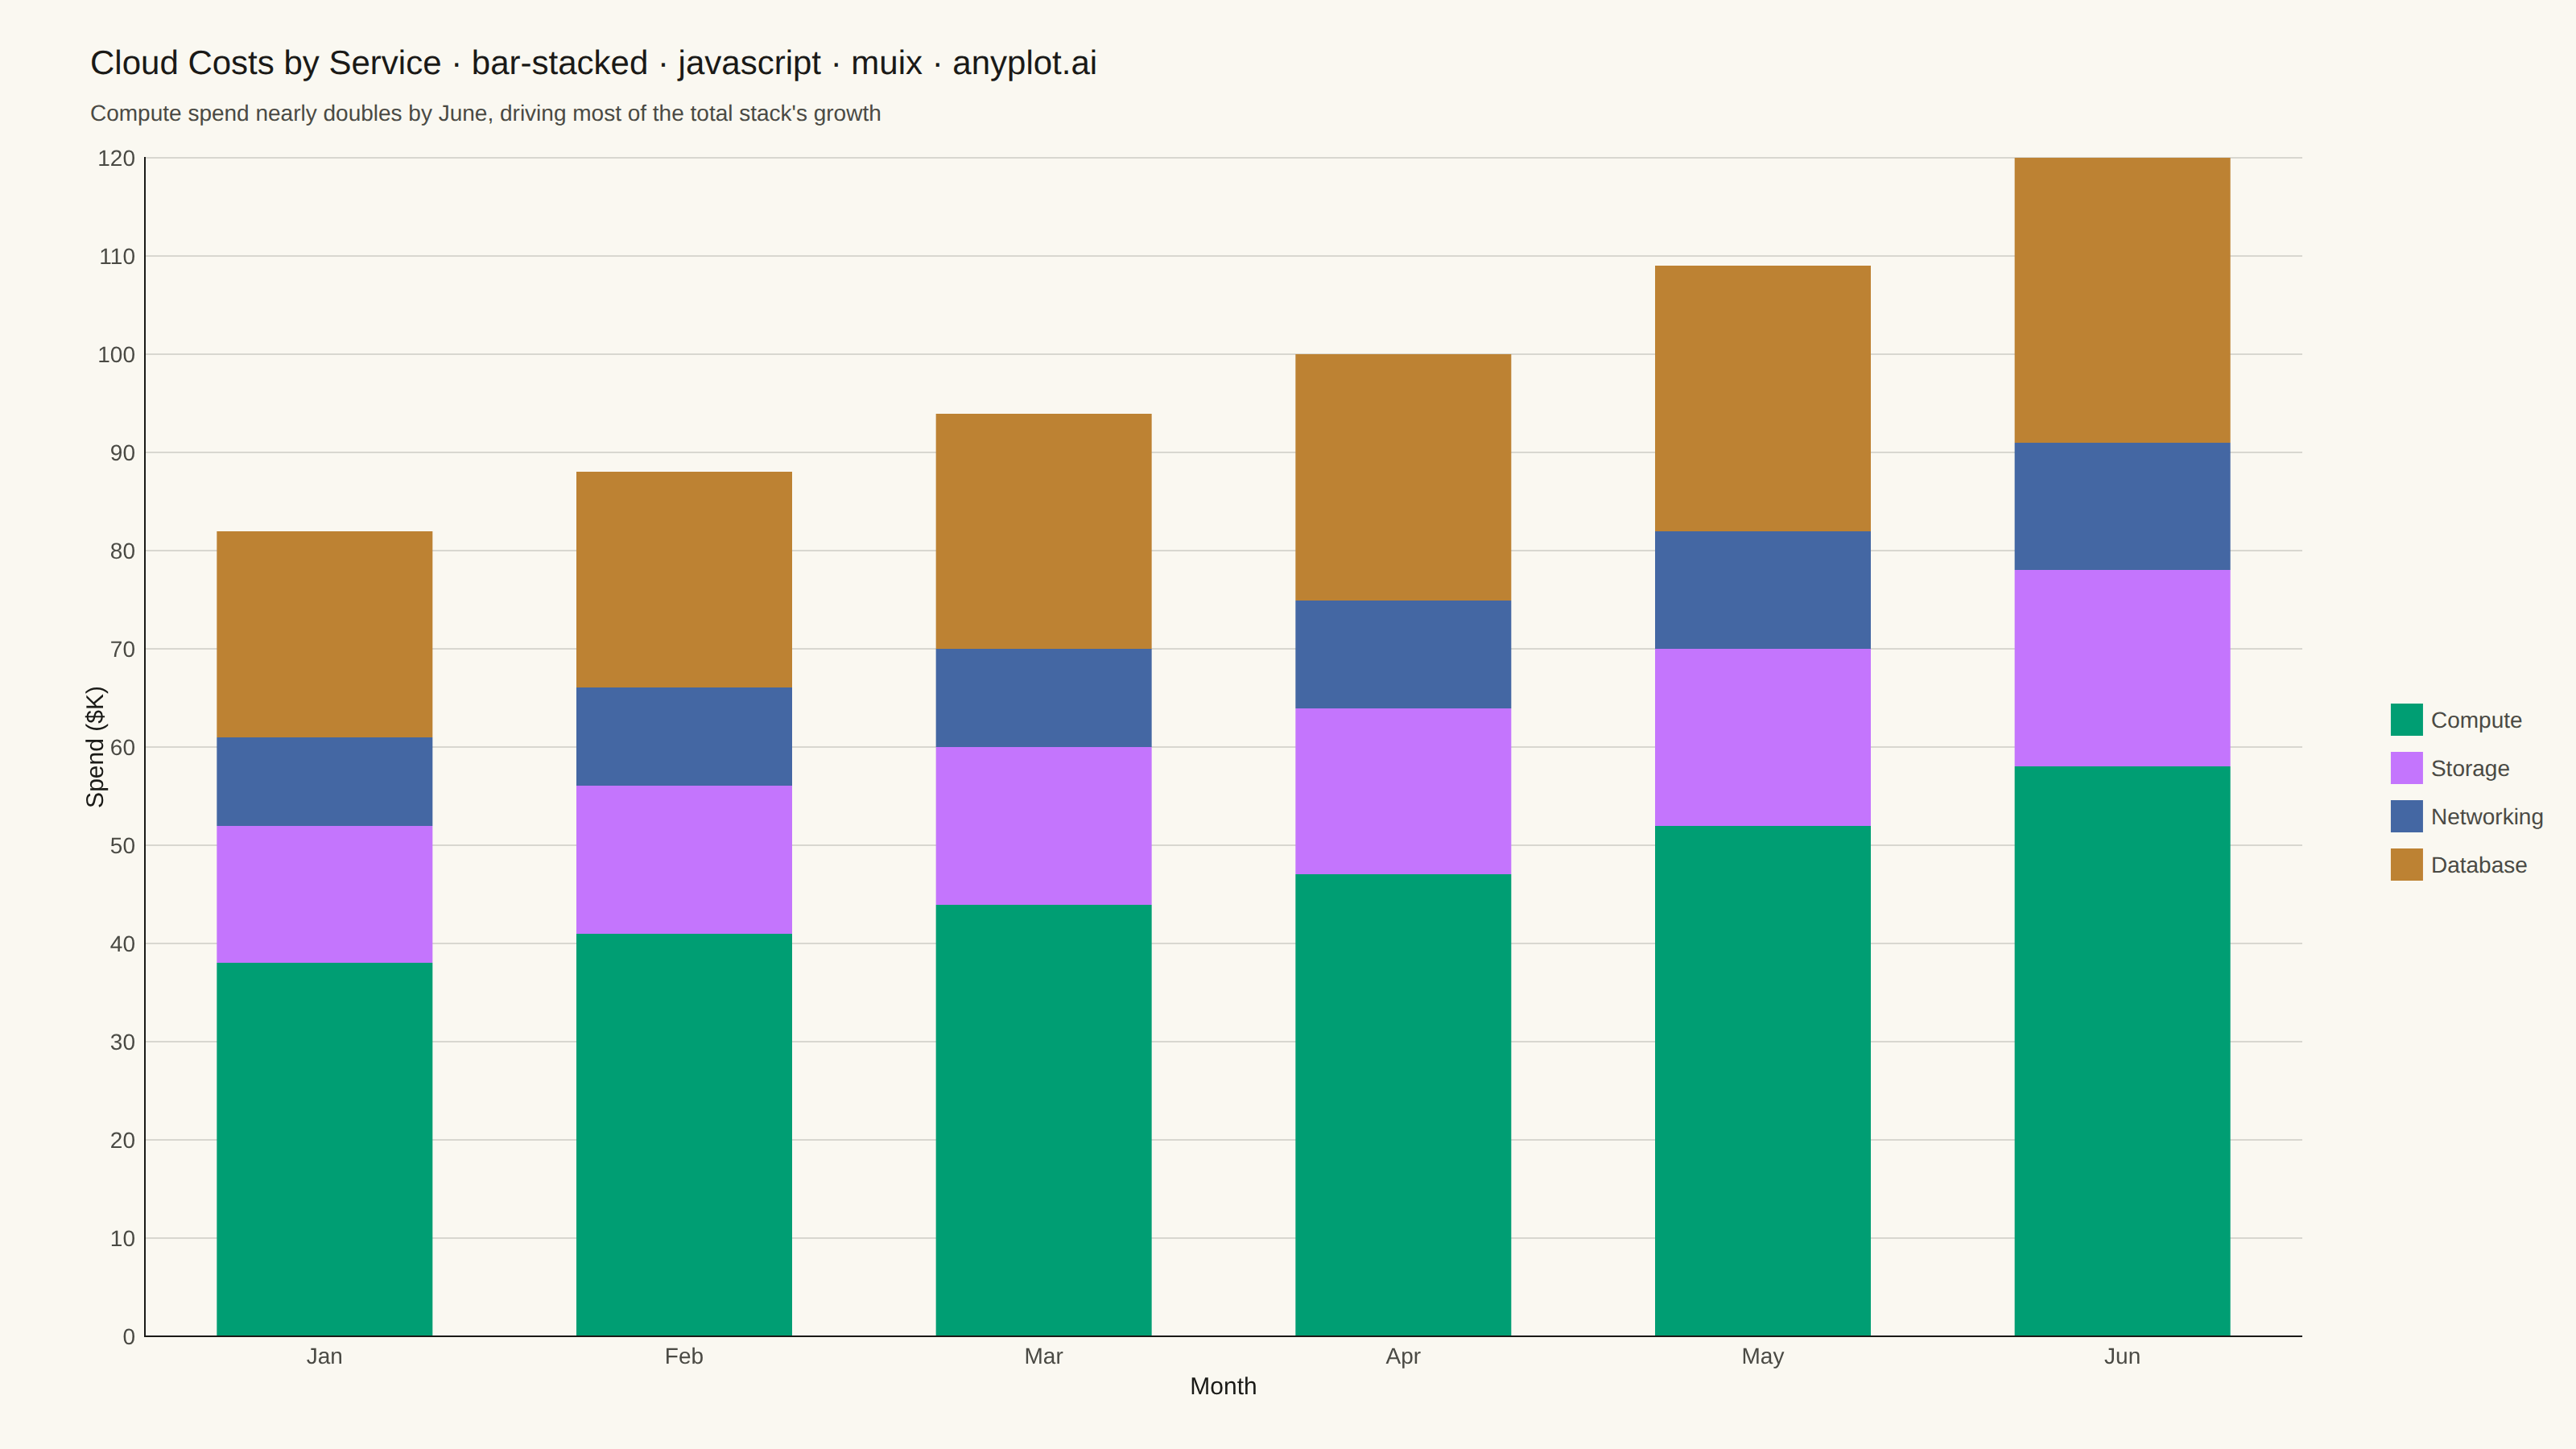
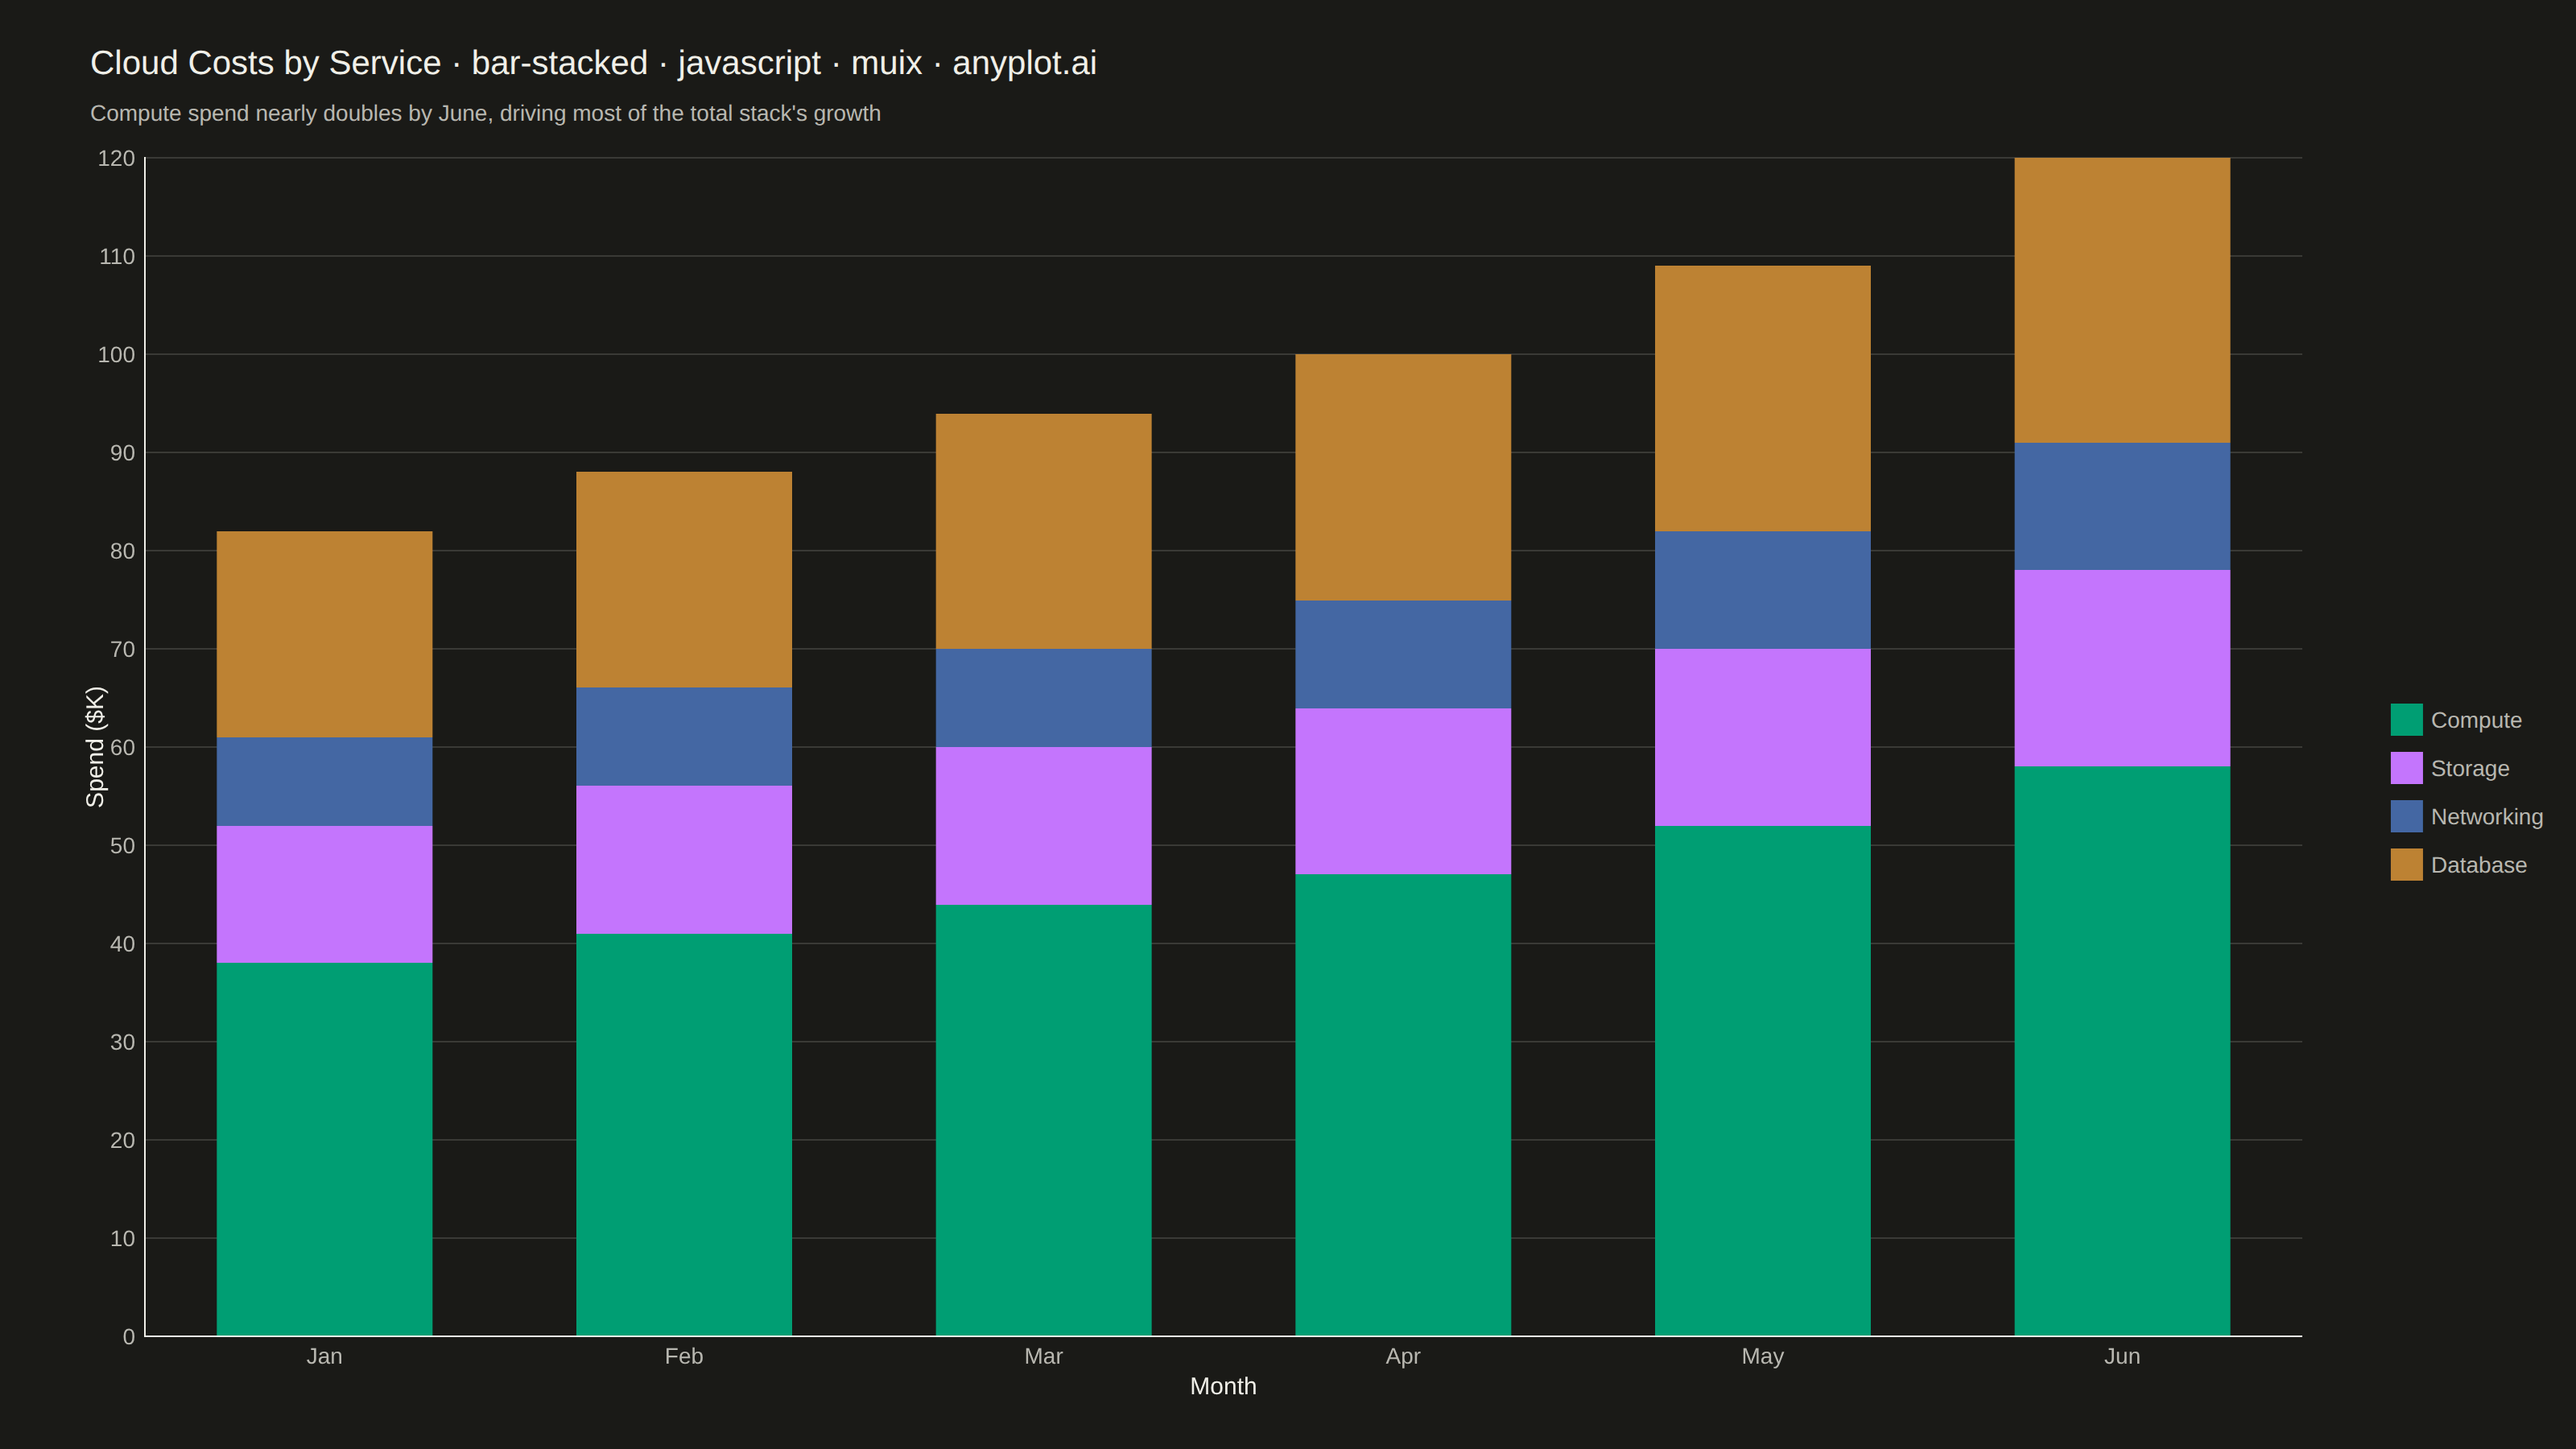
A stacked bar chart that displays multiple data series stacked on top of each other within each category, showing both individual component values and their cumulative totals. This visualization excels at revealing part-to-whole relationships while maintaining the ability to compare totals across categories. Stacked bar charts are particularly effective for composition analysis, where understanding how different components contribute to a whole is as important as comparing totals.
// anyplot.ai
// bar-stacked: Stacked Bar Chart
// Library: muix 7.29.1 | JavaScript 22.23.2
// Quality: 87/100 | Created: 2026-09-02
import { BarChart } from "@mui/x-charts/BarChart";
import { useXScale, useYScale } from "@mui/x-charts/hooks";
import Box from "@mui/material/Box";
import Typography from "@mui/material/Typography";

const t = window.ANYPLOT_TOKENS;

// --- Data (in-memory, deterministic) ----------------------------------------
// Monthly cloud infrastructure spend ($K), broken down by service. Compute
// grows fastest of the four, so its share of the stack widens month over
// month — a composition story a stacked view tells better than a line chart.
const months = ["Jan", "Feb", "Mar", "Apr", "May", "Jun"];
const spendByMonth = {
  Jan: { compute: 38, storage: 14, networking: 9, database: 21 },
  Feb: { compute: 41, storage: 15, networking: 10, database: 22 },
  Mar: { compute: 44, storage: 16, networking: 10, database: 24 },
  Apr: { compute: 47, storage: 17, networking: 11, database: 25 },
  May: { compute: 52, storage: 18, networking: 12, database: 27 },
  Jun: { compute: 58, storage: 20, networking: 13, database: 29 },
};

// Stack order fixed across every bar, largest/most-volatile service first so
// it lands on Imprint position 1 (brand green).
const components = [
  { id: "compute", label: "Compute" },
  { id: "storage", label: "Storage" },
  { id: "networking", label: "Networking" },
  { id: "database", label: "Database" },
];

const series = components.map((c) => ({
  id: c.id,
  label: c.label,
  stack: "total",
  data: months.map((m) => spendByMonth[m][c.id]),
  valueFormatter: (v) => `$${v}K`,
}));

// Stack totals, used for the total-value labels above each bar and to give
// the y-axis enough headroom that those labels never clip against the top.
const totals = months.map((m) => {
  const s = spendByMonth[m];
  return s.compute + s.storage + s.networking + s.database;
});
const yMax = Math.ceil((Math.max(...totals) * 1.15) / 10) * 10;

// Total labels above each stack (per the spec's "Notes" suggestion), placed
// via the chart's own scales so they track the bars exactly.
function TotalLabels() {
  const xScale = useXScale();
  const yScale = useYScale();
  return (
    <g>
      {months.map((m, i) => (
        <text
          key={m}
          x={xScale(m) + xScale.bandwidth() / 2}
          y={yScale(totals[i]) - 10}
          textAnchor="middle"
          fontSize={14}
          fontWeight={600}
          fill={t.ink}
        >
          {`$${totals[i]}K`}
        </text>
      ))}
    </g>
  );
}

export default function Chart() {
  const W = window.ANYPLOT_SIZE.width; // 1600 CSS px (landscape mount)
  const H = window.ANYPLOT_SIZE.height; // 900 CSS px
  const CHART_TOP = 84;

  return (
    <Box sx={{ position: "relative", width: W, height: H, bgcolor: t.pageBg }}>
      {/* Title + subtitle */}
      <Box sx={{ position: "absolute", top: 24, left: 56, right: 56 }}>
        <Typography sx={{ color: t.ink, fontSize: 21, fontWeight: 500 }}>
          Cloud Costs by Service · bar-stacked · javascript · muix · anyplot.ai
        </Typography>
        <Typography sx={{ color: t.inkSoft, fontSize: 14, mt: 0.5 }}>
          Compute spend nearly doubles by June, driving most of the total stack's growth
        </Typography>
      </Box>

      {/* Bar chart */}
      <Box sx={{ position: "absolute", top: CHART_TOP, left: 0, right: 0, bottom: 0 }}>
        <BarChart
          width={W}
          height={H - CHART_TOP}
          colors={t.palette}
          skipAnimation
          borderRadius={3}
          axisHighlight={{ x: "none", y: "none" }}
          tooltip={{ trigger: "none" }}
          xAxis={[
            {
              scaleType: "band",
              data: months,
              label: "Month",
              disableTicks: true,
              labelStyle: { fontSize: 15, fill: t.ink },
              tickLabelStyle: { fontSize: 14, fill: t.inkSoft },
              categoryGapRatio: 0.4,
            },
          ]}
          yAxis={[
            {
              label: "Spend ($K)",
              labelStyle: { fontSize: 15, fill: t.ink },
              tickLabelStyle: { fontSize: 14, fill: t.inkSoft },
              disableTicks: true,
              max: yMax,
            },
          ]}
          series={series}
          margin={{ top: 14, right: 170, bottom: 70, left: 90 }}
          grid={{ horizontal: true }}
          slotProps={{
            legend: {
              position: { vertical: "middle", horizontal: "right" },
              direction: "column",
              labelStyle: { fontSize: 14, fill: t.inkSoft },
            },
          }}
          sx={{
            "& .MuiChartsAxis-line": { stroke: t.grid },
            "& .MuiChartsGrid-line": { stroke: t.grid },
            "& .MuiBarElement-root": { stroke: t.pageBg, strokeWidth: 1 },
          }}
        >
          <TotalLabels />
        </BarChart>
      </Box>
    </Box>
  );
}
Runnable source as JSON, for any HTTP client: https://api.anyplot.ai/specs/bar-stacked/muix/code. Any spec id and library id listed in llms-full.txt fit the same URL shape; every URL below is complete and callable.
{
  "spec_id": "bar-stacked",
  "language": "javascript",
  "library": "muix",
  "page": "https://anyplot.ai/bar-stacked/javascript/muix",
  "hub": "https://anyplot.ai/bar-stacked",
  "code_json": "https://api.anyplot.ai/specs/bar-stacked/muix/code",
  "spec_json": "https://api.anyplot.ai/specs/bar-stacked",
  "render_light_png": "https://storage.googleapis.com/anyplot-images/plots/bar-stacked/javascript/muix/plot-light.png",
  "render_dark_png": "https://storage.googleapis.com/anyplot-images/plots/bar-stacked/javascript/muix/plot-dark.png",
  "interactive_light_html": "https://storage.googleapis.com/anyplot-images/plots/bar-stacked/javascript/muix/plot-light.html",
  "interactive_dark_html": "https://storage.googleapis.com/anyplot-images/plots/bar-stacked/javascript/muix/plot-dark.html",
  "quality_score": 87.0,
  "license": "MIT",
  "guide": "https://anyplot.ai/llms.txt"
}
Part of Stacked Bar Chart on anyplot.ai.