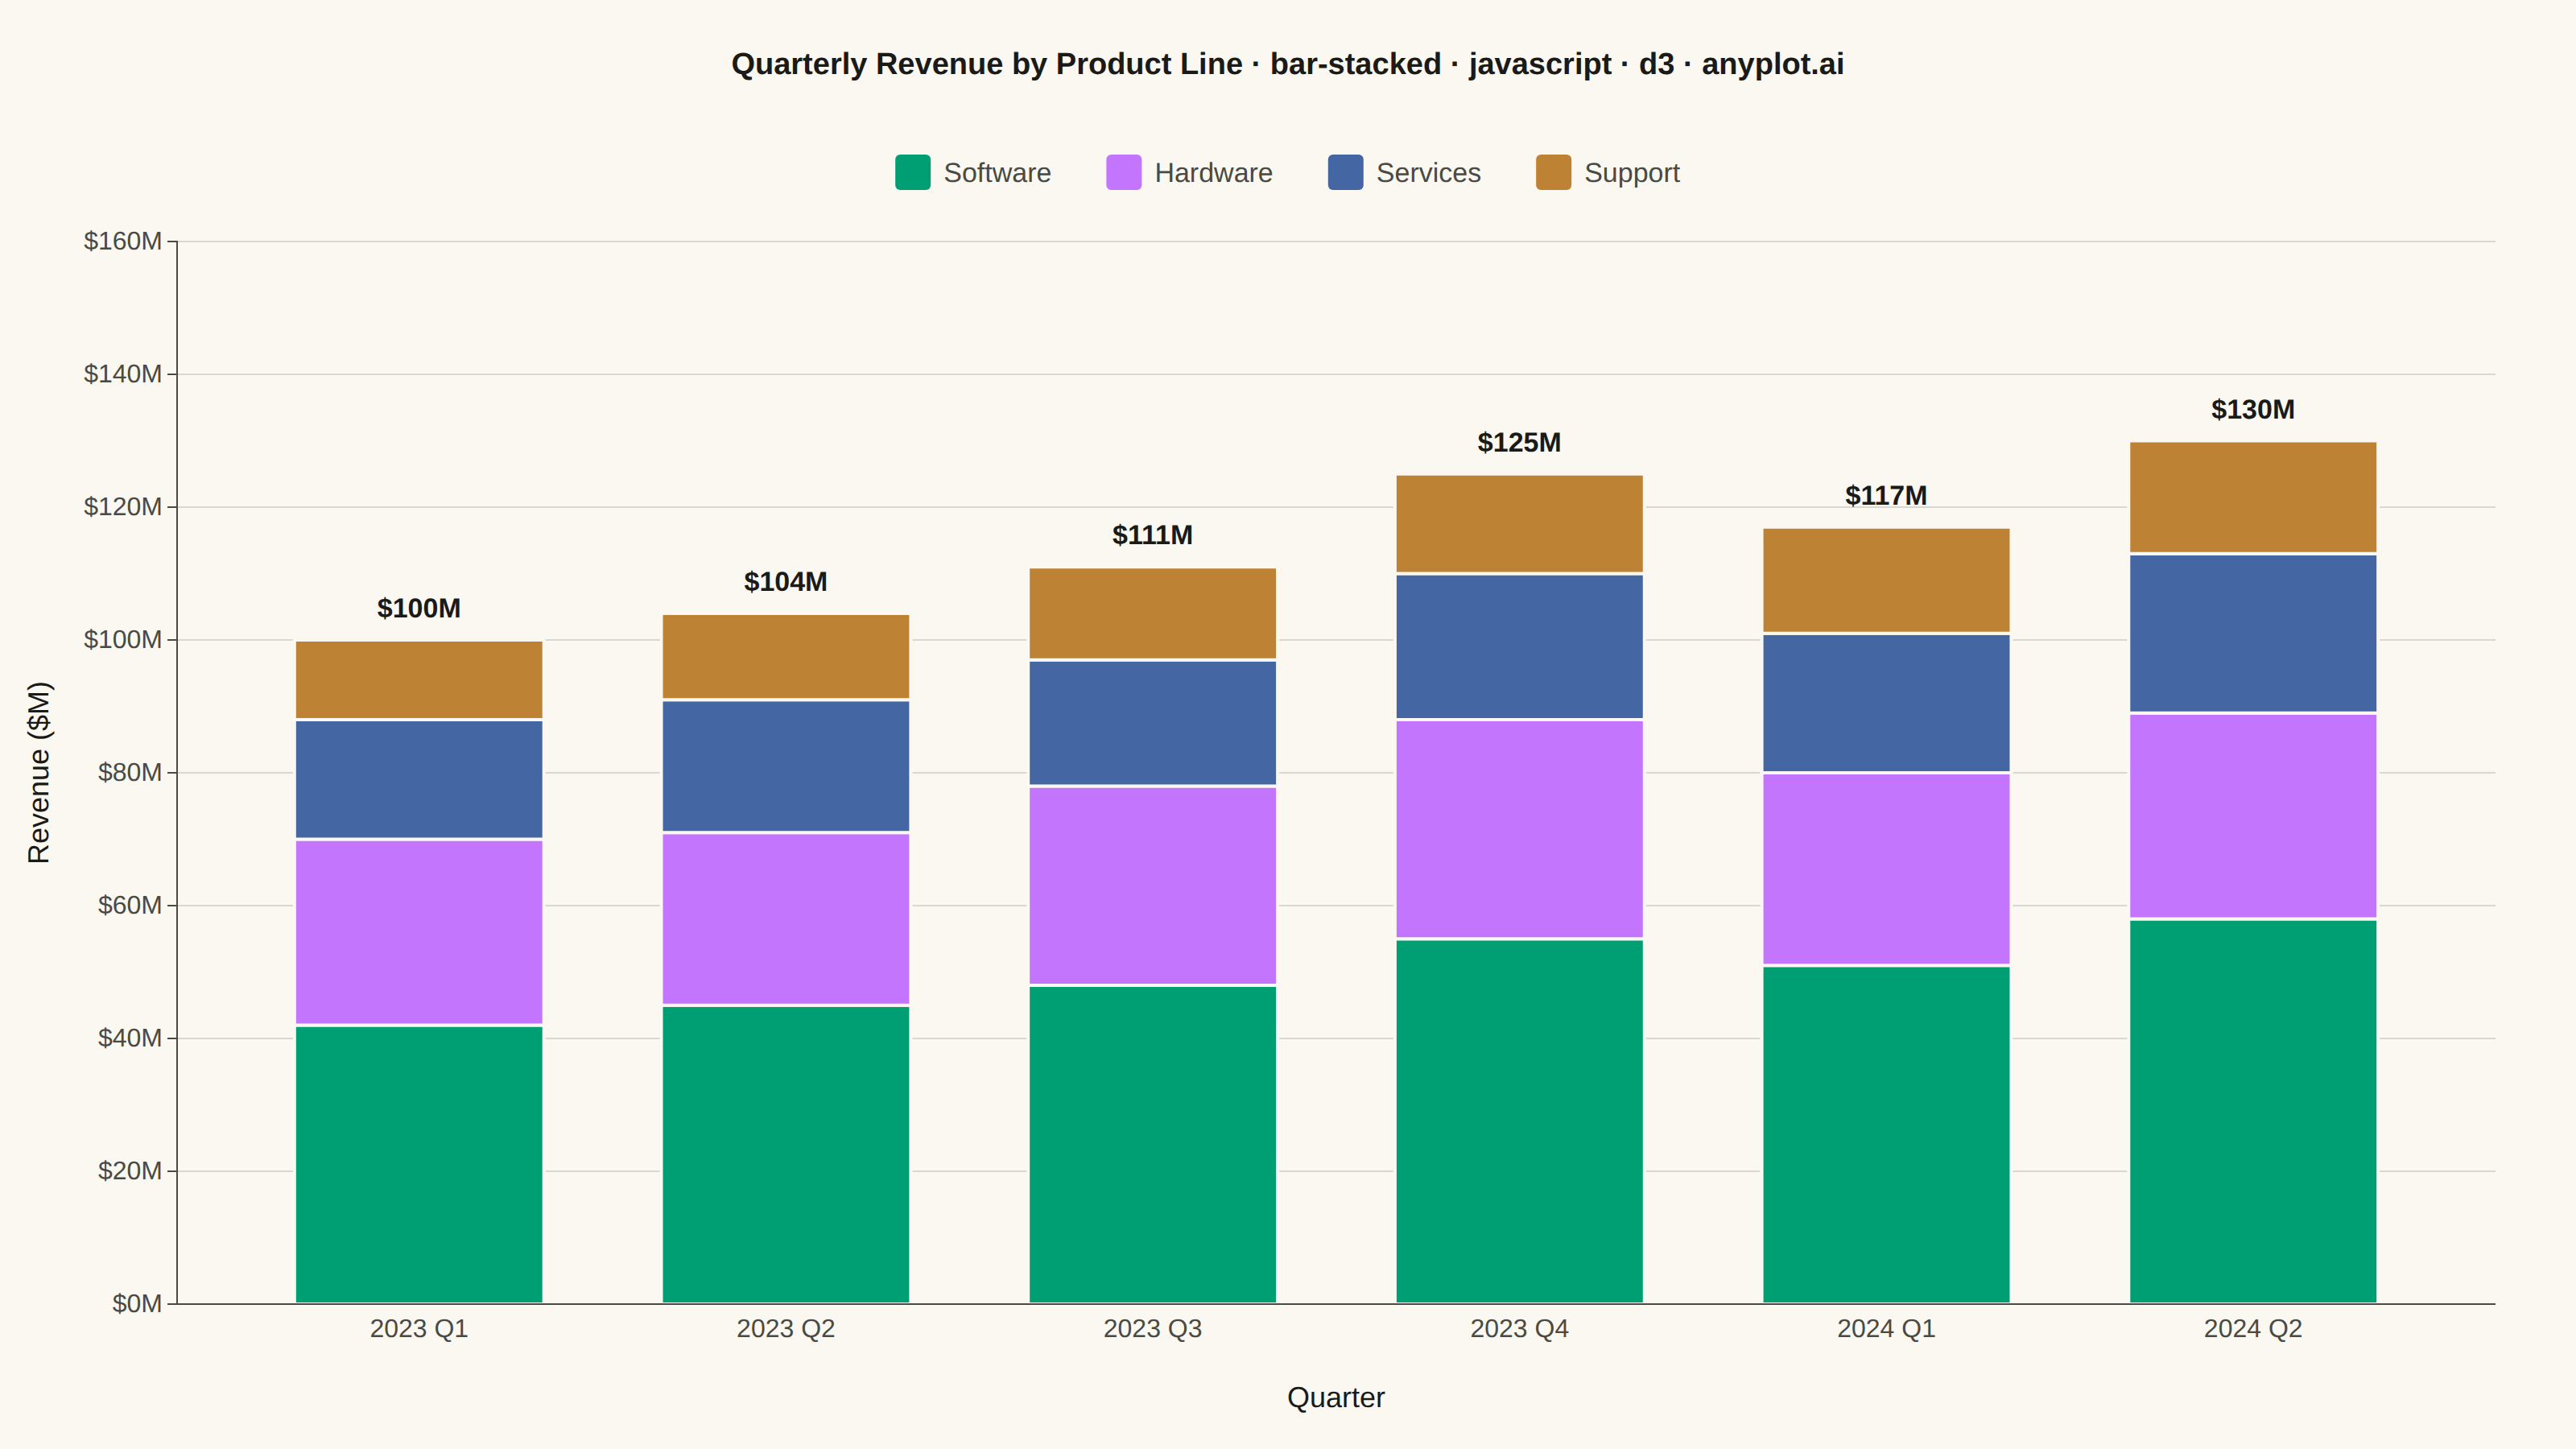
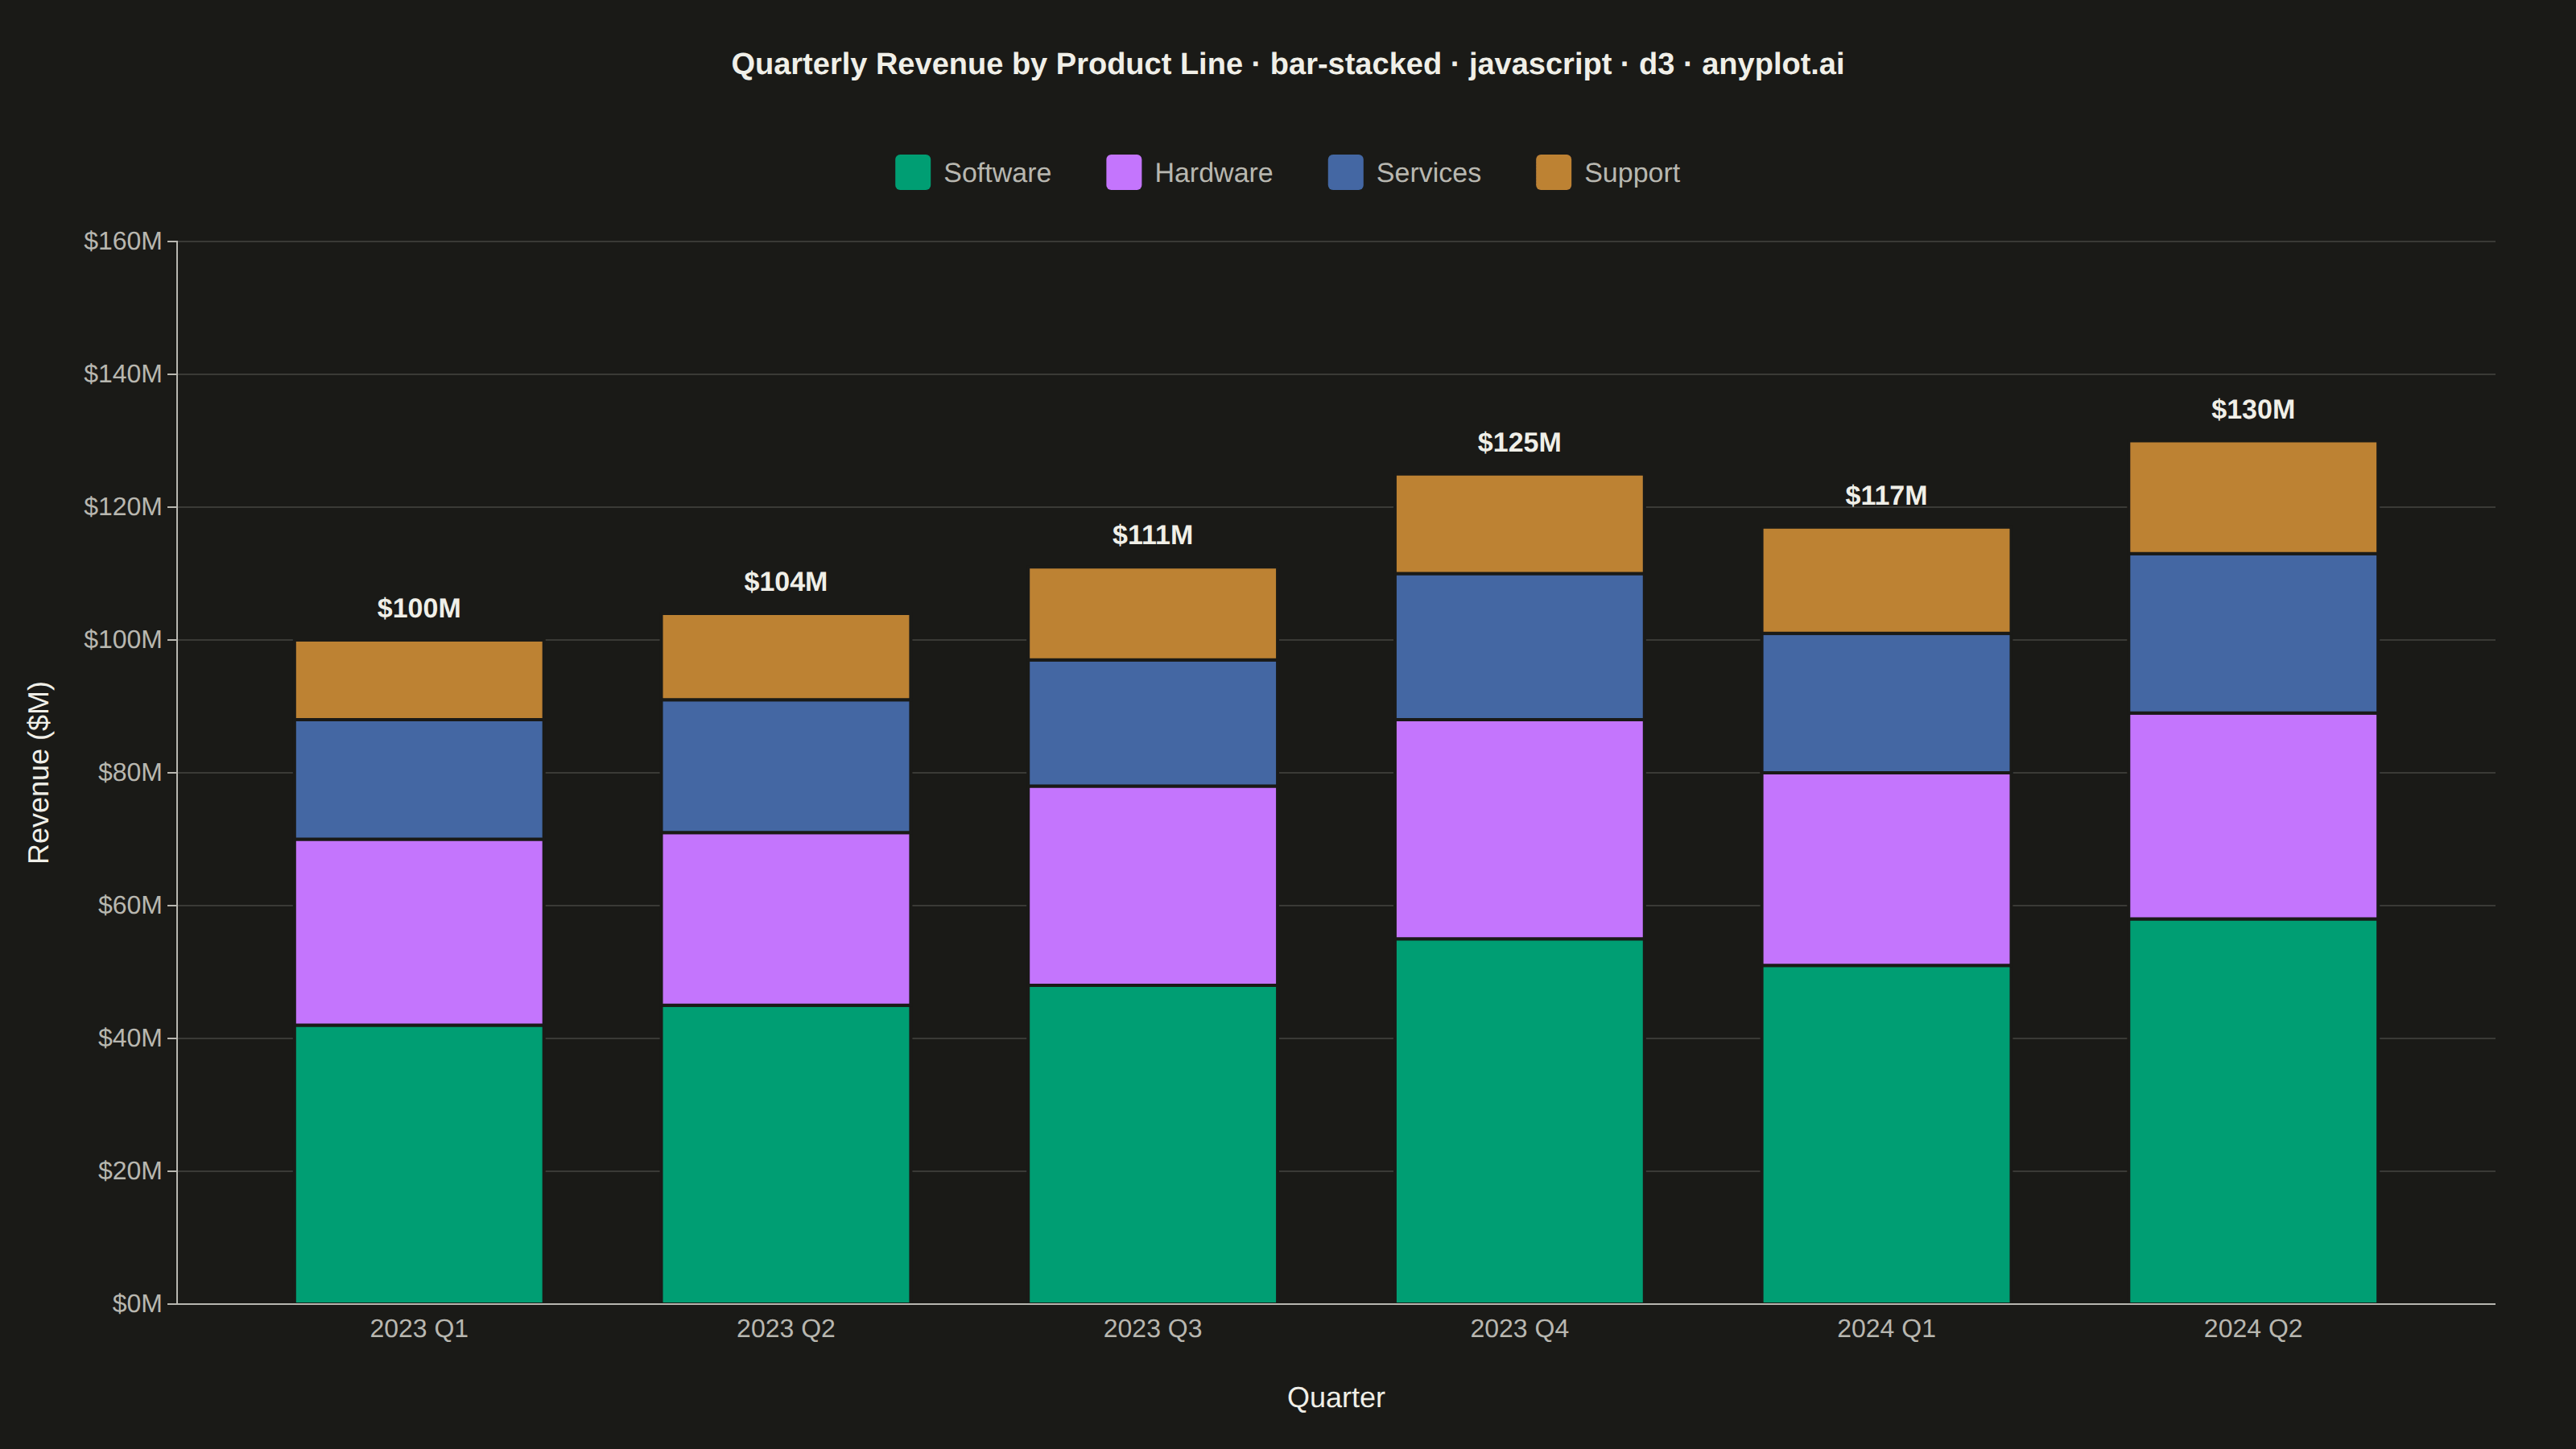
The same plot in 14 other libraries — JavaScript: Chart.js, Apache ECharts, Highcharts, MUI X Charts; Python: Altair, Bokeh, lets-plot, Matplotlib, Plotly, plotnine, Pygal, Seaborn; R: ggplot2; Julia: Makie.jl. Compare all 15 side by side: Stacked Bar Chart in Python, R, Julia and JavaScript.
A stacked bar chart that displays multiple data series stacked on top of each other within each category, showing both individual component values and their cumulative totals. This visualization excels at revealing part-to-whole relationships while maintaining the ability to compare totals across categories. Stacked bar charts are particularly effective for composition analysis, where understanding how different components contribute to a whole is as important as comparing totals.
// anyplot.ai
// bar-stacked: Stacked Bar Chart
// Library: d3 7.9.0 | JavaScript 22.23.2
// Quality: 91/100 | Created: 2026-09-02

const t = window.ANYPLOT_TOKENS;
const { width, height } = window.ANYPLOT_SIZE;
const margin = { top: 150, right: 50, bottom: 90, left: 110 };
const iw = width - margin.left - margin.right;
const ih = height - margin.top - margin.bottom;

// --- Data (in-memory, deterministic) ----------------------------------------
// Quarterly software-company revenue ($M) by product line, stacked largest-first.
const components = ["Software", "Hardware", "Services", "Support"];
const data = [
  { category: "2023 Q1", Software: 42, Hardware: 28, Services: 18, Support: 12 },
  { category: "2023 Q2", Software: 45, Hardware: 26, Services: 20, Support: 13 },
  { category: "2023 Q3", Software: 48, Hardware: 30, Services: 19, Support: 14 },
  { category: "2023 Q4", Software: 55, Hardware: 33, Services: 22, Support: 15 },
  { category: "2024 Q1", Software: 51, Hardware: 29, Services: 21, Support: 16 },
  { category: "2024 Q2", Software: 58, Hardware: 31, Services: 24, Support: 17 },
];
const totals = data.map((d) => components.reduce((sum, k) => sum + d[k], 0));
const stackedSeries = d3.stack().keys(components)(data);

// --- Scales -------------------------------------------------------------------
const x = d3.scaleBand().domain(data.map((d) => d.category)).range([0, iw]).padding(0.32);
const y = d3.scaleLinear().domain([0, d3.max(totals) * 1.12]).nice().range([ih, 0]);
const color = d3.scaleOrdinal().domain(components).range(t.palette);

// --- SVG mount ------------------------------------------------------------
const svg = d3.select("#container").append("svg").attr("width", width).attr("height", height);
const g = svg.append("g").attr("transform", `translate(${margin.left},${margin.top})`);

// --- Y gridlines (behind bars) -----------------------------------------------
g.append("g")
  .attr("class", "grid")
  .call(d3.axisLeft(y).ticks(6).tickSize(-iw).tickFormat(""))
  .call((sel) => sel.select(".domain").remove())
  .call((sel) => sel.selectAll("line").attr("stroke", t.grid));

// --- Stacked bars ---------------------------------------------------------
g.selectAll("g.series")
  .data(stackedSeries)
  .join("g")
  .attr("class", "series")
  .attr("fill", (d) => color(d.key))
  .selectAll("rect")
  .data((d) => d)
  .join("rect")
  .attr("x", (d) => x(d.data.category))
  .attr("y", (d) => y(d[1]))
  .attr("width", x.bandwidth())
  .attr("height", (d) => y(d[0]) - y(d[1]))
  .attr("stroke", t.pageBg)
  .attr("stroke-width", 2);

// --- Total labels above each stack -----------------------------------------
g.selectAll("text.total")
  .data(data)
  .join("text")
  .attr("class", "total")
  .attr("x", (d) => x(d.category) + x.bandwidth() / 2)
  .attr("y", (d, i) => y(totals[i]) - 14)
  .attr("text-anchor", "middle")
  .attr("fill", t.ink)
  .style("font-size", "17px")
  .style("font-weight", "600")
  .text((d, i) => `$${totals[i]}M`);

// --- Axes -----------------------------------------------------------------
const xAxis = g.append("g").attr("transform", `translate(0,${ih})`).call(d3.axisBottom(x).tickSizeOuter(0));
const yAxis = g.append("g").call(d3.axisLeft(y).ticks(6).tickFormat((d) => `$${d}M`));
for (const ax of [xAxis, yAxis]) {
  ax.selectAll("text").attr("fill", t.inkSoft).style("font-size", "16px");
  ax.selectAll("line").attr("stroke", t.inkSoft);
  ax.select(".domain").attr("stroke", t.inkSoft);
}
xAxis.selectAll("line").remove();

// --- Axis titles ------------------------------------------------------------
g.append("text")
  .attr("x", iw / 2)
  .attr("y", ih + 64)
  .attr("text-anchor", "middle")
  .attr("fill", t.ink)
  .style("font-size", "18px")
  .text("Quarter");

g.append("text")
  .attr("transform", "rotate(-90)")
  .attr("x", -ih / 2)
  .attr("y", -80)
  .attr("text-anchor", "middle")
  .attr("fill", t.ink)
  .style("font-size", "18px")
  .text("Revenue ($M)");

// --- Legend (measured + centered, horizontal) --------------------------------
const legend = svg.append("g");
const legendItems = components.map((name) => {
  const item = legend.append("g");
  item.append("rect").attr("width", 22).attr("height", 22).attr("rx", 3).attr("fill", color(name));
  item.append("text").attr("x", 30).attr("y", 17).attr("fill", t.inkSoft).style("font-size", "17px").text(name);
  return item;
});
const gap = 34;
const itemWidths = legendItems.map((item) => item.node().getBBox().width);
const legendTotalWidth = itemWidths.reduce((a, b) => a + b, 0) + gap * (itemWidths.length - 1);
let legendX = (width - legendTotalWidth) / 2;
legendItems.forEach((item, i) => {
  item.attr("transform", `translate(${legendX},96)`);
  legendX += itemWidths[i] + gap;
});

// --- Title --------------------------------------------------------------
const titleText = "Quarterly Revenue by Product Line · bar-stacked · javascript · d3 · anyplot.ai";
const titleFontSize = Math.max(16, Math.round(22 * Math.min(1, 67 / titleText.length)));
svg
  .append("text")
  .attr("x", width / 2)
  .attr("y", 46)
  .attr("text-anchor", "middle")
  .attr("fill", t.ink)
  .style("font-size", `${titleFontSize}px`)
  .style("font-weight", "600")
  .text(titleText);
Runnable source as JSON, for any HTTP client: https://api.anyplot.ai/specs/bar-stacked/d3/code. Any spec id and library id listed in llms-full.txt fit the same URL shape; every URL below is complete and callable.
{
  "spec_id": "bar-stacked",
  "language": "javascript",
  "library": "d3",
  "page": "https://anyplot.ai/bar-stacked/javascript/d3",
  "hub": "https://anyplot.ai/bar-stacked",
  "code_json": "https://api.anyplot.ai/specs/bar-stacked/d3/code",
  "spec_json": "https://api.anyplot.ai/specs/bar-stacked",
  "render_light_png": "https://storage.googleapis.com/anyplot-images/plots/bar-stacked/javascript/d3/plot-light.png",
  "render_dark_png": "https://storage.googleapis.com/anyplot-images/plots/bar-stacked/javascript/d3/plot-dark.png",
  "interactive_light_html": "https://storage.googleapis.com/anyplot-images/plots/bar-stacked/javascript/d3/plot-light.html",
  "interactive_dark_html": "https://storage.googleapis.com/anyplot-images/plots/bar-stacked/javascript/d3/plot-dark.html",
  "quality_score": 91.0,
  "license": "MIT",
  "guide": "https://anyplot.ai/llms.txt"
}
Part of Stacked Bar Chart on anyplot.ai.