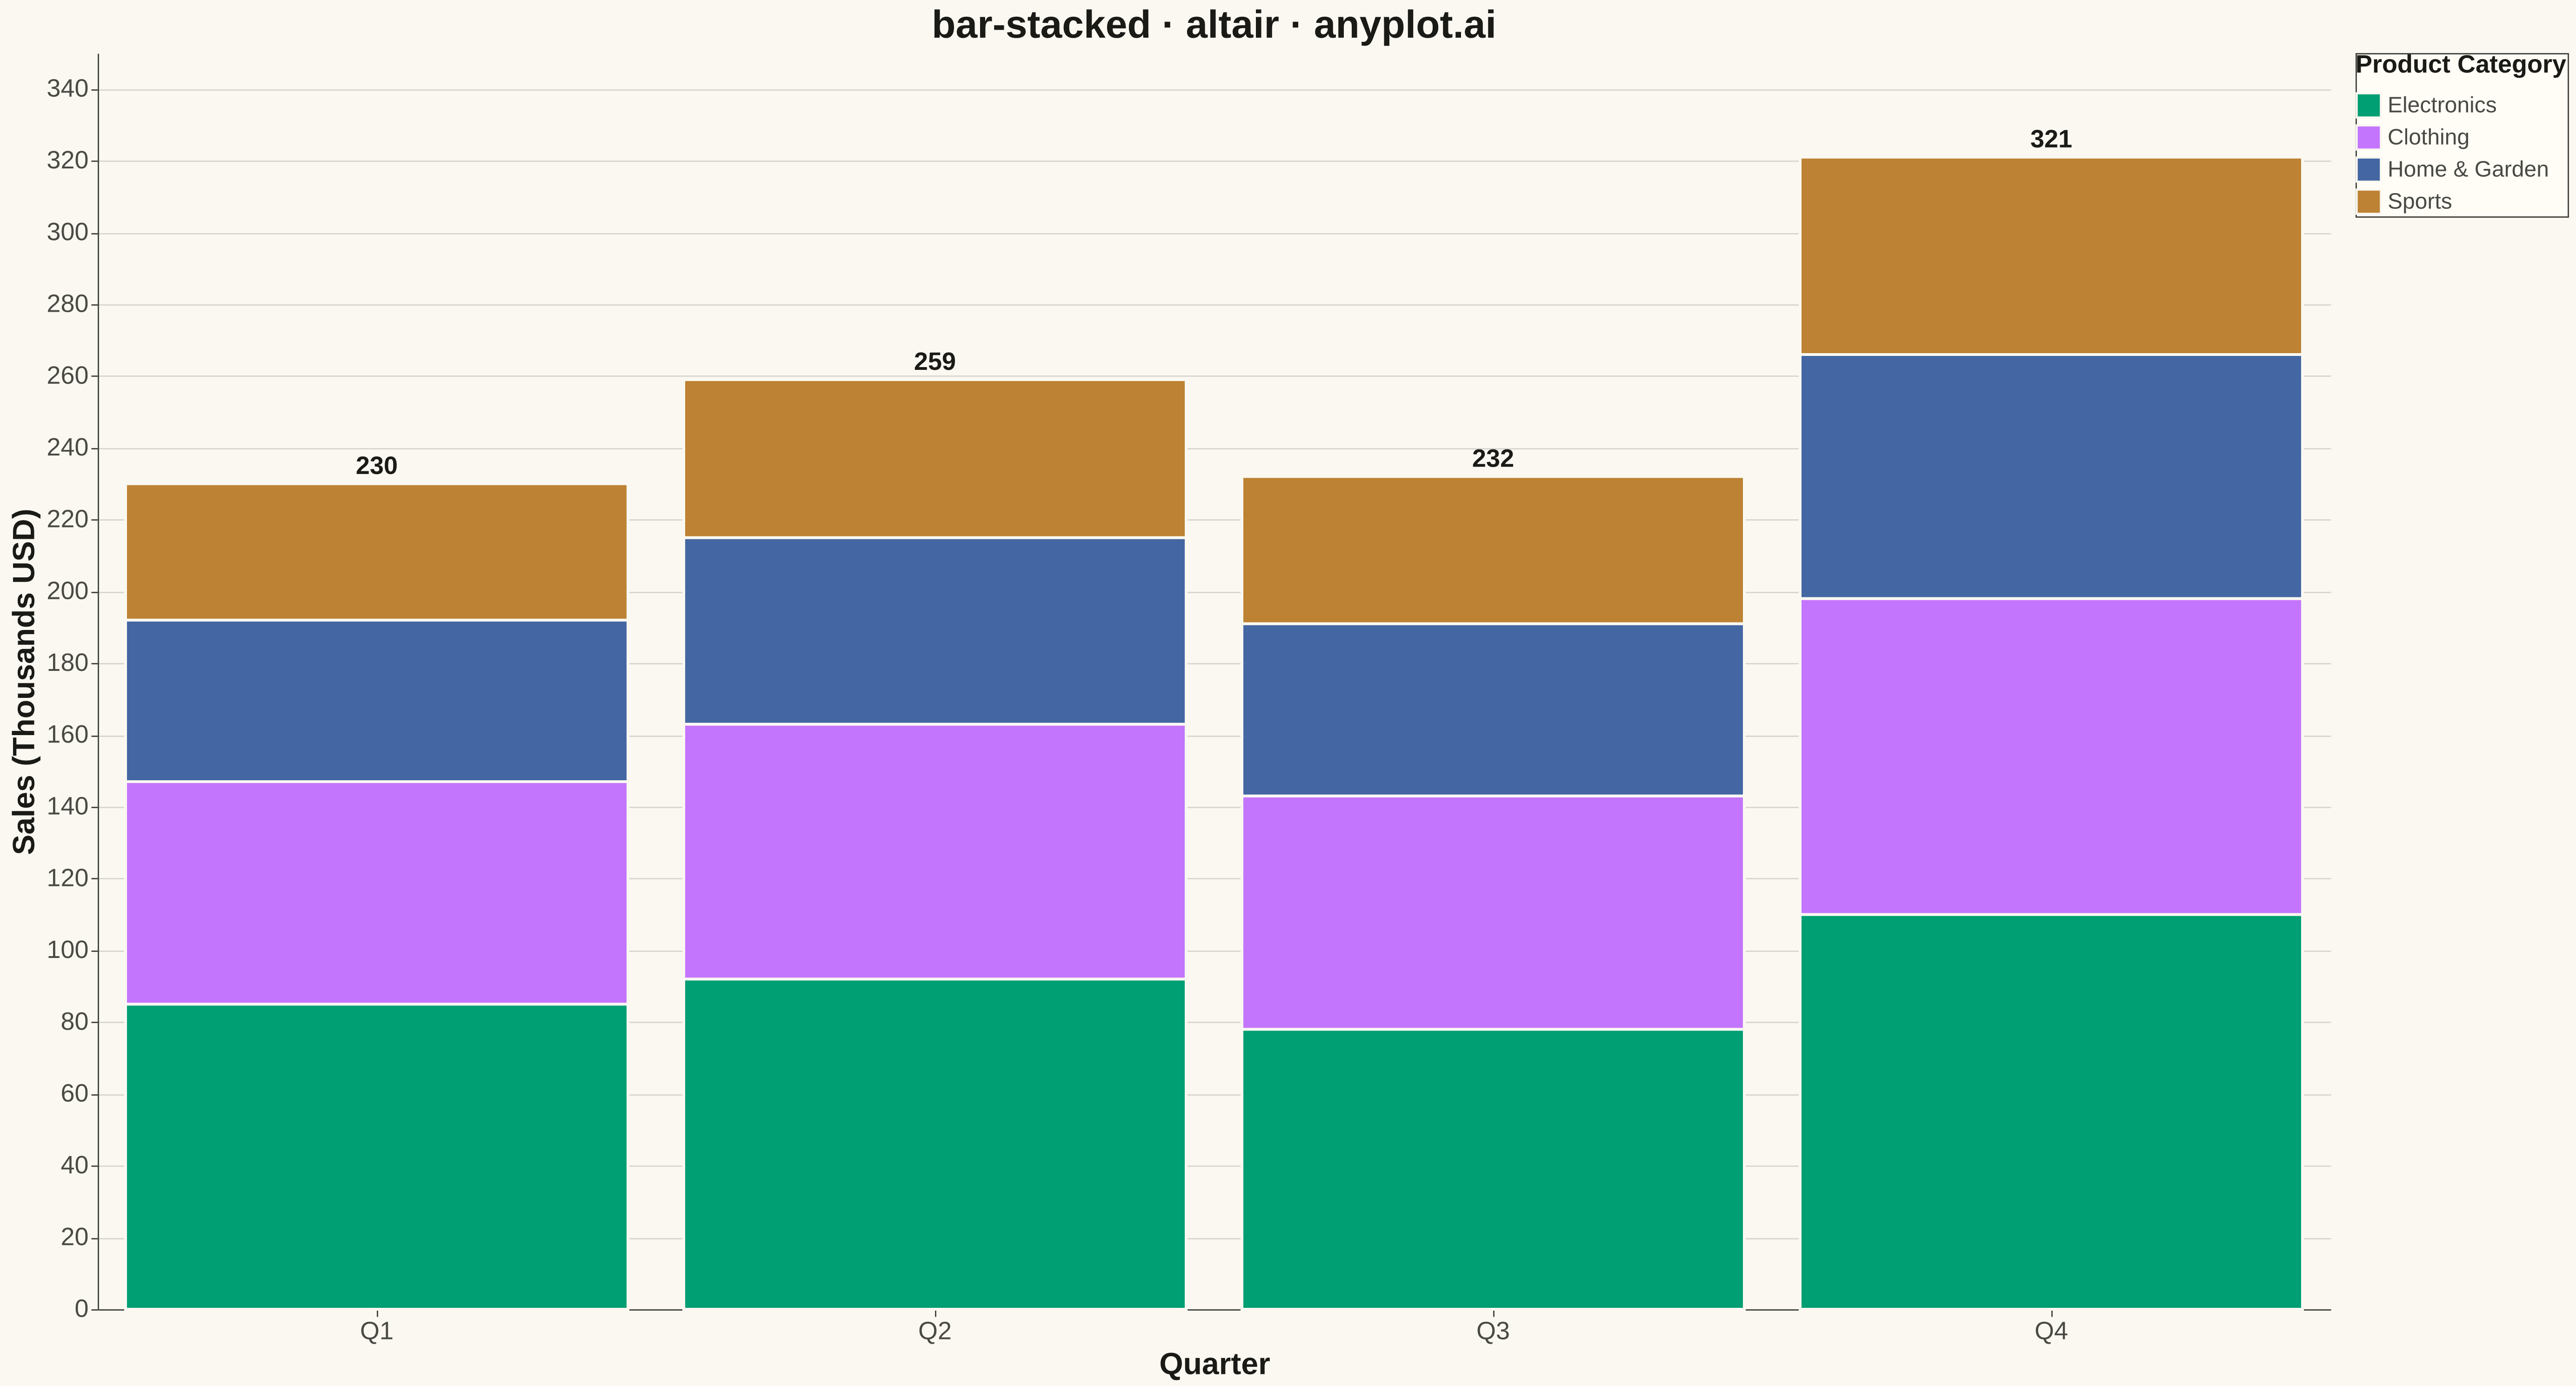
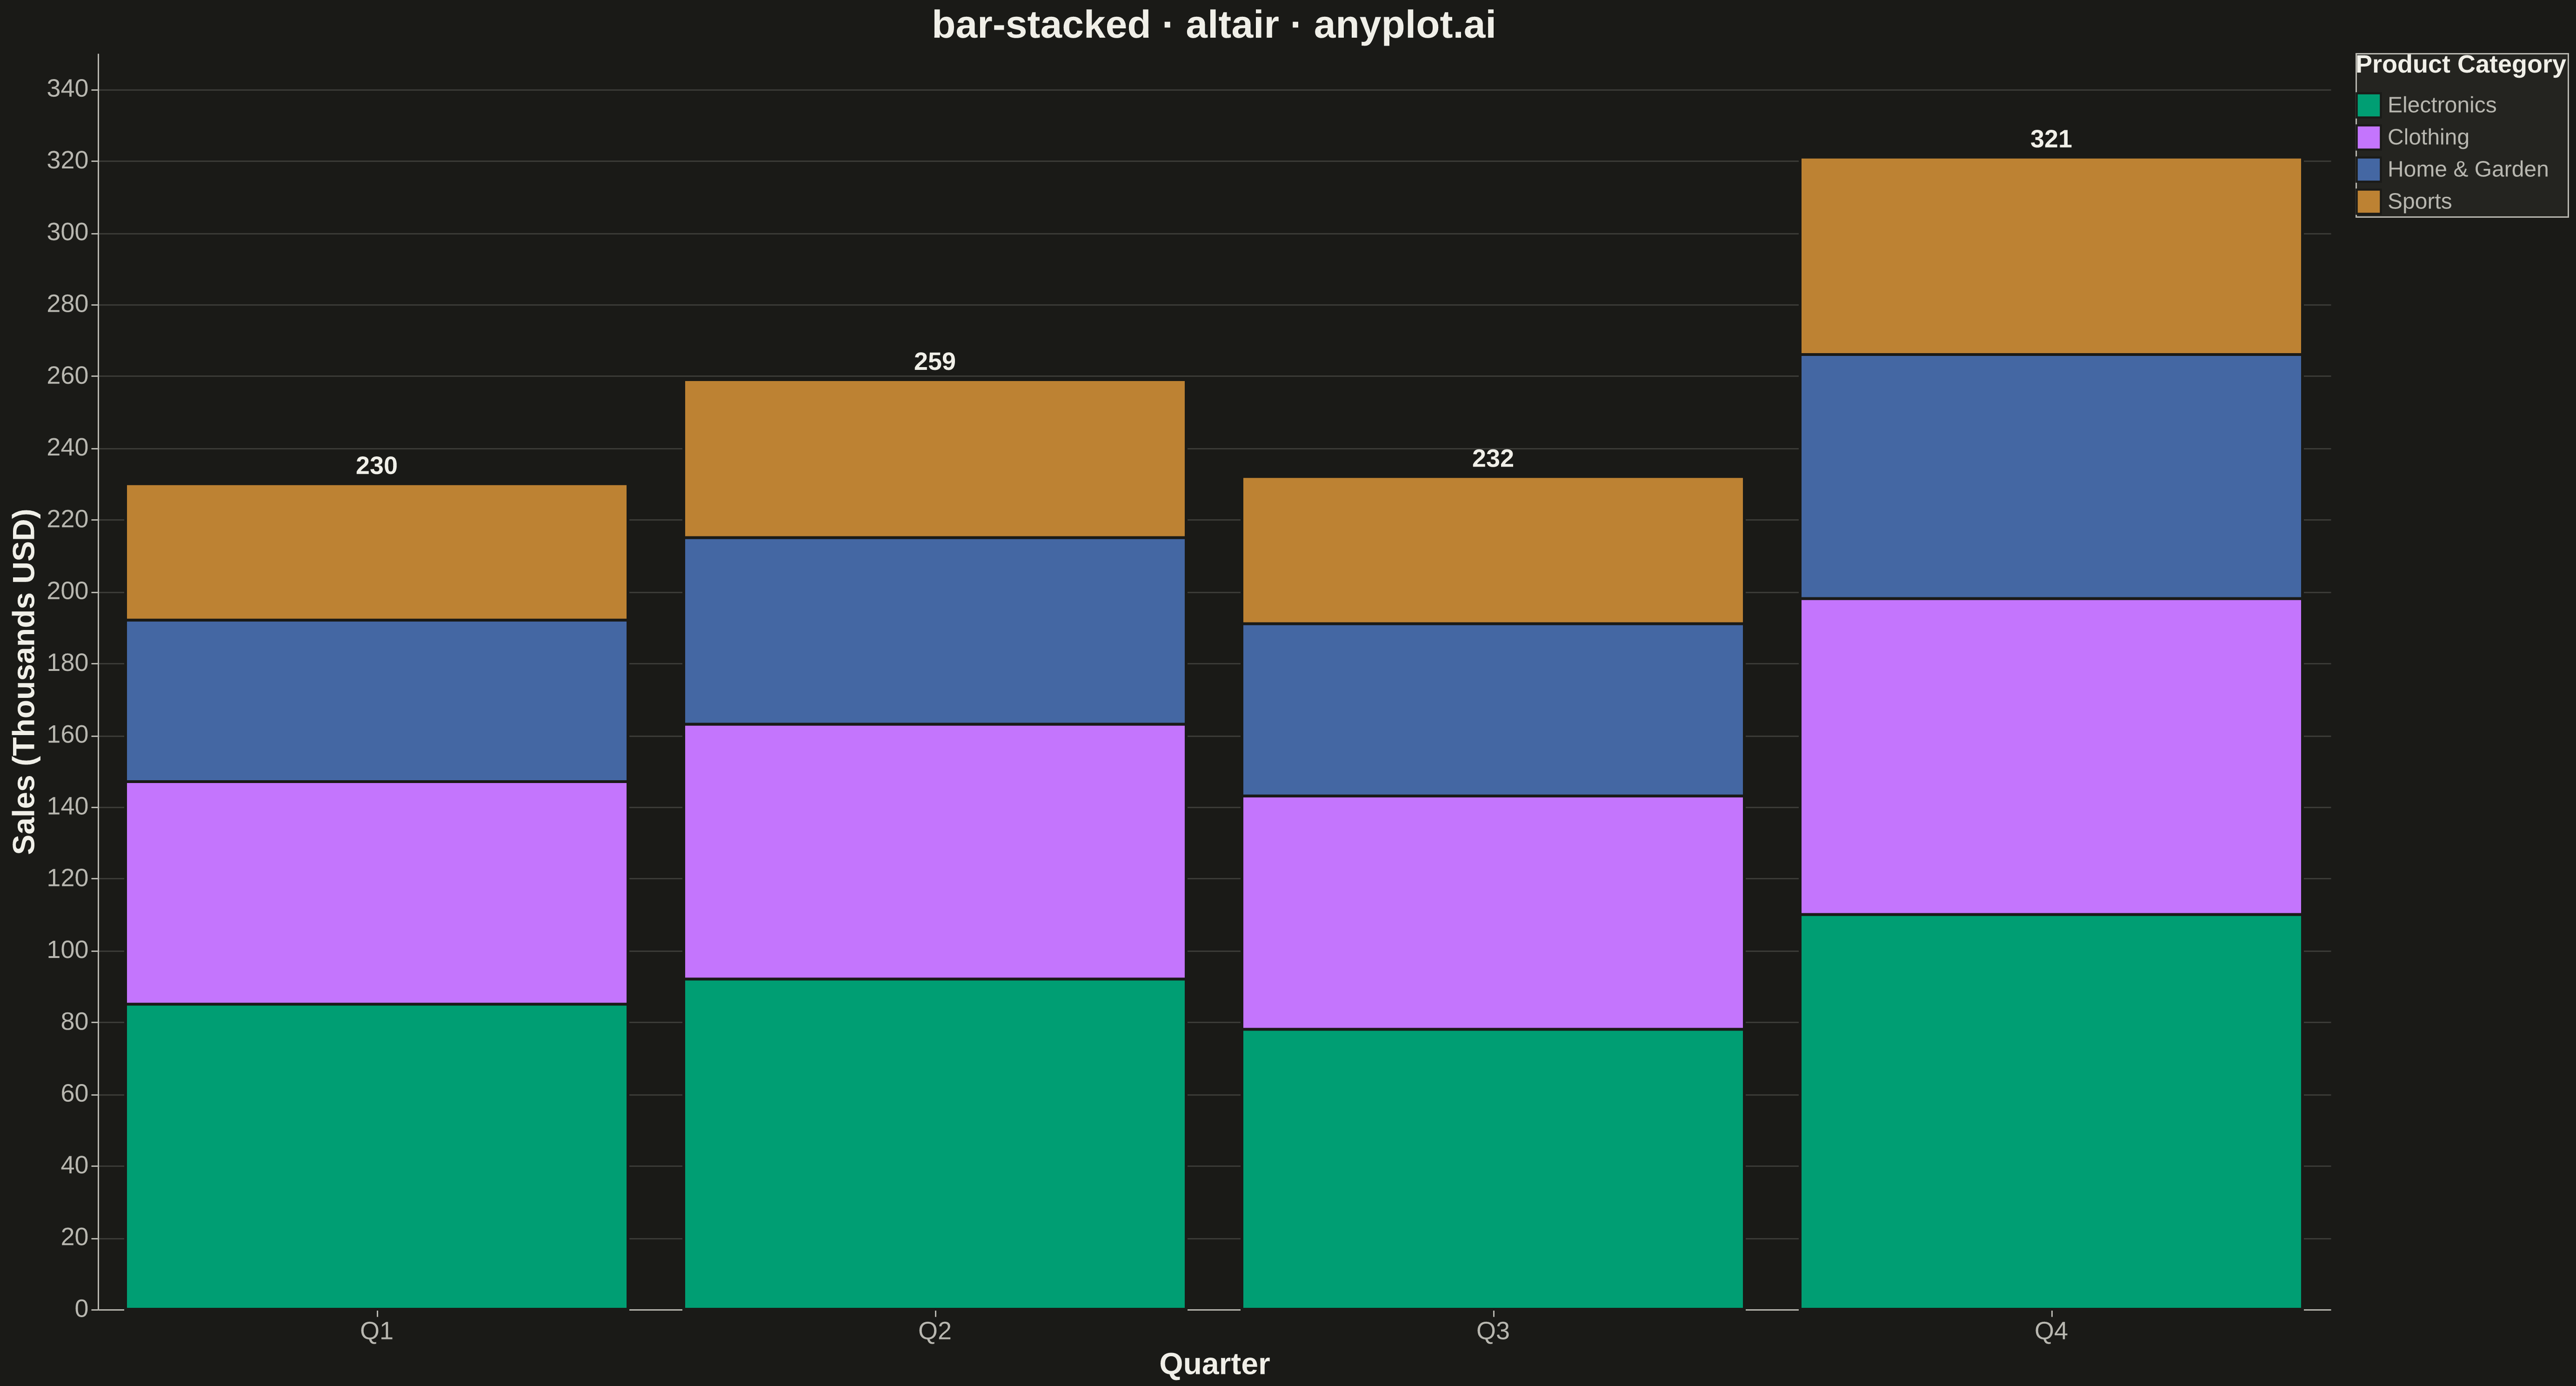
A stacked bar chart that displays multiple data series stacked on top of each other within each category, showing both individual component values and their cumulative totals. This visualization excels at revealing part-to-whole relationships while maintaining the ability to compare totals across categories. Stacked bar charts are particularly effective for composition analysis, where understanding how different components contribute to a whole is as important as comparing totals.
""" anyplot.ai
bar-stacked: Stacked Bar Chart
Library: altair 6.1.0 | Python 3.13.13
Quality: 91/100 | Updated: 2026-05-09
"""

import os

import altair as alt
import pandas as pd


# Theme tokens (see prompts/default-style-guide.md)
THEME = os.getenv("ANYPLOT_THEME", "light")
PAGE_BG = "#FAF8F1" if THEME == "light" else "#1A1A17"
ELEVATED_BG = "#FFFDF6" if THEME == "light" else "#242420"
INK = "#1A1A17" if THEME == "light" else "#F0EFE8"
INK_SOFT = "#4A4A44" if THEME == "light" else "#B8B7B0"

# Okabe-Ito palette: first series is ALWAYS #009E73
IMPRINT = ["#009E73", "#C475FD", "#4467A3", "#BD8233"]

# Data: Quarterly sales by product category
data = pd.DataFrame(
    {
        "Quarter": ["Q1", "Q1", "Q1", "Q1", "Q2", "Q2", "Q2", "Q2", "Q3", "Q3", "Q3", "Q3", "Q4", "Q4", "Q4", "Q4"],
        "Product": [
            "Electronics",
            "Clothing",
            "Home & Garden",
            "Sports",
            "Electronics",
            "Clothing",
            "Home & Garden",
            "Sports",
            "Electronics",
            "Clothing",
            "Home & Garden",
            "Sports",
            "Electronics",
            "Clothing",
            "Home & Garden",
            "Sports",
        ],
        "Sales": [85, 62, 45, 38, 92, 71, 52, 44, 78, 65, 48, 41, 110, 88, 68, 55],
    }
)

# Define category order (largest at bottom) and apply Okabe-Ito colors
category_order = ["Electronics", "Clothing", "Home & Garden", "Sports"]
order_map = {cat: i for i, cat in enumerate(category_order)}
data["color_order"] = data["Product"].map(order_map)

# Calculate totals for labels above stacks
totals = data.groupby("Quarter")["Sales"].sum().reset_index()
totals.columns = ["Quarter", "Total"]

# Create stacked bar chart
bars = (
    alt.Chart(data)
    .mark_bar(stroke=PAGE_BG, strokeWidth=2)
    .encode(
        x=alt.X("Quarter:O", title="Quarter", axis=alt.Axis(labelFontSize=18, titleFontSize=22, labelAngle=0)),
        y=alt.Y("sum(Sales):Q", title="Sales (Thousands USD)", axis=alt.Axis(labelFontSize=18, titleFontSize=22)),
        color=alt.Color(
            "Product:N",
            title="Product Category",
            scale=alt.Scale(domain=category_order, range=IMPRINT),
            legend=alt.Legend(
                titleFontSize=18, labelFontSize=16, symbolSize=300, orient="right", titlePadding=10, labelLimit=150
            ),
        ),
        order=alt.Order("color_order:Q", sort="ascending"),
        tooltip=["Quarter:O", "Product:N", alt.Tooltip("Sales:Q", title="Sales (K USD)")],
    )
)

# Add total value labels above each stack
text = (
    alt.Chart(totals)
    .mark_text(fontSize=18, fontWeight="bold", dy=-12, color=INK)
    .encode(x=alt.X("Quarter:O"), y=alt.Y("Total:Q"), text=alt.Text("Total:Q", format=".0f"))
)

# Combine bars and labels
chart = (
    (bars + text)
    .properties(
        width=1600,
        height=900,
        background=PAGE_BG,
        title=alt.Title("bar-stacked · altair · anyplot.ai", fontSize=28, anchor="middle"),
    )
    .configure_view(fill=PAGE_BG, stroke=INK_SOFT, strokeWidth=0)
    .configure_axis(
        domainColor=INK_SOFT, tickColor=INK_SOFT, gridColor=INK, gridOpacity=0.15, labelColor=INK_SOFT, titleColor=INK
    )
    .configure_title(color=INK)
    .configure_legend(fillColor=ELEVATED_BG, strokeColor=INK_SOFT, labelColor=INK_SOFT, titleColor=INK)
)

# Save as PNG and HTML with theme-suffixed filenames
chart.save(f"plot-{THEME}.png", scale_factor=3.0)
chart.save(f"plot-{THEME}.html")
Runnable source as JSON, for any HTTP client: https://api.anyplot.ai/specs/bar-stacked/altair/code. Any spec id and library id listed in llms-full.txt fit the same URL shape; every URL below is complete and callable.
{
  "spec_id": "bar-stacked",
  "language": "python",
  "library": "altair",
  "page": "https://anyplot.ai/bar-stacked/python/altair",
  "hub": "https://anyplot.ai/bar-stacked",
  "code_json": "https://api.anyplot.ai/specs/bar-stacked/altair/code",
  "spec_json": "https://api.anyplot.ai/specs/bar-stacked",
  "render_light_png": "https://storage.googleapis.com/anyplot-images/plots/bar-stacked/python/altair/plot-light.png",
  "render_dark_png": "https://storage.googleapis.com/anyplot-images/plots/bar-stacked/python/altair/plot-dark.png",
  "interactive_light_html": "https://storage.googleapis.com/anyplot-images/plots/bar-stacked/python/altair/plot-light.html",
  "interactive_dark_html": "https://storage.googleapis.com/anyplot-images/plots/bar-stacked/python/altair/plot-dark.html",
  "quality_score": 91.0,
  "license": "MIT",
  "guide": "https://anyplot.ai/llms.txt"
}
Part of Stacked Bar Chart on anyplot.ai.