The same plot in 14 other libraries — JavaScript: Chart.js, Apache ECharts, Highcharts, MUI X Charts; Python: Altair, Bokeh, lets-plot, Matplotlib, Plotly, plotnine, Pygal, Seaborn; R: ggplot2; Julia: Makie.jl. Compare all 15 side by side: Basic Candlestick Chart in Python, R, Julia and JavaScript.
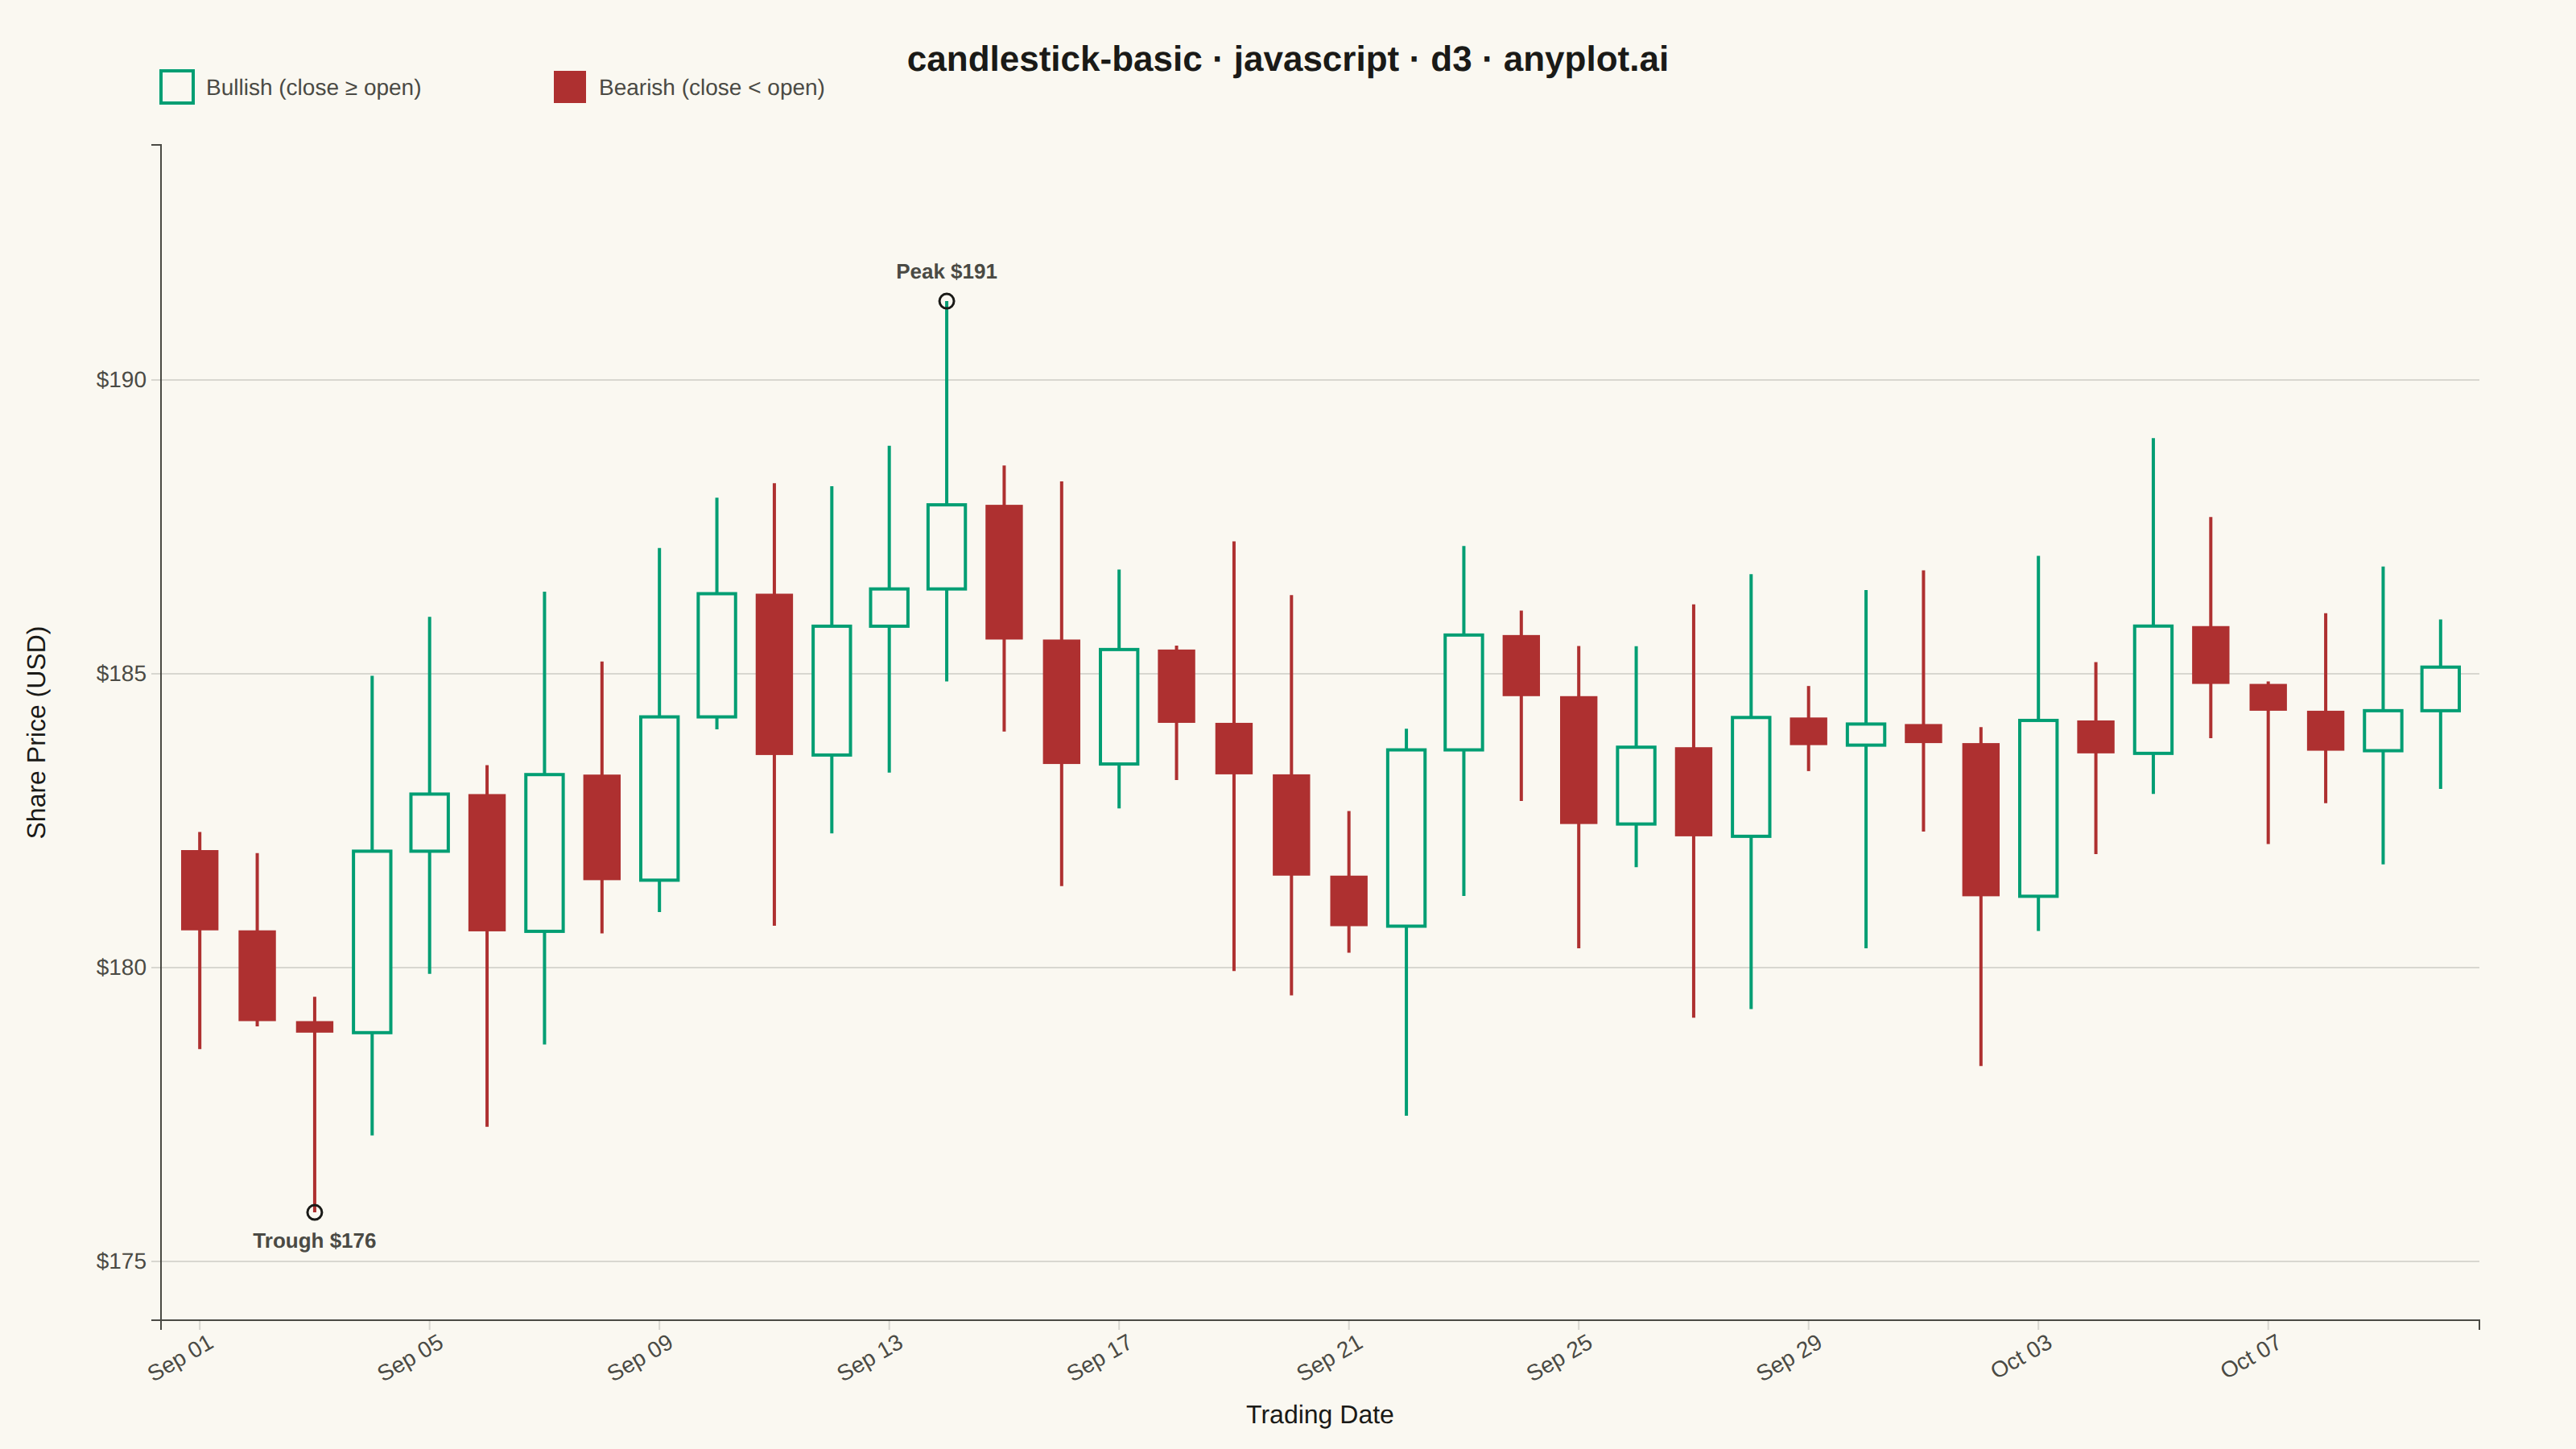
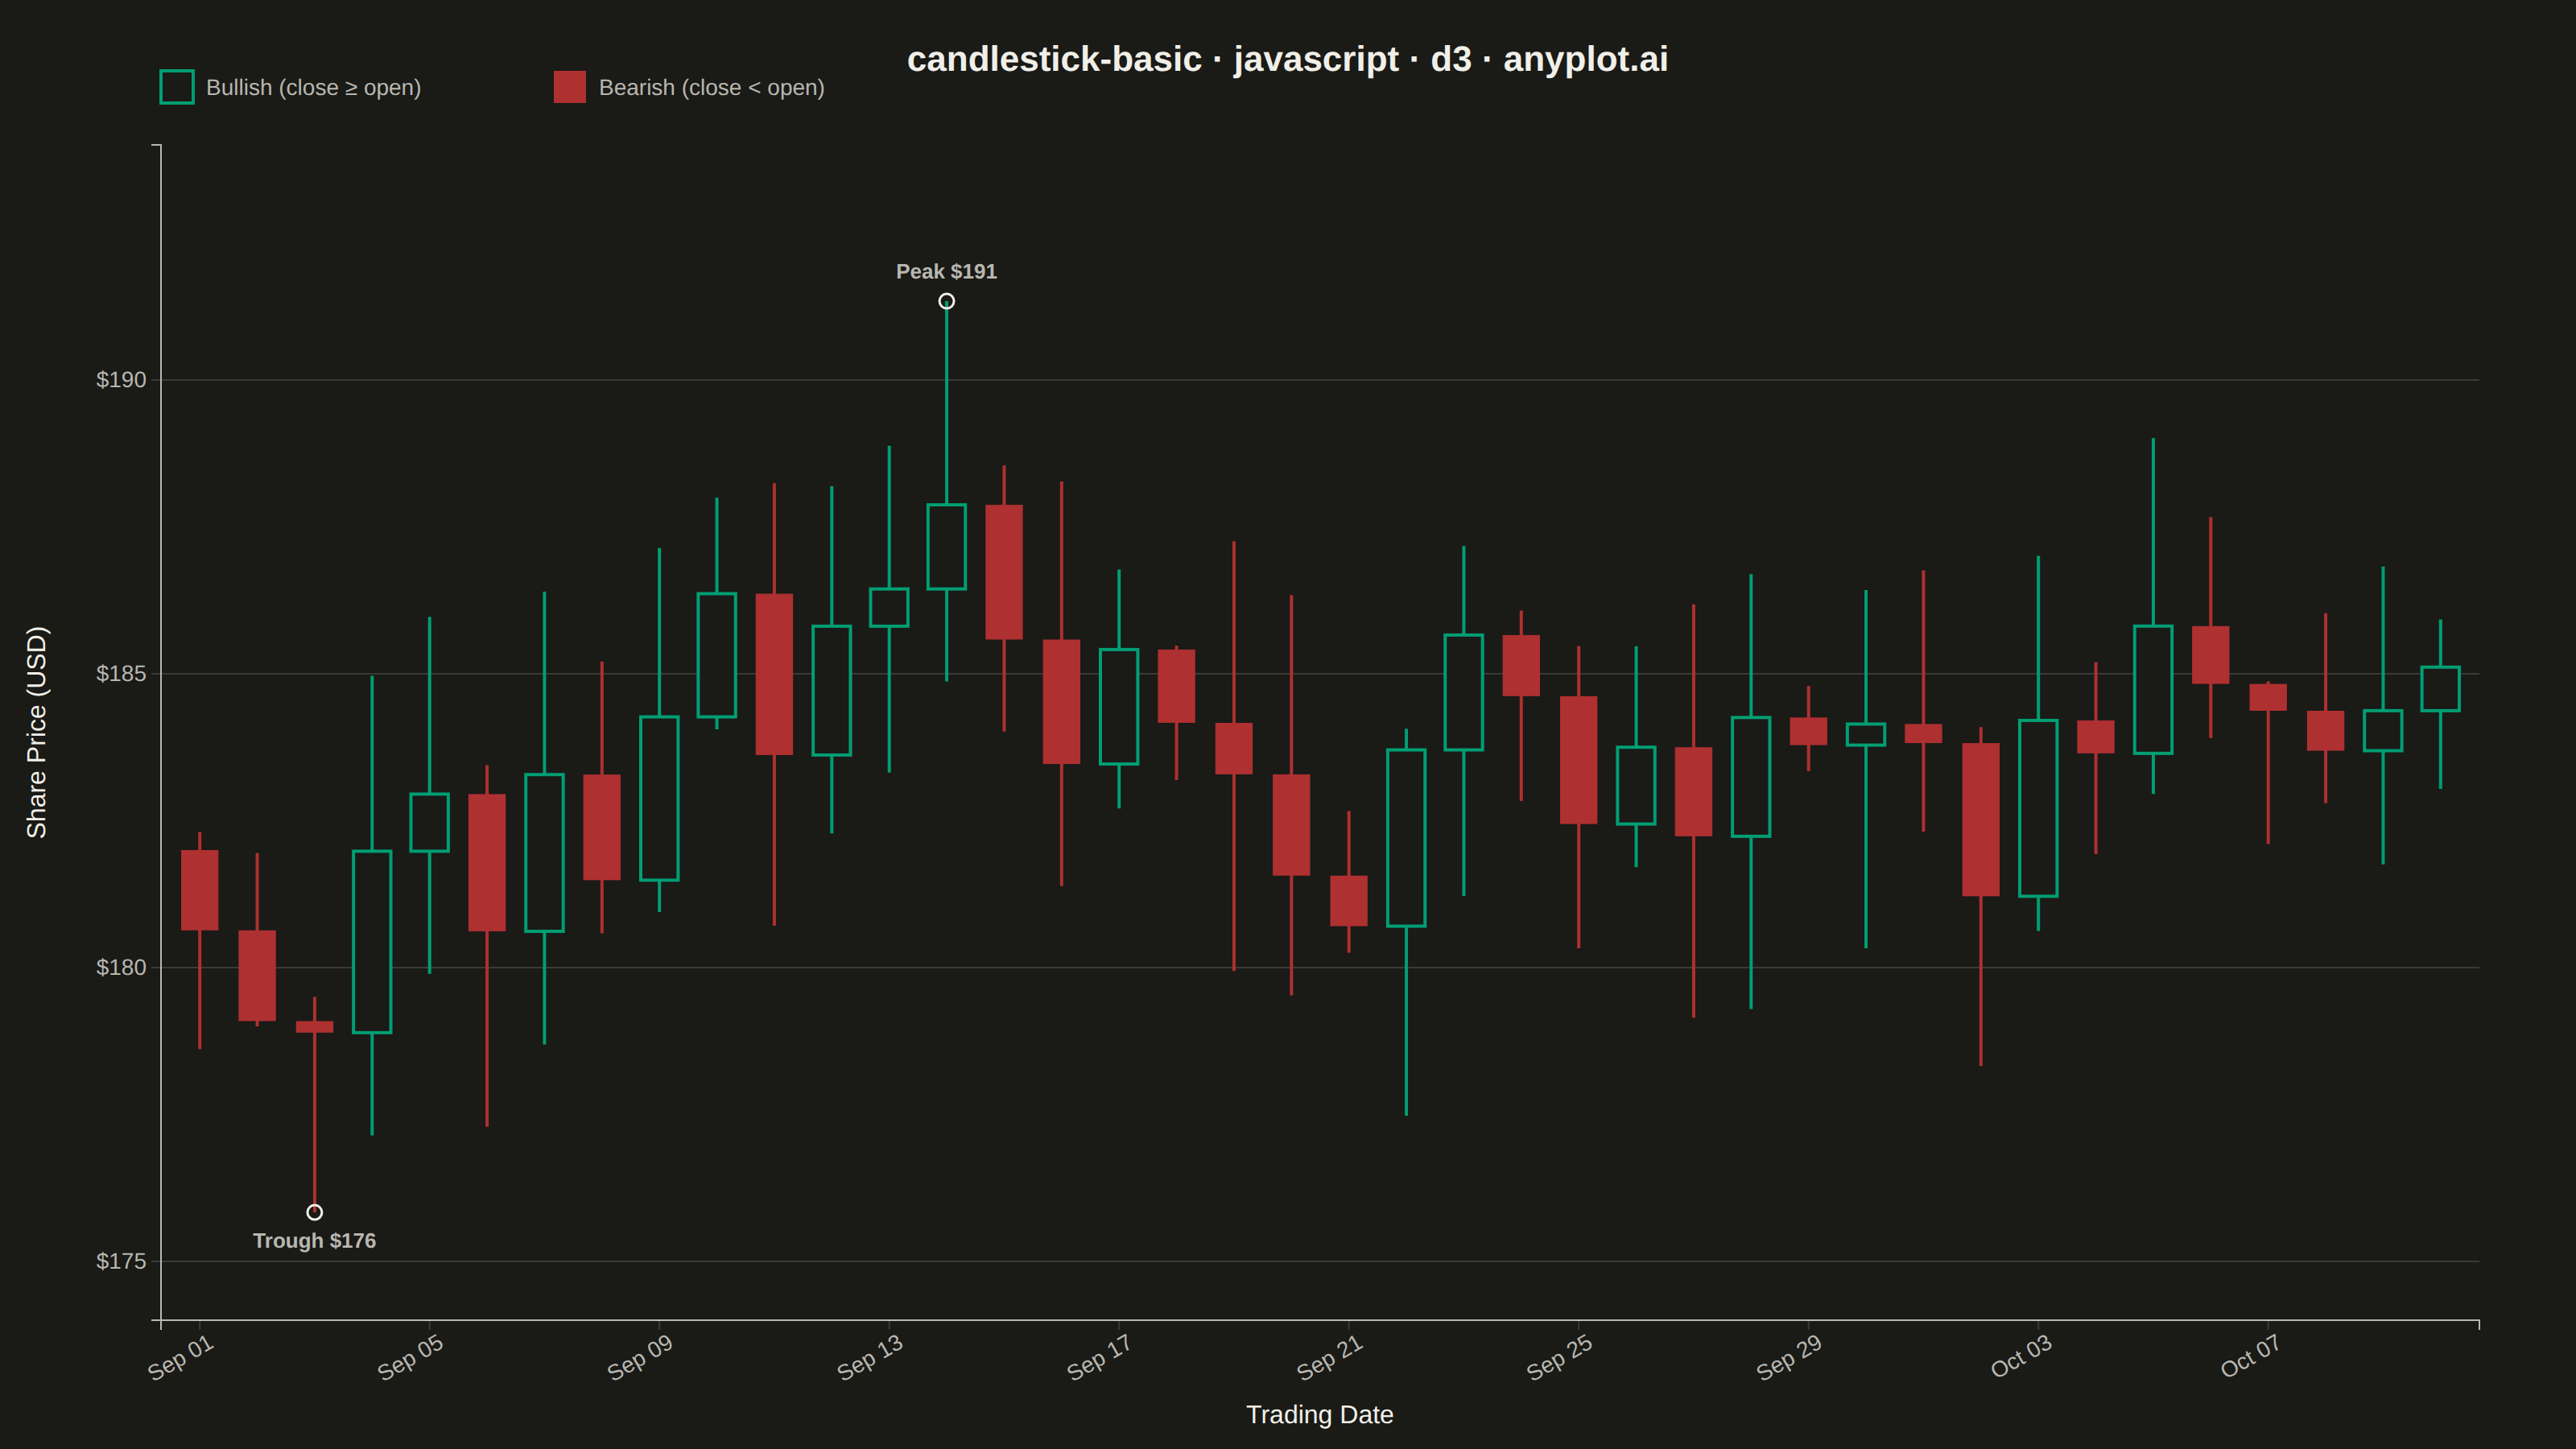
A candlestick chart displays open, high, low, and close (OHLC) price data for financial instruments over time. Each candlestick shows the price range within a specific period, with the body indicating the open-close range and the wicks (shadows) showing the high-low range. Color coding distinguishes bullish (price increase) from bearish (price decrease) periods, making it easy to identify trends and price patterns at a glance.
// anyplot.ai
// candlestick-basic: Basic Candlestick Chart
// Library: d3 7.9.0 | JavaScript 22.23.2
// Quality: 89/100 | Created: 2026-08-24

const t = window.ANYPLOT_TOKENS;
const { width, height } = window.ANYPLOT_SIZE;
const margin = { top: 90, right: 60, bottom: 80, left: 100 };
const iw = width - margin.left - margin.right;
const ih = height - margin.top - margin.bottom;

// --- Data (in-memory, deterministic OHLC via fixed-seed LCG) ---------------
function lcg(seed) {
  let state = seed;
  return () => {
    state = (state * 1664525 + 1013904223) % 4294967296;
    return state / 4294967296;
  };
}
const rand = lcg(42);

const numDays = 40;
const startDate = new Date(2025, 8, 1);
let price = 182;
const candles = [];
for (let i = 0; i < numDays; i++) {
  const date = new Date(startDate);
  date.setDate(date.getDate() + i);
  const drift = (rand() - 0.48) * 6;
  const open = price;
  const close = Math.max(5, open + drift);
  const wickUp = rand() * 3.5;
  const wickDown = rand() * 3.5;
  const high = Math.max(open, close) + wickUp;
  const low = Math.max(1, Math.min(open, close) - wickDown);
  candles.push({ date, open, high, low, close });
  price = close;
}
const peakCandle = candles.reduce((a, b) => (b.high > a.high ? b : a));
const troughCandle = candles.reduce((a, b) => (b.low < a.low ? b : a));

// --- SVG mount ----------------------------------------------------------------
const svg = d3.select("#container").append("svg").attr("width", width).attr("height", height);
const g = svg.append("g").attr("transform", `translate(${margin.left},${margin.top})`);

// --- Scales ---------------------------------------------------------------
const x = d3
  .scaleBand()
  .domain(candles.map((d) => d.date))
  .range([0, iw])
  .padding(0.35);

const yMin = d3.min(candles, (d) => d.low);
const yMax = d3.max(candles, (d) => d.high);
const yPad = (yMax - yMin) * 0.08;
const y = d3
  .scaleLinear()
  .domain([yMin - yPad, yMax + yPad])
  .nice()
  .range([ih, 0]);

// --- Gridlines (y-axis only, subtle) ---------------------------------------
g.append("g")
  .selectAll("line")
  .data(y.ticks(6))
  .join("line")
  .attr("x1", 0)
  .attr("x2", iw)
  .attr("y1", (d) => y(d))
  .attr("y2", (d) => y(d))
  .attr("stroke", t.grid)
  .attr("stroke-width", 1);

// --- Axes -------------------------------------------------------------------
const tickEvery = Math.ceil(numDays / 10);
const xTickDates = candles.filter((_, i) => i % tickEvery === 0).map((d) => d.date);
const xAxis = g
  .append("g")
  .attr("transform", `translate(0,${ih})`)
  .call(
    d3
      .axisBottom(x)
      .tickValues(xTickDates)
      .tickFormat(d3.timeFormat("%b %d")),
  );
const yAxis = g.append("g").call(d3.axisLeft(y).ticks(6).tickFormat((d) => `$${d.toFixed(0)}`));
for (const ax of [xAxis, yAxis]) {
  ax.selectAll("text").attr("fill", t.inkSoft).style("font-size", "14px");
  ax.selectAll("line").attr("stroke", t.grid);
  ax.select(".domain").attr("stroke", t.inkSoft);
}
xAxis.selectAll("text").attr("transform", "rotate(-30)").style("text-anchor", "end");

// --- Candlesticks (bullish hollow-green / bearish filled-red — dual-cue: hue
// AND fill style, so the bull/bear signal survives colorblind simulation) ---
const bullColor = t.palette[0]; // brand green — up days
const bearColor = t.palette[4]; // matte red — down days, semantic loss anchor
const wickWidth = 2;
const bodyWidth = Math.max(3, x.bandwidth());
const isBull = (d) => d.close >= d.open;

const candleG = g
  .selectAll(".candle")
  .data(candles)
  .join("g")
  .attr("class", "candle")
  .attr("transform", (d) => `translate(${x(d.date) + x.bandwidth() / 2},0)`);

candleG
  .append("line")
  .attr("y1", (d) => y(d.high))
  .attr("y2", (d) => y(d.low))
  .attr("stroke", (d) => (isBull(d) ? bullColor : bearColor))
  .attr("stroke-width", wickWidth);

candleG
  .append("rect")
  .attr("x", -bodyWidth / 2)
  .attr("y", (d) => y(Math.max(d.open, d.close)))
  .attr("width", bodyWidth)
  .attr("height", (d) => Math.max(1.5, Math.abs(y(d.open) - y(d.close))))
  .attr("fill", (d) => (isBull(d) ? t.pageBg : bearColor))
  .attr("stroke", (d) => (isBull(d) ? bullColor : bearColor))
  .attr("stroke-width", (d) => (isBull(d) ? 2 : 0));

// --- Peak / trough annotations (data storytelling) --------------------------
function annotate(candle, value, label, dy) {
  const cx = x(candle.date) + x.bandwidth() / 2;
  const cy = y(value);
  g.append("circle")
    .attr("cx", cx)
    .attr("cy", cy)
    .attr("r", 4.5)
    .attr("fill", "none")
    .attr("stroke", t.ink)
    .attr("stroke-width", 1.5);
  g.append("text")
    .attr("x", cx)
    .attr("y", cy + dy)
    .attr("text-anchor", "middle")
    .attr("fill", t.inkSoft)
    .style("font-size", "13px")
    .style("font-weight", "600")
    .text(label);
}
annotate(peakCandle, peakCandle.high, `Peak $${peakCandle.high.toFixed(0)}`, -14);
annotate(troughCandle, troughCandle.low, `Trough $${troughCandle.low.toFixed(0)}`, 22);

// --- Legend (bullish / bearish) ---------------------------------------------
const legend = svg.append("g").attr("transform", `translate(${margin.left},${margin.top - 46})`);
const legendItems = [
  { label: "Bullish (close ≥ open)", color: bullColor, hollow: true },
  { label: "Bearish (close < open)", color: bearColor, hollow: false },
];
let lx = 0;
for (const item of legendItems) {
  const item_g = legend.append("g").attr("transform", `translate(${lx},0)`);
  item_g
    .append("rect")
    .attr("width", 20)
    .attr("height", 20)
    .attr("fill", item.hollow ? t.pageBg : item.color)
    .attr("stroke", item.color)
    .attr("stroke-width", item.hollow ? 2 : 0);
  item_g
    .append("text")
    .attr("x", 28)
    .attr("y", 15)
    .attr("fill", t.inkSoft)
    .style("font-size", "14px")
    .text(item.label);
  lx += 28 + item.label.length * 8 + 40;
}

// --- Axis labels --------------------------------------------------------------
g.append("text")
  .attr("x", iw / 2)
  .attr("y", ih + 64)
  .attr("text-anchor", "middle")
  .attr("fill", t.ink)
  .style("font-size", "16px")
  .text("Trading Date");

g.append("text")
  .attr("transform", "rotate(-90)")
  .attr("x", -ih / 2)
  .attr("y", -72)
  .attr("text-anchor", "middle")
  .attr("fill", t.ink)
  .style("font-size", "16px")
  .text("Share Price (USD)");

// --- Title ------------------------------------------------------------------
svg
  .append("text")
  .attr("x", width / 2)
  .attr("y", 44)
  .attr("text-anchor", "middle")
  .attr("fill", t.ink)
  .style("font-size", "22px")
  .style("font-weight", "600")
  .text("candlestick-basic · javascript · d3 · anyplot.ai");
Runnable source as JSON, for any HTTP client: https://api.anyplot.ai/specs/candlestick-basic/d3/code. Any spec id and library id listed in llms-full.txt fit the same URL shape; every URL below is complete and callable.
{
  "spec_id": "candlestick-basic",
  "language": "javascript",
  "library": "d3",
  "page": "https://anyplot.ai/candlestick-basic/javascript/d3",
  "hub": "https://anyplot.ai/candlestick-basic",
  "code_json": "https://api.anyplot.ai/specs/candlestick-basic/d3/code",
  "spec_json": "https://api.anyplot.ai/specs/candlestick-basic",
  "render_light_png": "https://storage.googleapis.com/anyplot-images/plots/candlestick-basic/javascript/d3/plot-light.png",
  "render_dark_png": "https://storage.googleapis.com/anyplot-images/plots/candlestick-basic/javascript/d3/plot-dark.png",
  "interactive_light_html": "https://storage.googleapis.com/anyplot-images/plots/candlestick-basic/javascript/d3/plot-light.html",
  "interactive_dark_html": "https://storage.googleapis.com/anyplot-images/plots/candlestick-basic/javascript/d3/plot-dark.html",
  "quality_score": 89.0,
  "license": "MIT",
  "guide": "https://anyplot.ai/llms.txt"
}
Part of Basic Candlestick Chart on anyplot.ai.