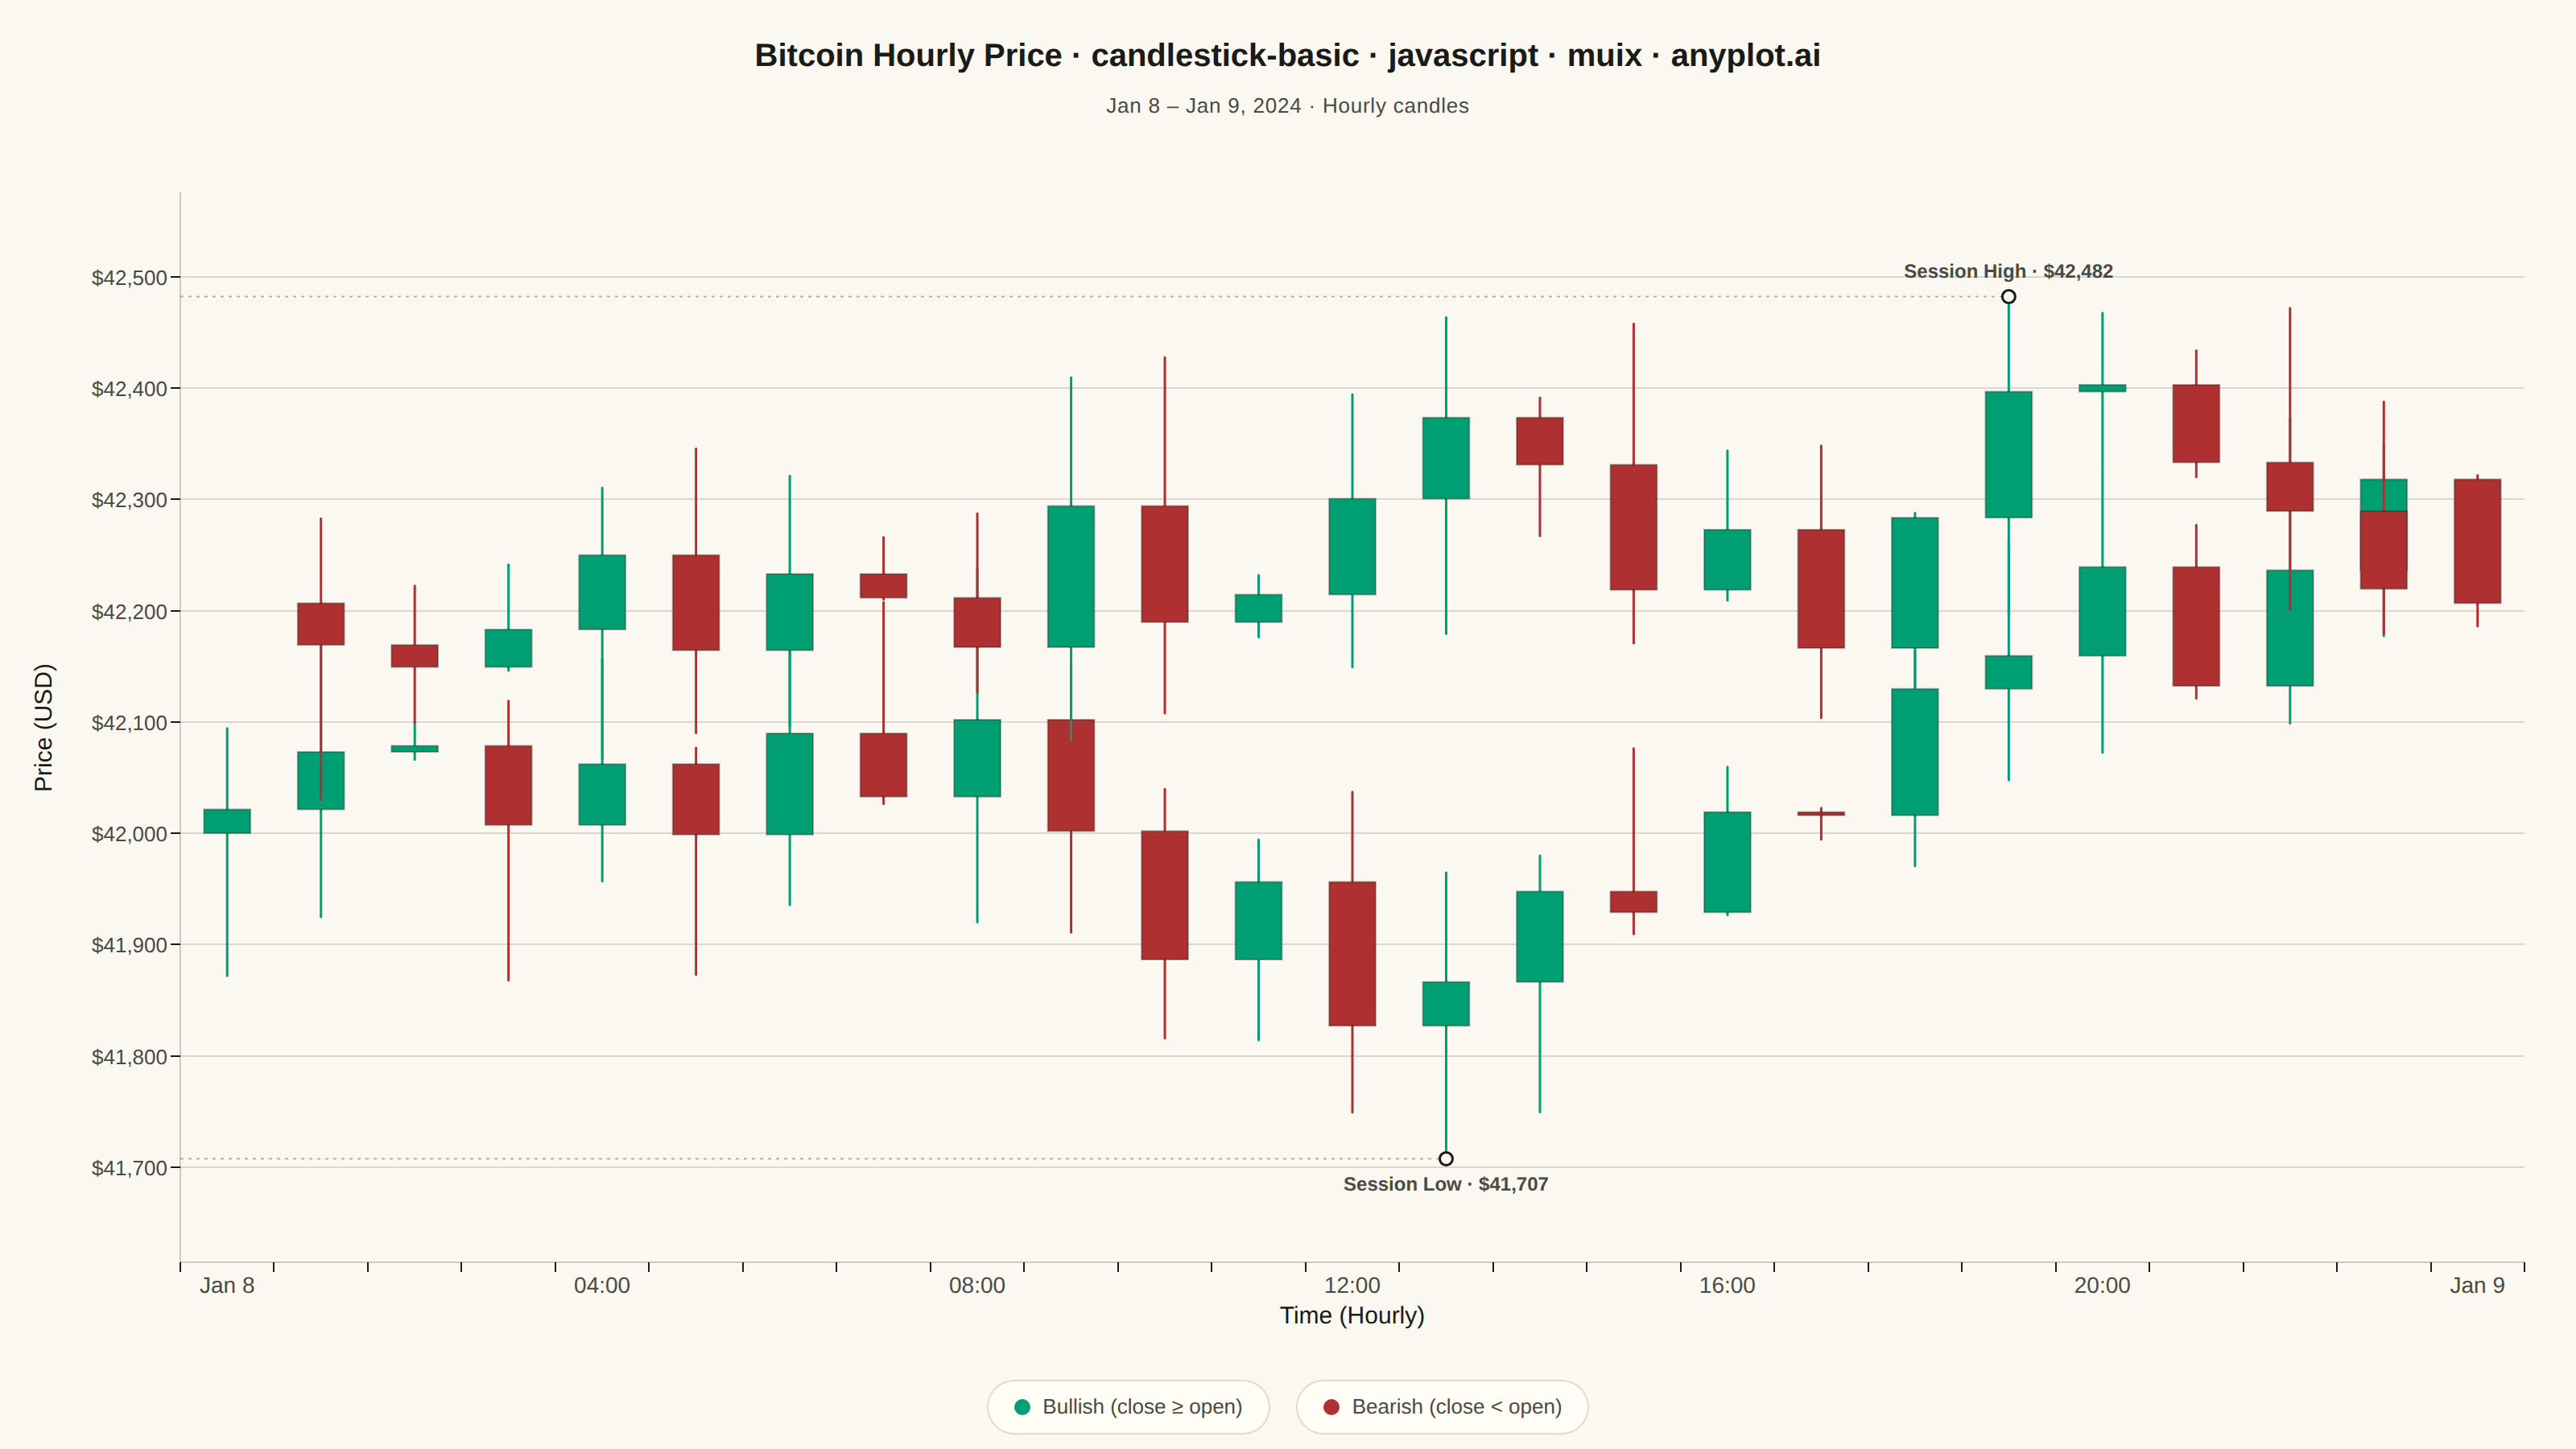
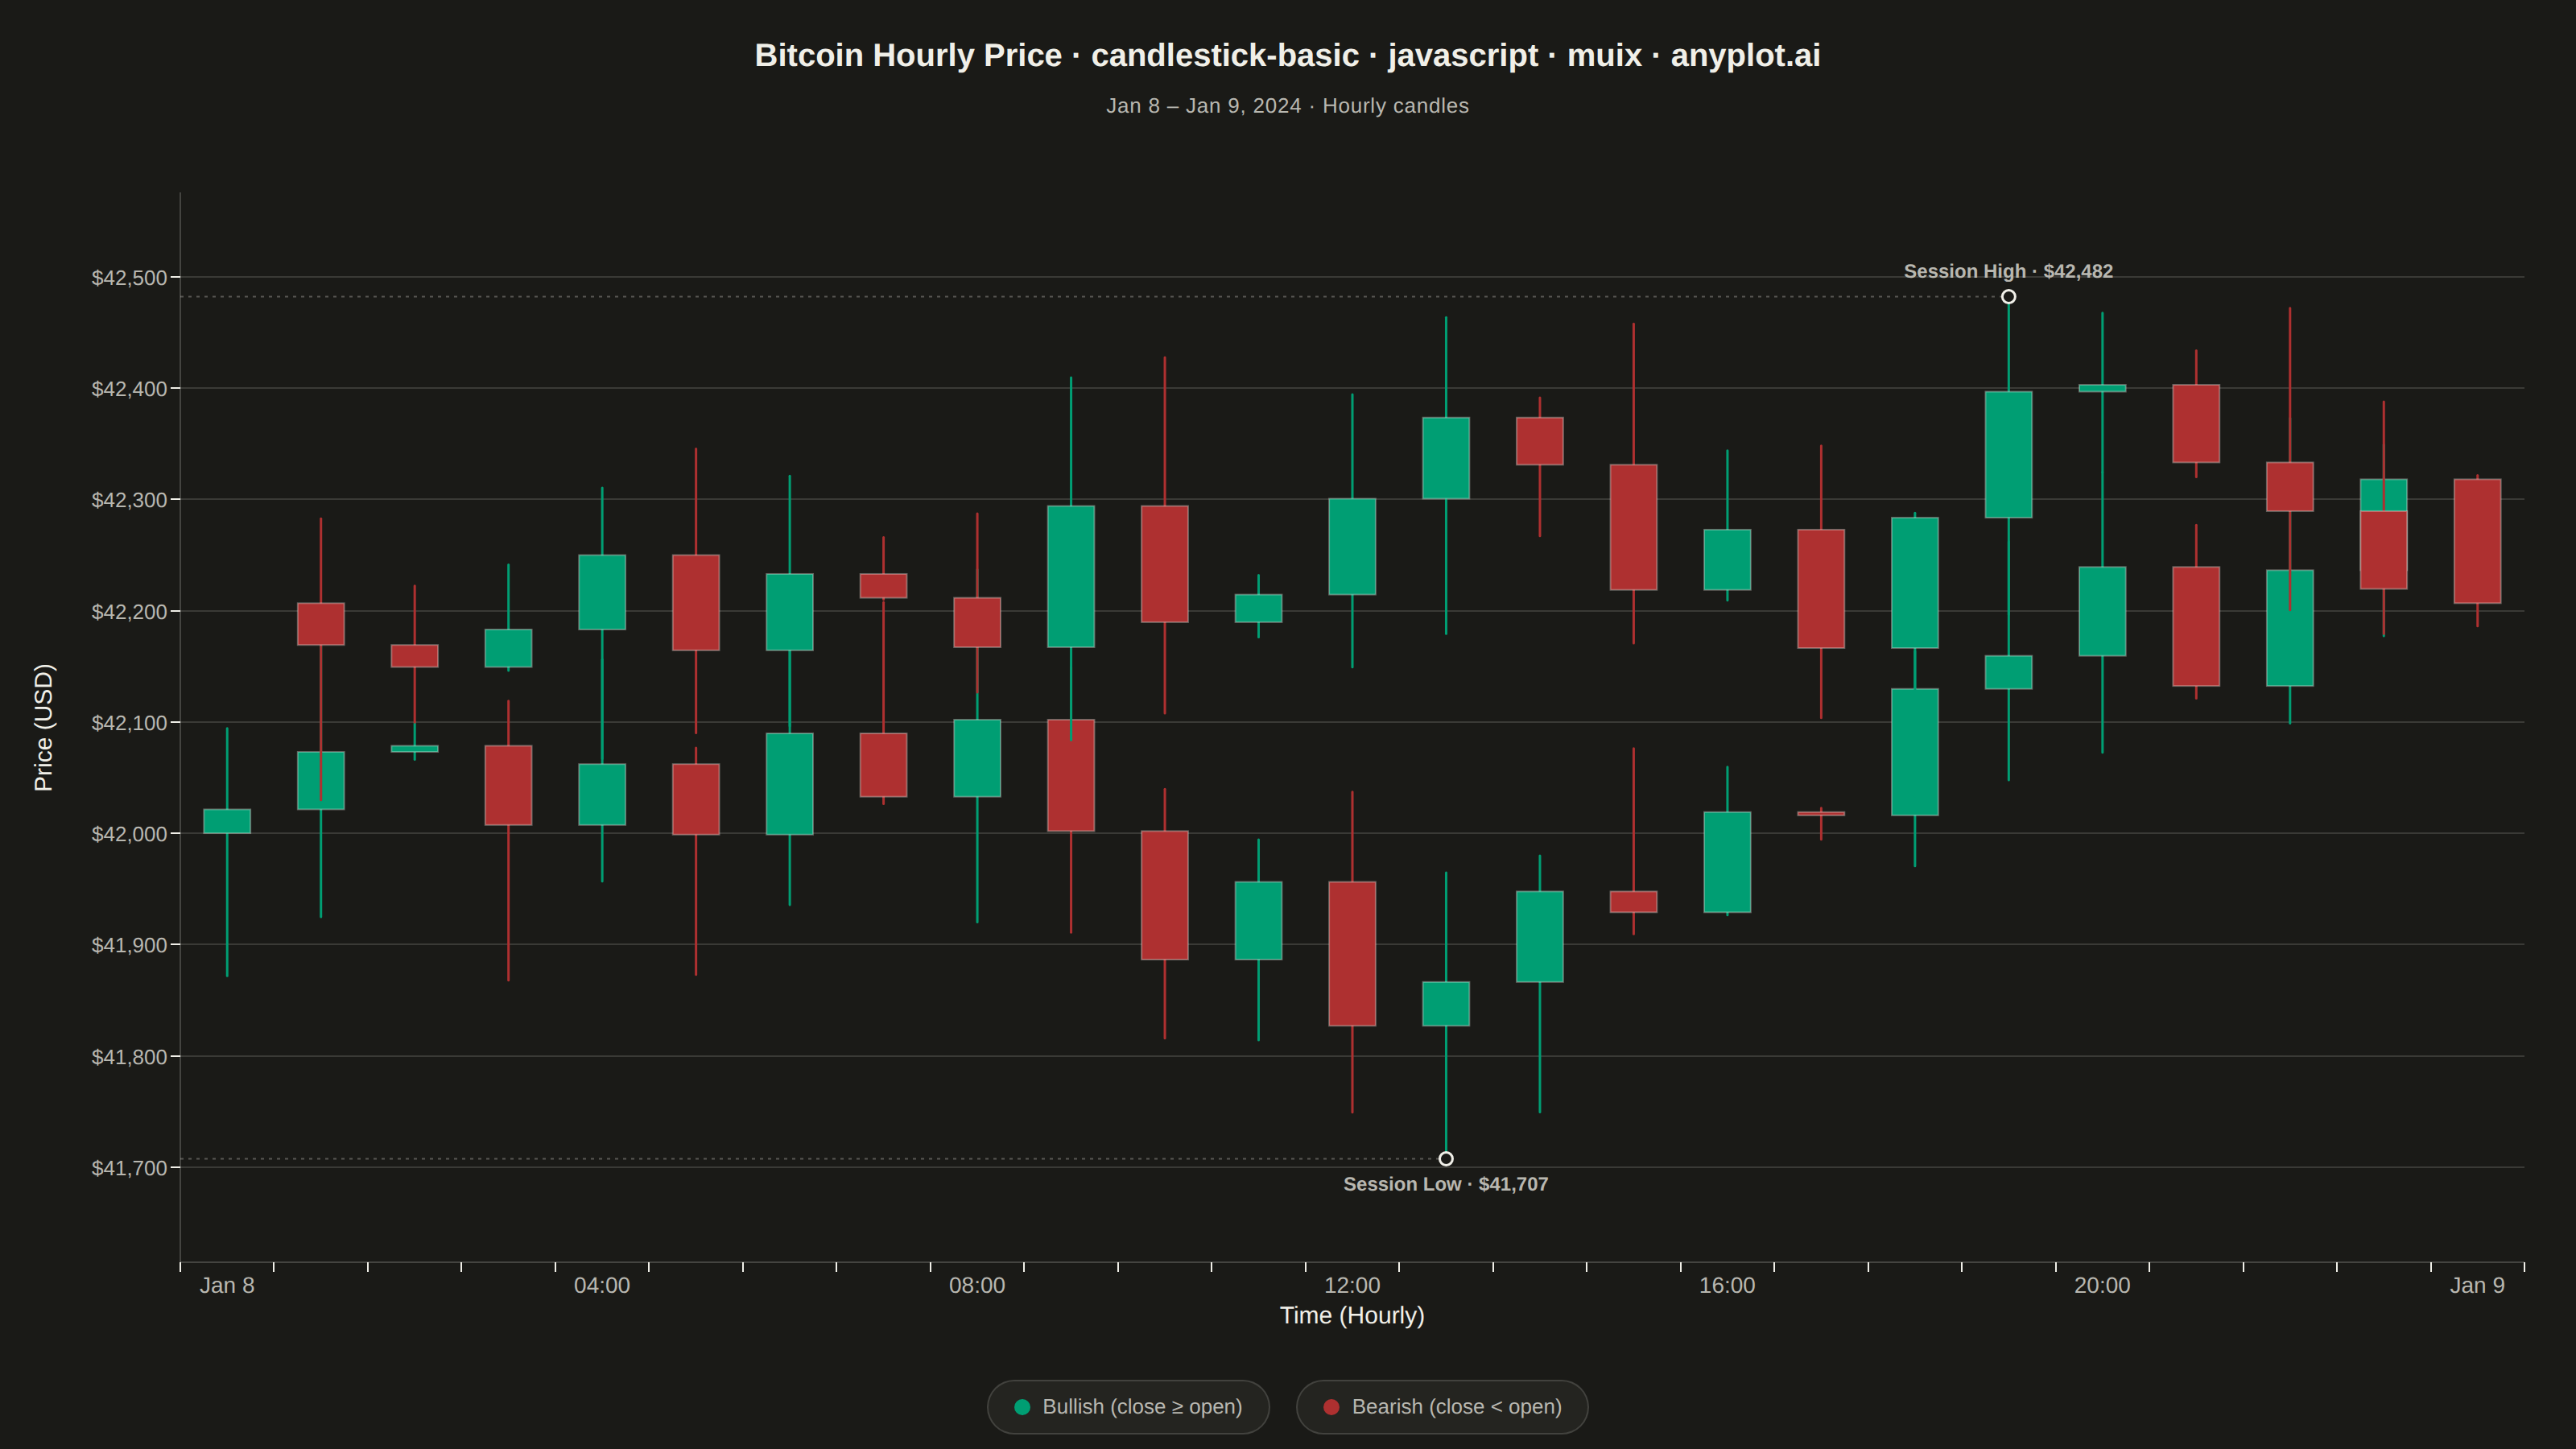
The same plot in 14 other libraries — JavaScript: Chart.js, D3.js, Apache ECharts, Highcharts; Python: Altair, Bokeh, lets-plot, Matplotlib, Plotly, plotnine, Pygal, Seaborn; R: ggplot2; Julia: Makie.jl. Compare all 15 side by side: Basic Candlestick Chart in Python, R, Julia and JavaScript.
A candlestick chart displays open, high, low, and close (OHLC) price data for financial instruments over time. Each candlestick shows the price range within a specific period, with the body indicating the open-close range and the wicks (shadows) showing the high-low range. Color coding distinguishes bullish (price increase) from bearish (price decrease) periods, making it easy to identify trends and price patterns at a glance.
// anyplot.ai
// candlestick-basic: Basic Candlestick Chart
// Library: muix 7.29.1 | JavaScript 22.23.2
// Quality: 87/100 | Created: 2026-08-24
//# anyplot-orientation: landscape
// anyplot.ai
// candlestick-basic: Basic Candlestick Chart
// Library: MUI X Charts | React | Node 22
// License: @mui/x-charts — MIT (community). Pro/Premium are out of scope.
// Quality: pending | Created: 2026-08-24

import { ChartContainer } from "@mui/x-charts/ChartContainer";
import { ChartsXAxis } from "@mui/x-charts/ChartsXAxis";
import { ChartsYAxis } from "@mui/x-charts/ChartsYAxis";
import { ChartsGrid } from "@mui/x-charts/ChartsGrid";
import { useXScale, useYScale } from "@mui/x-charts/hooks";
import Box from "@mui/material/Box";
import Typography from "@mui/material/Typography";

const t = window.ANYPLOT_TOKENS;

// --- Data (in-memory, deterministic LCG PRNG — no fetch, no Math.random) ----
let seed = 42;
function rand() {
  seed = (seed * 1103515245 + 12345) & 0x7fffffff;
  return seed / 0x7fffffff;
}

const PERIODS = 48; // hourly candles across two trading days

const open: number[] = [];
const high: number[] = [];
const low: number[] = [];
const close: number[] = [];
let price = 42000; // BTC/USD opening price
for (let i = 0; i < PERIODS; i++) {
  const o = price;
  const drift = (rand() - 0.5) * 260;
  const c = Math.max(1000, o + drift);
  const h = Math.max(o, c) + rand() * 140;
  const l = Math.max(Math.min(o, c) - rand() * 140, 1);
  open.push(o);
  high.push(h);
  low.push(l);
  close.push(c);
  price = c;
}

// Fixed calendar anchor (deterministic — not the render-time clock). Midnight
// hours get a date label, other hours get a time label, matching the spec's
// "date formatting based on data frequency" guidance for an hourly series.
const START = new Date(2024, 0, 8, 0, 0);
const dateLabels: string[] = [];
for (let i = 0; i < PERIODS; i++) {
  const d = new Date(START);
  d.setHours(d.getHours() + i);
  dateLabels.push(
    d.getHours() === 0
      ? d.toLocaleDateString("en-US", { month: "short", day: "numeric" })
      : d.toLocaleTimeString("en-US", { hour: "2-digit", minute: "2-digit", hour12: false }),
  );
}

const yMin = Math.min(...low);
const yMax = Math.max(...high);
const yPad = (yMax - yMin) * 0.12;

// Session extremes — the focal point the review asked for: call out the
// intraday high/low instead of presenting a uniform, unemphasized series.
let highIdx = 0;
let lowIdx = 0;
for (let i = 1; i < PERIODS; i++) {
  if (high[i] > high[highIdx]) highIdx = i;
  if (low[i] < low[lowIdx]) lowIdx = i;
}
const fmtUsd = (v: number) => `$${Math.round(v).toLocaleString("en-US")}`;
const highCallout = `Session High · ${fmtUsd(high[highIdx])}`;
const lowCallout = `Session Low · ${fmtUsd(low[lowIdx])}`;

// --- Candlesticks: MUI X community has no native candlestick series — draw
// against the shared band scale via useXScale/useYScale, the documented
// ChartContainer composition pattern for chart types outside the community
// surface. Bullish (close >= open) bodies are brand green, bearish bodies
// matte red — the finance up/down semantic exception from the style guide.
// Wick strokes stay well under the body width so the range line reads as
// subordinate to the open/close body, per the spec's legibility note. A thin
// ink-color stroke on every body is the style guide's "optional outline
// pattern" — redundant contrast for CVD readers beyond hue alone.
function Candlesticks() {
  const xScale = useXScale("x") as any;
  const yScale = useYScale("y") as any;
  if (!xScale || !yScale) return null;
  const bw = xScale.bandwidth();
  const bodyWidth = bw * 0.62;
  const [xRangeStart] = xScale.range();

  const highCx = xScale(dateLabels[highIdx]) + bw / 2;
  const highCy = yScale(high[highIdx]);
  const lowCx = xScale(dateLabels[lowIdx]) + bw / 2;
  const lowCy = yScale(low[lowIdx]);

  return (
    <g>
      {dateLabels.map((label, i) => {
        const cx = xScale(label) + bw / 2;
        const bullish = close[i] >= open[i];
        const color = bullish ? t.palette[0] : t.palette[4];
        const yOpen = yScale(open[i]);
        const yClose = yScale(close[i]);
        const bodyTop = Math.min(yOpen, yClose);
        const bodyHeight = Math.max(Math.abs(yClose - yOpen), 1.5);
        return (
          <g key={i}>
            <line
              x1={cx}
              x2={cx}
              y1={yScale(high[i])}
              y2={yScale(low[i])}
              stroke={color}
              strokeWidth={1.5}
              strokeLinecap="round"
            />
            <rect
              x={cx - bodyWidth / 2}
              y={bodyTop}
              width={bodyWidth}
              height={bodyHeight}
              fill={color}
              stroke={t.ink}
              strokeOpacity={0.35}
              strokeWidth={1}
            />
          </g>
        );
      })}

      {/* Focal-point callouts: dashed reference lines + labels pin the
          session high and low, giving the series a deliberate story beyond
          a uniform OHLC run. */}
      <line
        x1={xRangeStart}
        x2={highCx}
        y1={highCy}
        y2={highCy}
        stroke={t.inkSoft}
        strokeOpacity={0.4}
        strokeWidth={1}
        strokeDasharray="2 3"
      />
      <circle cx={highCx} cy={highCy} r={4} fill={t.pageBg} stroke={t.ink} strokeWidth={1.5} />
      <text x={highCx} y={highCy - 12} textAnchor="middle" fontSize={12} fontWeight={600} fill={t.inkSoft}>
        {highCallout}
      </text>

      <line
        x1={xRangeStart}
        x2={lowCx}
        y1={lowCy}
        y2={lowCy}
        stroke={t.inkSoft}
        strokeOpacity={0.4}
        strokeWidth={1}
        strokeDasharray="2 3"
      />
      <circle cx={lowCx} cy={lowCy} r={4} fill={t.pageBg} stroke={t.ink} strokeWidth={1.5} />
      <text x={lowCx} y={lowCy + 20} textAnchor="middle" fontSize={12} fontWeight={600} fill={t.inkSoft}>
        {lowCallout}
      </text>
    </g>
  );
}

export default function Chart() {
  const W = window.ANYPLOT_SIZE.width;
  const H = window.ANYPLOT_SIZE.height;
  const TITLE_H = 96;
  const LEGEND_H = 52;
  const chartH = H - TITLE_H - LEGEND_H;

  const title = "Bitcoin Hourly Price · candlestick-basic · javascript · muix · anyplot.ai";
  const titleSize = title.length > 67 ? Math.round((22 * 67) / title.length) : 22;

  const rangeEnd = new Date(START);
  rangeEnd.setHours(rangeEnd.getHours() + PERIODS - 1);
  const subtitle = `${START.toLocaleDateString("en-US", { month: "short", day: "numeric" })} – ${rangeEnd.toLocaleDateString(
    "en-US",
    { month: "short", day: "numeric", year: "numeric" },
  )} · Hourly candles`;

  const legendItems = [
    { label: "Bullish (close ≥ open)", color: t.palette[0] },
    { label: "Bearish (close < open)", color: t.palette[4] },
  ];

  return (
    <Box
      sx={{
        width: W,
        height: H,
        bgcolor: t.pageBg,
        display: "flex",
        flexDirection: "column",
        fontFamily: "'Roboto', 'Helvetica Neue', Arial, sans-serif",
        boxSizing: "border-box",
      }}
    >
      <Box
        sx={{
          height: TITLE_H,
          display: "flex",
          flexDirection: "column",
          alignItems: "center",
          justifyContent: "center",
          gap: "6px",
        }}
      >
        <Typography sx={{ color: t.ink, fontSize: titleSize, fontWeight: 600 }}>{title}</Typography>
        <Typography sx={{ color: t.inkSoft, fontSize: 13, fontWeight: 400, letterSpacing: "0.03em" }}>
          {subtitle}
        </Typography>
      </Box>

      <ChartContainer
        width={W}
        height={chartH}
        skipAnimation
        series={[]}
        xAxis={[
          {
            id: "x",
            scaleType: "band",
            data: dateLabels,
            label: "Time (Hourly)",
            tickLabelInterval: (_value: string, index: number) => index % 4 === 0,
            tickLabelStyle: { fontSize: 14, fill: t.inkSoft },
            labelStyle: { fontSize: 15, fill: t.ink },
          },
        ]}
        yAxis={[
          {
            id: "y",
            min: yMin - yPad,
            max: yMax + yPad,
            label: "Price (USD)",
            valueFormatter: (v: number) => `$${Math.round(v).toLocaleString("en-US")}`,
            tickLabelStyle: { fontSize: 13, fill: t.inkSoft },
            labelStyle: { fontSize: 15, fill: t.ink },
          },
        ]}
        margin={{ top: 24, bottom: 64, left: 112, right: 32 }}
        sx={{
          "& .MuiChartsAxis-line": { stroke: t.inkSoft, strokeOpacity: 0.2 },
          "& .MuiChartsGrid-line": { stroke: t.grid },
        }}
      >
        <ChartsGrid horizontal />
        <Candlesticks />
        <ChartsXAxis axisId="x" />
        <ChartsYAxis axisId="y" slotProps={{ axisLabel: { x: -80 } }} />
      </ChartContainer>

      <Box sx={{ height: LEGEND_H, display: "flex", alignItems: "center", justifyContent: "center", gap: "16px" }}>
        {legendItems.map((item) => (
          <Box
            key={item.label}
            sx={{
              display: "flex",
              alignItems: "center",
              gap: "8px",
              padding: "6px 16px",
              borderRadius: "999px",
              border: `1px solid ${t.grid}`,
              bgcolor: t.elevatedBg,
            }}
          >
            <Box sx={{ width: 10, height: 10, borderRadius: "50%", bgcolor: item.color }} />
            <Typography sx={{ color: t.inkSoft, fontSize: 13, fontWeight: 500 }}>{item.label}</Typography>
          </Box>
        ))}
      </Box>
    </Box>
  );
}
Runnable source as JSON, for any HTTP client: https://api.anyplot.ai/specs/candlestick-basic/muix/code. Any spec id and library id listed in llms-full.txt fit the same URL shape; every URL below is complete and callable.
{
  "spec_id": "candlestick-basic",
  "language": "javascript",
  "library": "muix",
  "page": "https://anyplot.ai/candlestick-basic/javascript/muix",
  "hub": "https://anyplot.ai/candlestick-basic",
  "code_json": "https://api.anyplot.ai/specs/candlestick-basic/muix/code",
  "spec_json": "https://api.anyplot.ai/specs/candlestick-basic",
  "render_light_png": "https://storage.googleapis.com/anyplot-images/plots/candlestick-basic/javascript/muix/plot-light.png",
  "render_dark_png": "https://storage.googleapis.com/anyplot-images/plots/candlestick-basic/javascript/muix/plot-dark.png",
  "interactive_light_html": "https://storage.googleapis.com/anyplot-images/plots/candlestick-basic/javascript/muix/plot-light.html",
  "interactive_dark_html": "https://storage.googleapis.com/anyplot-images/plots/candlestick-basic/javascript/muix/plot-dark.html",
  "quality_score": 87.0,
  "license": "MIT",
  "guide": "https://anyplot.ai/llms.txt"
}
Part of Basic Candlestick Chart on anyplot.ai.