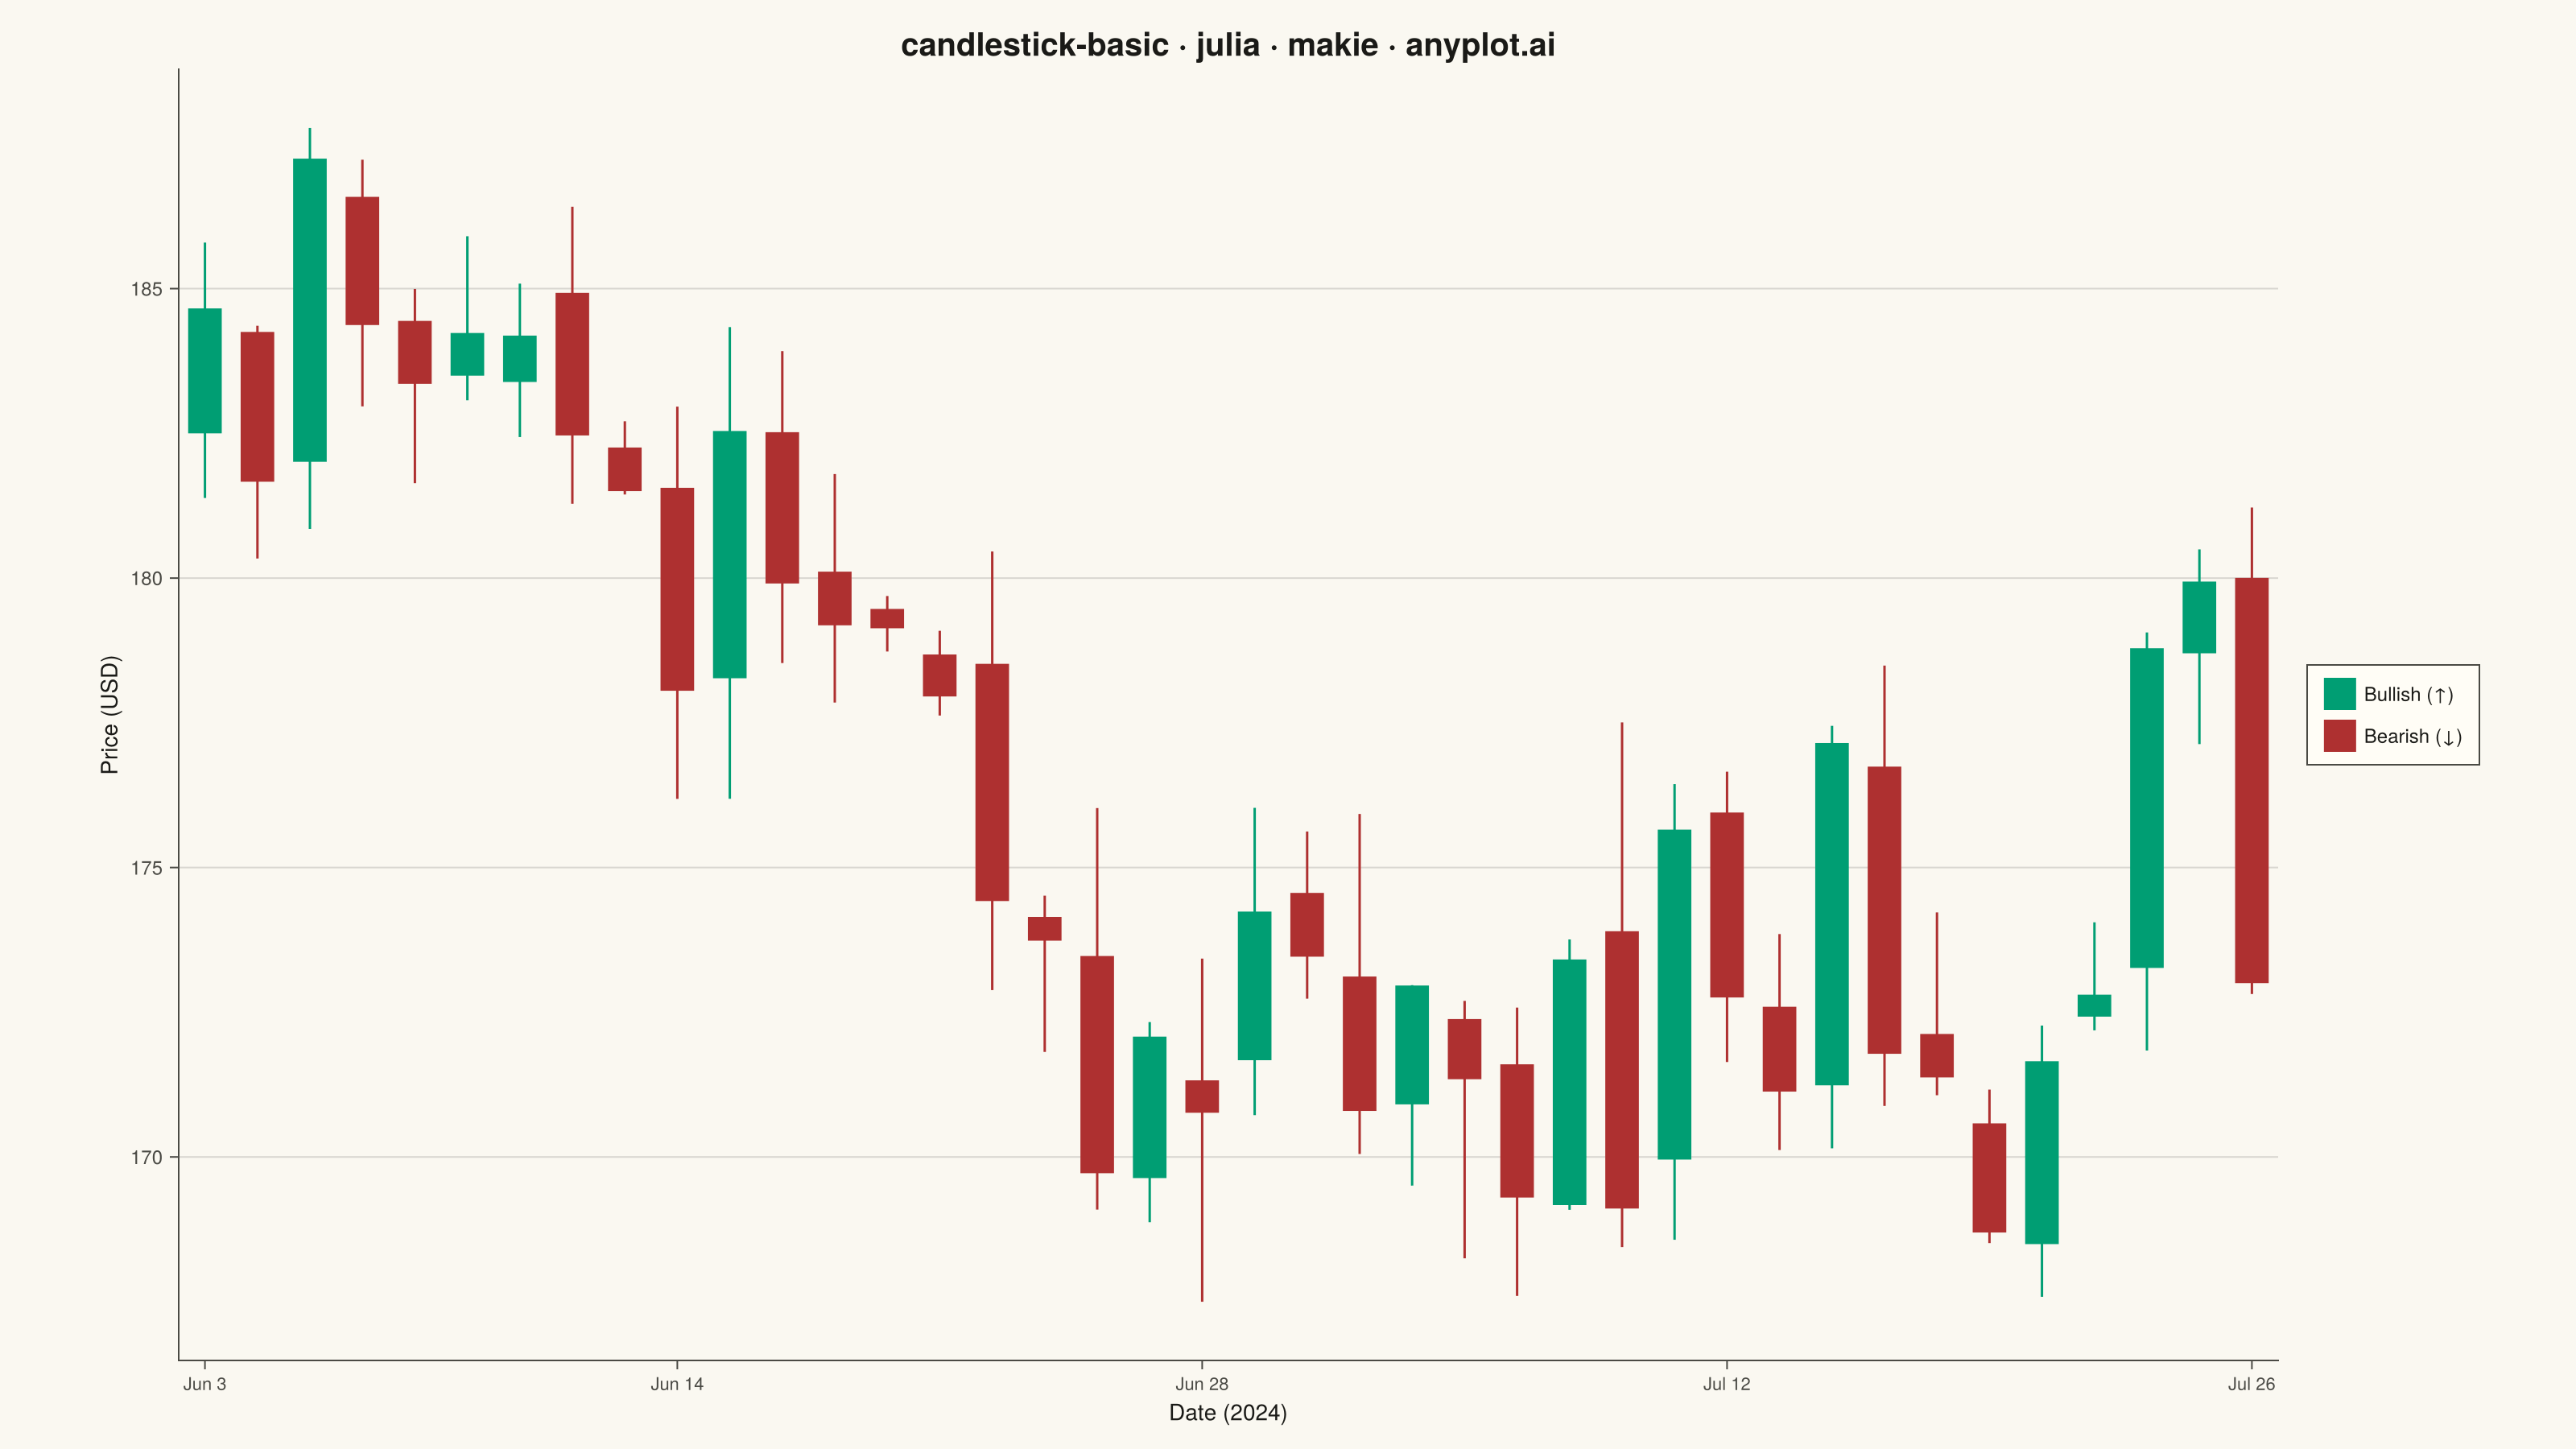
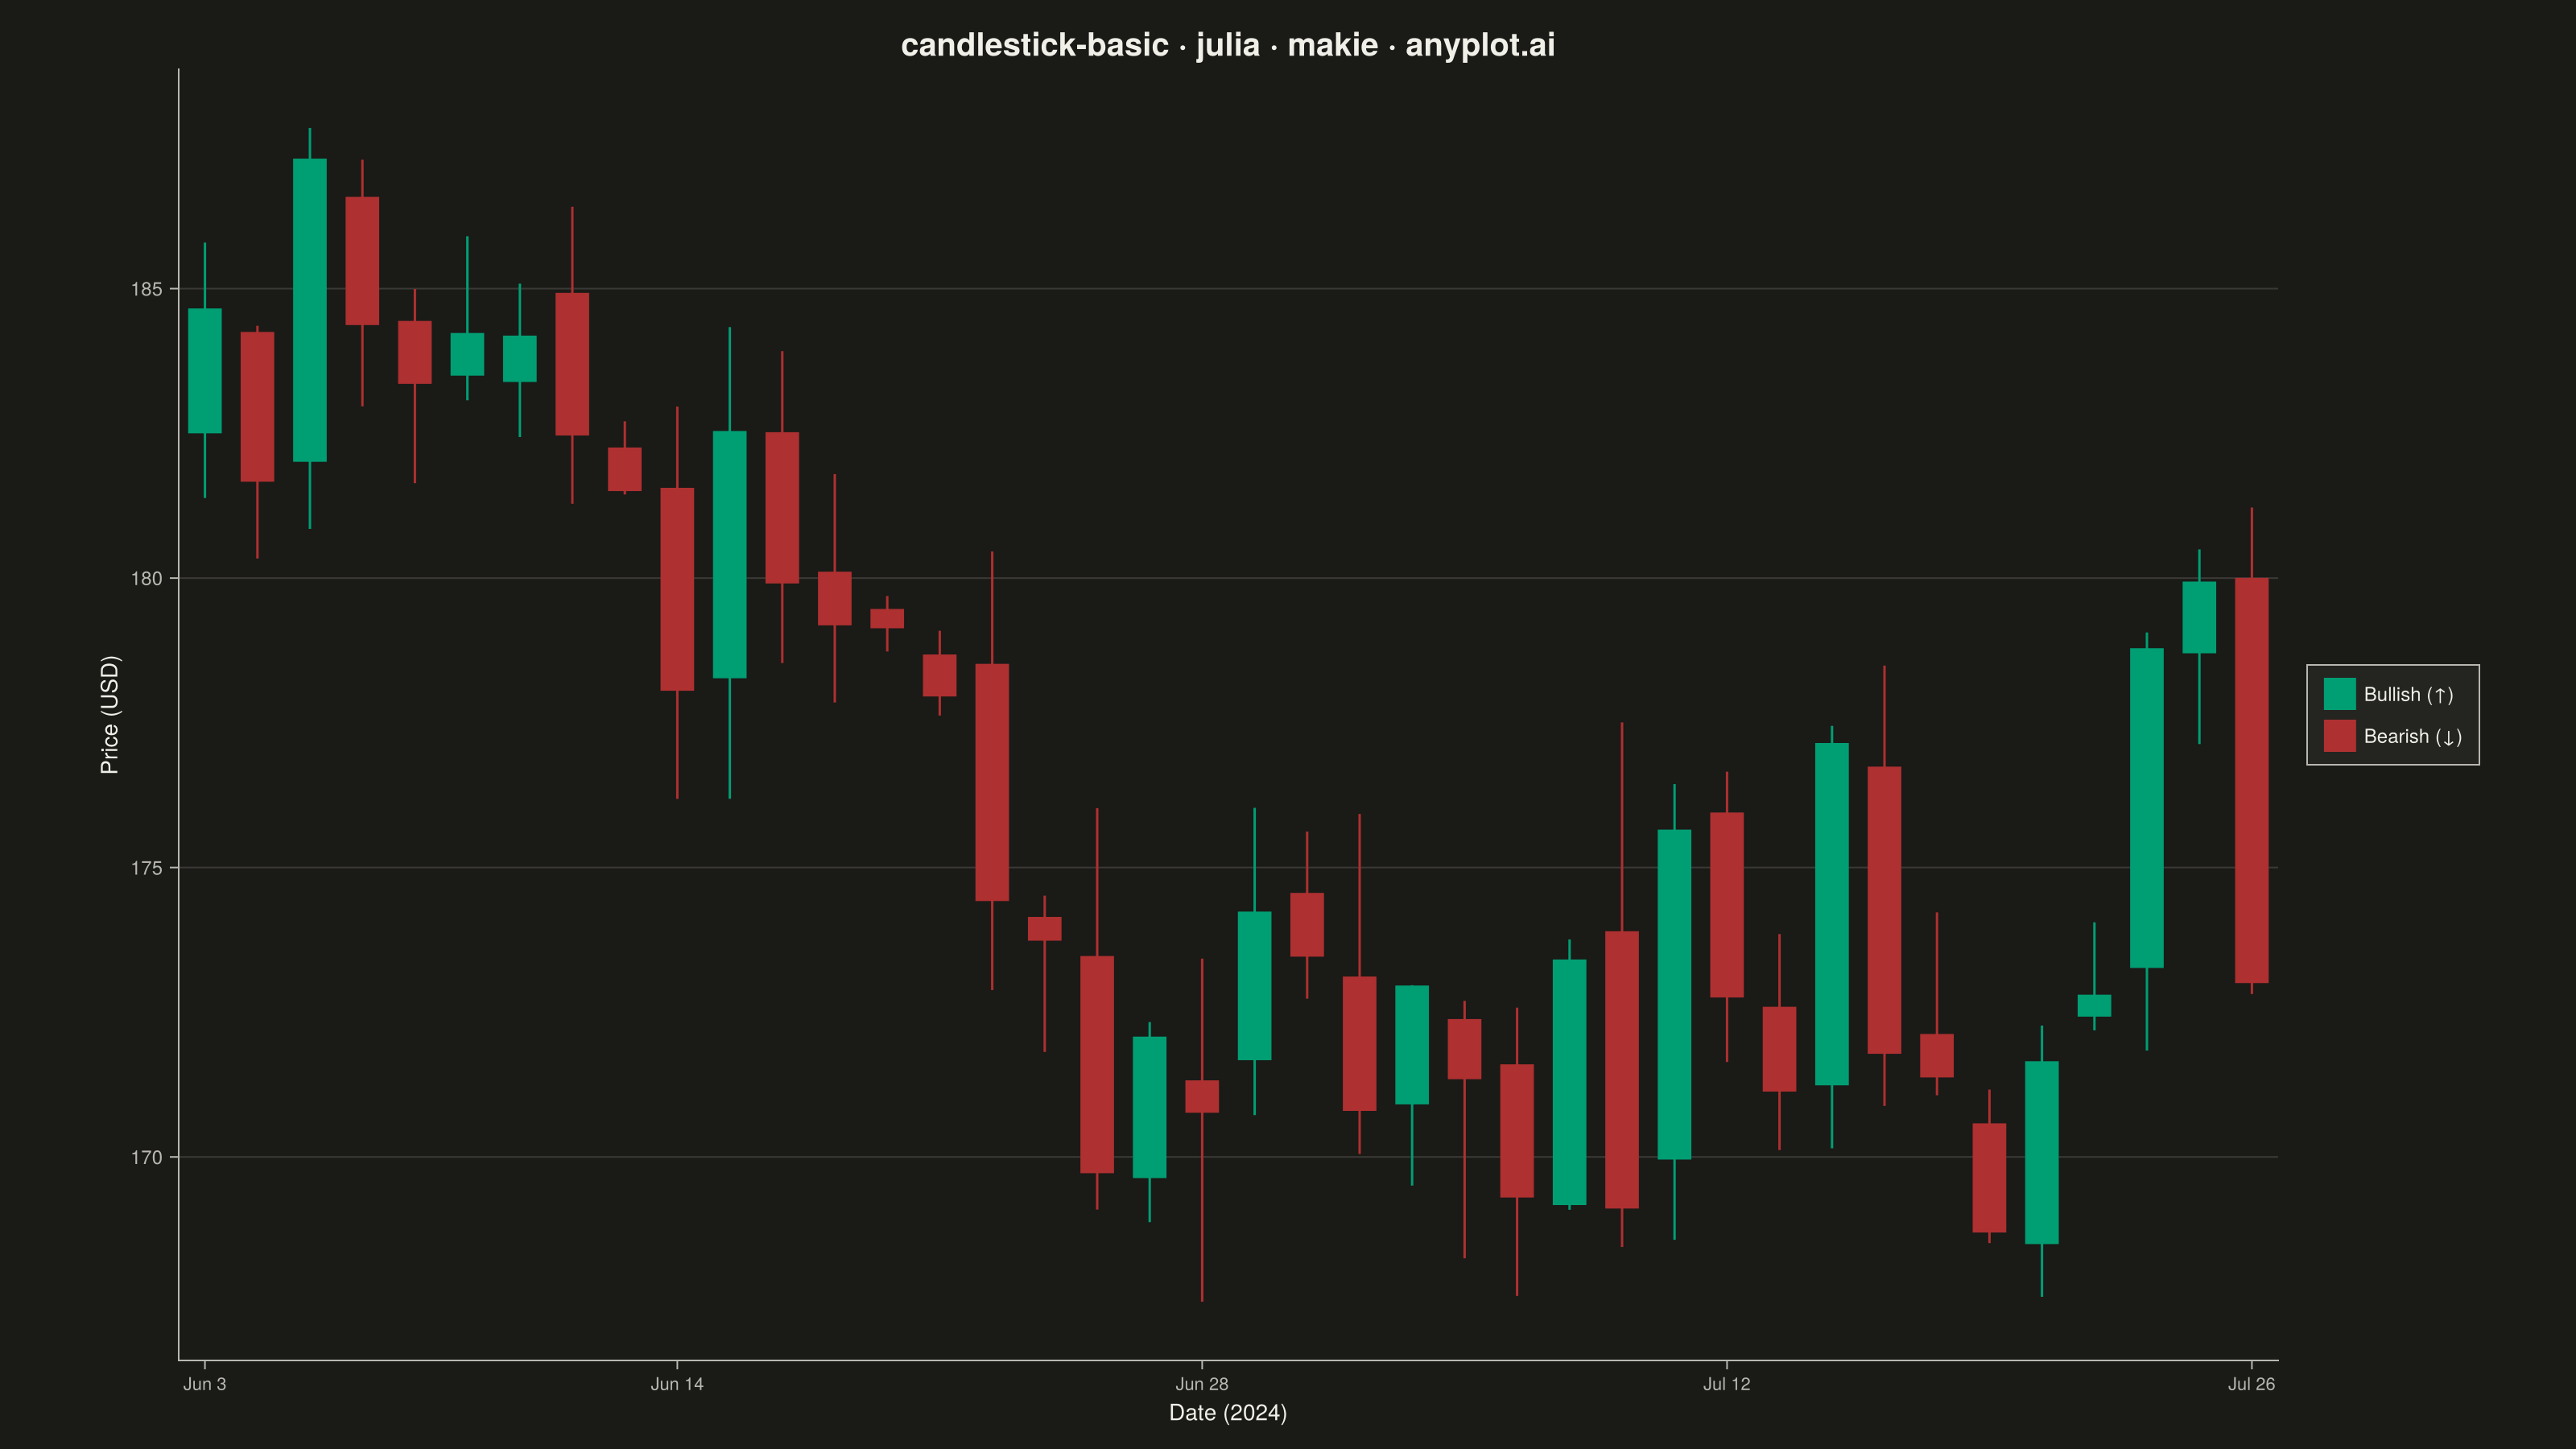
The same plot in 14 other libraries — Python: Altair, Bokeh, lets-plot, Matplotlib, Plotly, plotnine, Pygal, Seaborn; R: ggplot2; JavaScript: Chart.js, D3.js, Apache ECharts, Highcharts, MUI X Charts. Compare all 15 side by side: Basic Candlestick Chart in Python, R, Julia and JavaScript.
A candlestick chart displays open, high, low, and close (OHLC) price data for financial instruments over time. Each candlestick shows the price range within a specific period, with the body indicating the open-close range and the wicks (shadows) showing the high-low range. Color coding distinguishes bullish (price increase) from bearish (price decrease) periods, making it easy to identify trends and price patterns at a glance.
# anyplot.ai
# candlestick-basic: Basic Candlestick Chart
# Library: makie 0.22.10 | Julia 1.11.9
# Quality: 89/100 | Created: 2026-05-30

using CairoMakie
using Makie
using Colors
using Random
using Dates
using Statistics

Random.seed!(42)

const THEME       = get(ENV, "ANYPLOT_THEME", "light")
const PAGE_BG     = THEME == "light" ? colorant"#FAF8F1" : colorant"#1A1A17"
const ELEVATED_BG = THEME == "light" ? colorant"#FFFDF6" : colorant"#242420"
const INK         = THEME == "light" ? colorant"#1A1A17" : colorant"#F0EFE8"
const INK_SOFT    = THEME == "light" ? colorant"#4A4A44" : colorant"#B8B7B0"

# Semantic colors: finance convention — green for gains, red for losses
const BULL_COLOR = colorant"#009E73"  # Imprint position 1 — bullish / price up
const BEAR_COLOR = colorant"#AE3030"  # Imprint position 5, semantic anchor: loss/down
const SMA_COLOR  = colorant"#2ABCCD"  # Imprint position 6 — cyan for trend overlay

# Data: 40 trading days of tech stock OHLC
n = 40
start_price = 182.50

opens  = zeros(n)
closes = zeros(n)
highs  = zeros(n)
lows   = zeros(n)

opens[1]  = start_price
closes[1] = start_price * (1.0 + 0.015 * randn())
highs[1]  = max(opens[1], closes[1]) * (1.0 + 0.007 * abs(randn()))
lows[1]   = min(opens[1], closes[1]) * (1.0 - 0.007 * abs(randn()))

for i in 2:n
    opens[i]  = closes[i-1] * (1.0 + 0.003 * randn())
    closes[i] = opens[i] * (1.0 + 0.020 * randn())
    highs[i]  = max(opens[i], closes[i]) * (1.0 + 0.008 * abs(randn()))
    lows[i]   = min(opens[i], closes[i]) * (1.0 - 0.008 * abs(randn()))
end

is_bull     = closes .>= opens
body_colors = [is_bull[i] ? BULL_COLOR : BEAR_COLOR for i in 1:n]

# 10-day SMA — creates a narrative focal point and trend context
sma_window = 10
sma = [i < sma_window ? NaN : mean(closes[i-sma_window+1:i]) for i in 1:n]
sma_valid_idx = findall(!isnan, sma)

# Date labels for x-axis ticks
start_date    = Date(2024, 6, 3)
trading_dates = filter(x -> dayofweek(x) <= 5,
    [start_date + Day(k) for k in 0:80])[1:n]

tick_idx    = [1, 10, 20, 30, n]
tick_labels = [string(Dates.monthabbr(Dates.month(trading_dates[i])), " ",
               Dates.day(trading_dates[i])) for i in tick_idx]

# Figure
fig = Figure(
    size            = (1600, 900),
    fontsize        = 14,
    backgroundcolor = PAGE_BG,
)

ax = Axis(
    fig[1, 1];
    title             = "candlestick-basic · julia · makie · anyplot.ai",
    titlesize         = 20,
    titlecolor        = INK,
    titlegap          = 12,
    xlabel            = "Date (2024)",
    ylabel            = "Price (USD)",
    xlabelsize        = 14,
    ylabelsize        = 14,
    xlabelcolor       = INK,
    ylabelcolor       = INK,
    xticklabelsize    = 11,
    yticklabelsize    = 12,
    xticklabelcolor   = INK_SOFT,
    yticklabelcolor   = INK_SOFT,
    xtickcolor        = INK_SOFT,
    ytickcolor        = INK_SOFT,
    xticksize         = 0,
    yticksize         = 0,
    backgroundcolor   = PAGE_BG,
    topspinevisible   = false,
    rightspinevisible = false,
    leftspinecolor    = INK_SOFT,
    bottomspinecolor  = INK_SOFT,
    xticks            = (tick_idx, tick_labels),
    xgridvisible      = false,
    ygridvisible      = true,
    ygridcolor        = RGBAf(INK.r, INK.g, INK.b, 0.15),
    yminorgridvisible = false,
    xminorgridvisible = false,
)

xlims!(ax, 0.5, n + 0.5)

xs = collect(1:n)

# Wicks: thin vertical lines spanning low to high
rangebars!(ax, xs, lows, highs;
    color        = body_colors,
    linewidth    = 1.5,
    whiskerwidth = 0,
)

# Bodies: filled rectangles with thin CVD-friendly outline for deuteranopia robustness
half_w       = 0.32
body_bottoms = [min(opens[i], closes[i]) for i in 1:n]
body_heights = [max(abs(closes[i] - opens[i]), 0.05) for i in 1:n]
body_rects   = [Rect2f(i - half_w, body_bottoms[i], 2 * half_w, body_heights[i]) for i in 1:n]
poly!(ax, body_rects;
    color       = body_colors,
    strokewidth = 0.5,
    strokecolor = RGBAf(INK.r, INK.g, INK.b, 0.3),
)

# 10-day SMA trend line in Imprint cyan — provides visual hierarchy and price context
lines!(ax, sma_valid_idx, sma[sma_valid_idx];
    color     = SMA_COLOR,
    linewidth = 2.0,
)

# Legend
elem_bull = PolyElement(
    color       = BULL_COLOR,
    strokecolor = RGBAf(INK.r, INK.g, INK.b, 0.3),
    strokewidth = 0.5,
)
elem_bear = PolyElement(
    color       = BEAR_COLOR,
    strokecolor = RGBAf(INK.r, INK.g, INK.b, 0.3),
    strokewidth = 0.5,
)
elem_sma = LineElement(color = SMA_COLOR, linewidth = 2.0)
Legend(
    fig[1, 2],
    [elem_bull, elem_bear, elem_sma],
    ["Bullish (↑)", "Bearish (↓)", "SMA (10)"];
    framevisible    = false,
    backgroundcolor = ELEVATED_BG,
    labelcolor      = INK,
    labelsize       = 12,
    padding         = (10, 10, 8, 8),
    rowgap          = 6,
)

colsize!(fig.layout, 1, Relative(0.87))

save("plot-$(THEME).png", fig; px_per_unit = 2)
Runnable source as JSON, for any HTTP client: https://api.anyplot.ai/specs/candlestick-basic/makie/code. Any spec id and library id listed in llms-full.txt fit the same URL shape; every URL below is complete and callable.
{
  "spec_id": "candlestick-basic",
  "language": "julia",
  "library": "makie",
  "page": "https://anyplot.ai/candlestick-basic/julia/makie",
  "hub": "https://anyplot.ai/candlestick-basic",
  "code_json": "https://api.anyplot.ai/specs/candlestick-basic/makie/code",
  "spec_json": "https://api.anyplot.ai/specs/candlestick-basic",
  "render_light_png": "https://storage.googleapis.com/anyplot-images/plots/candlestick-basic/julia/makie/plot-light.png",
  "render_dark_png": "https://storage.googleapis.com/anyplot-images/plots/candlestick-basic/julia/makie/plot-dark.png",
  "quality_score": 89.0,
  "license": "MIT",
  "guide": "https://anyplot.ai/llms.txt"
}
Part of Basic Candlestick Chart on anyplot.ai.