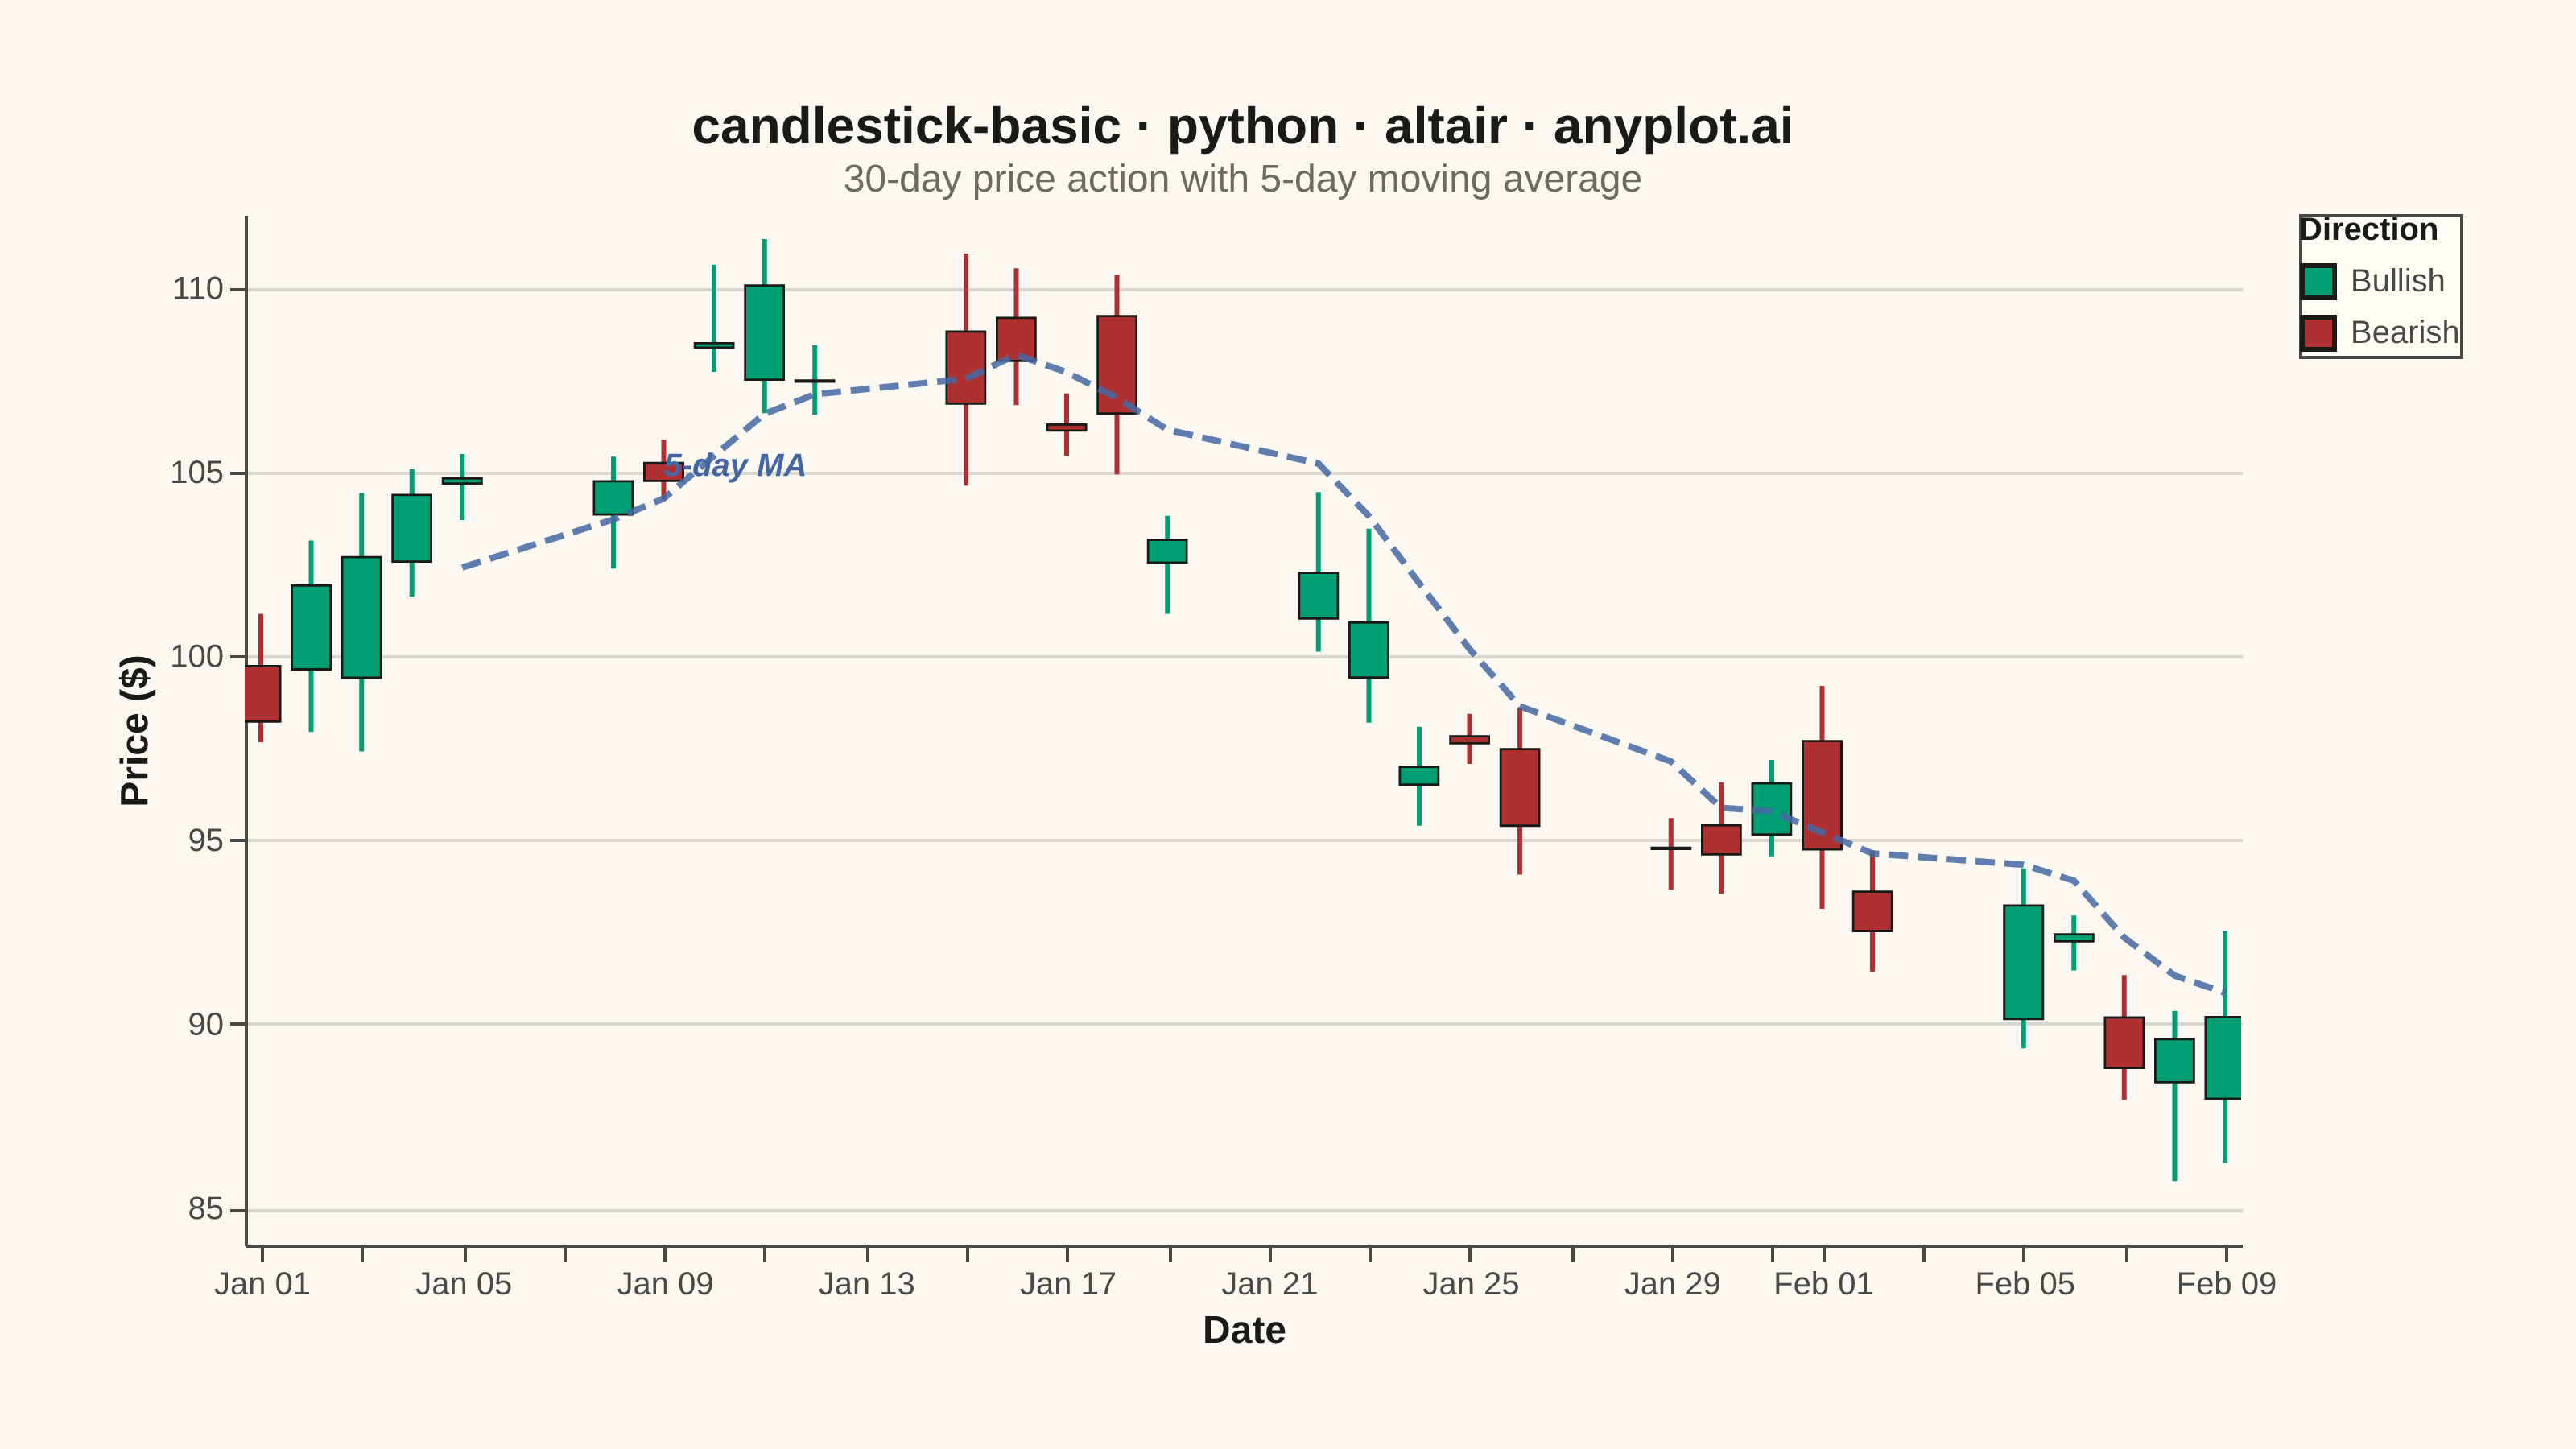
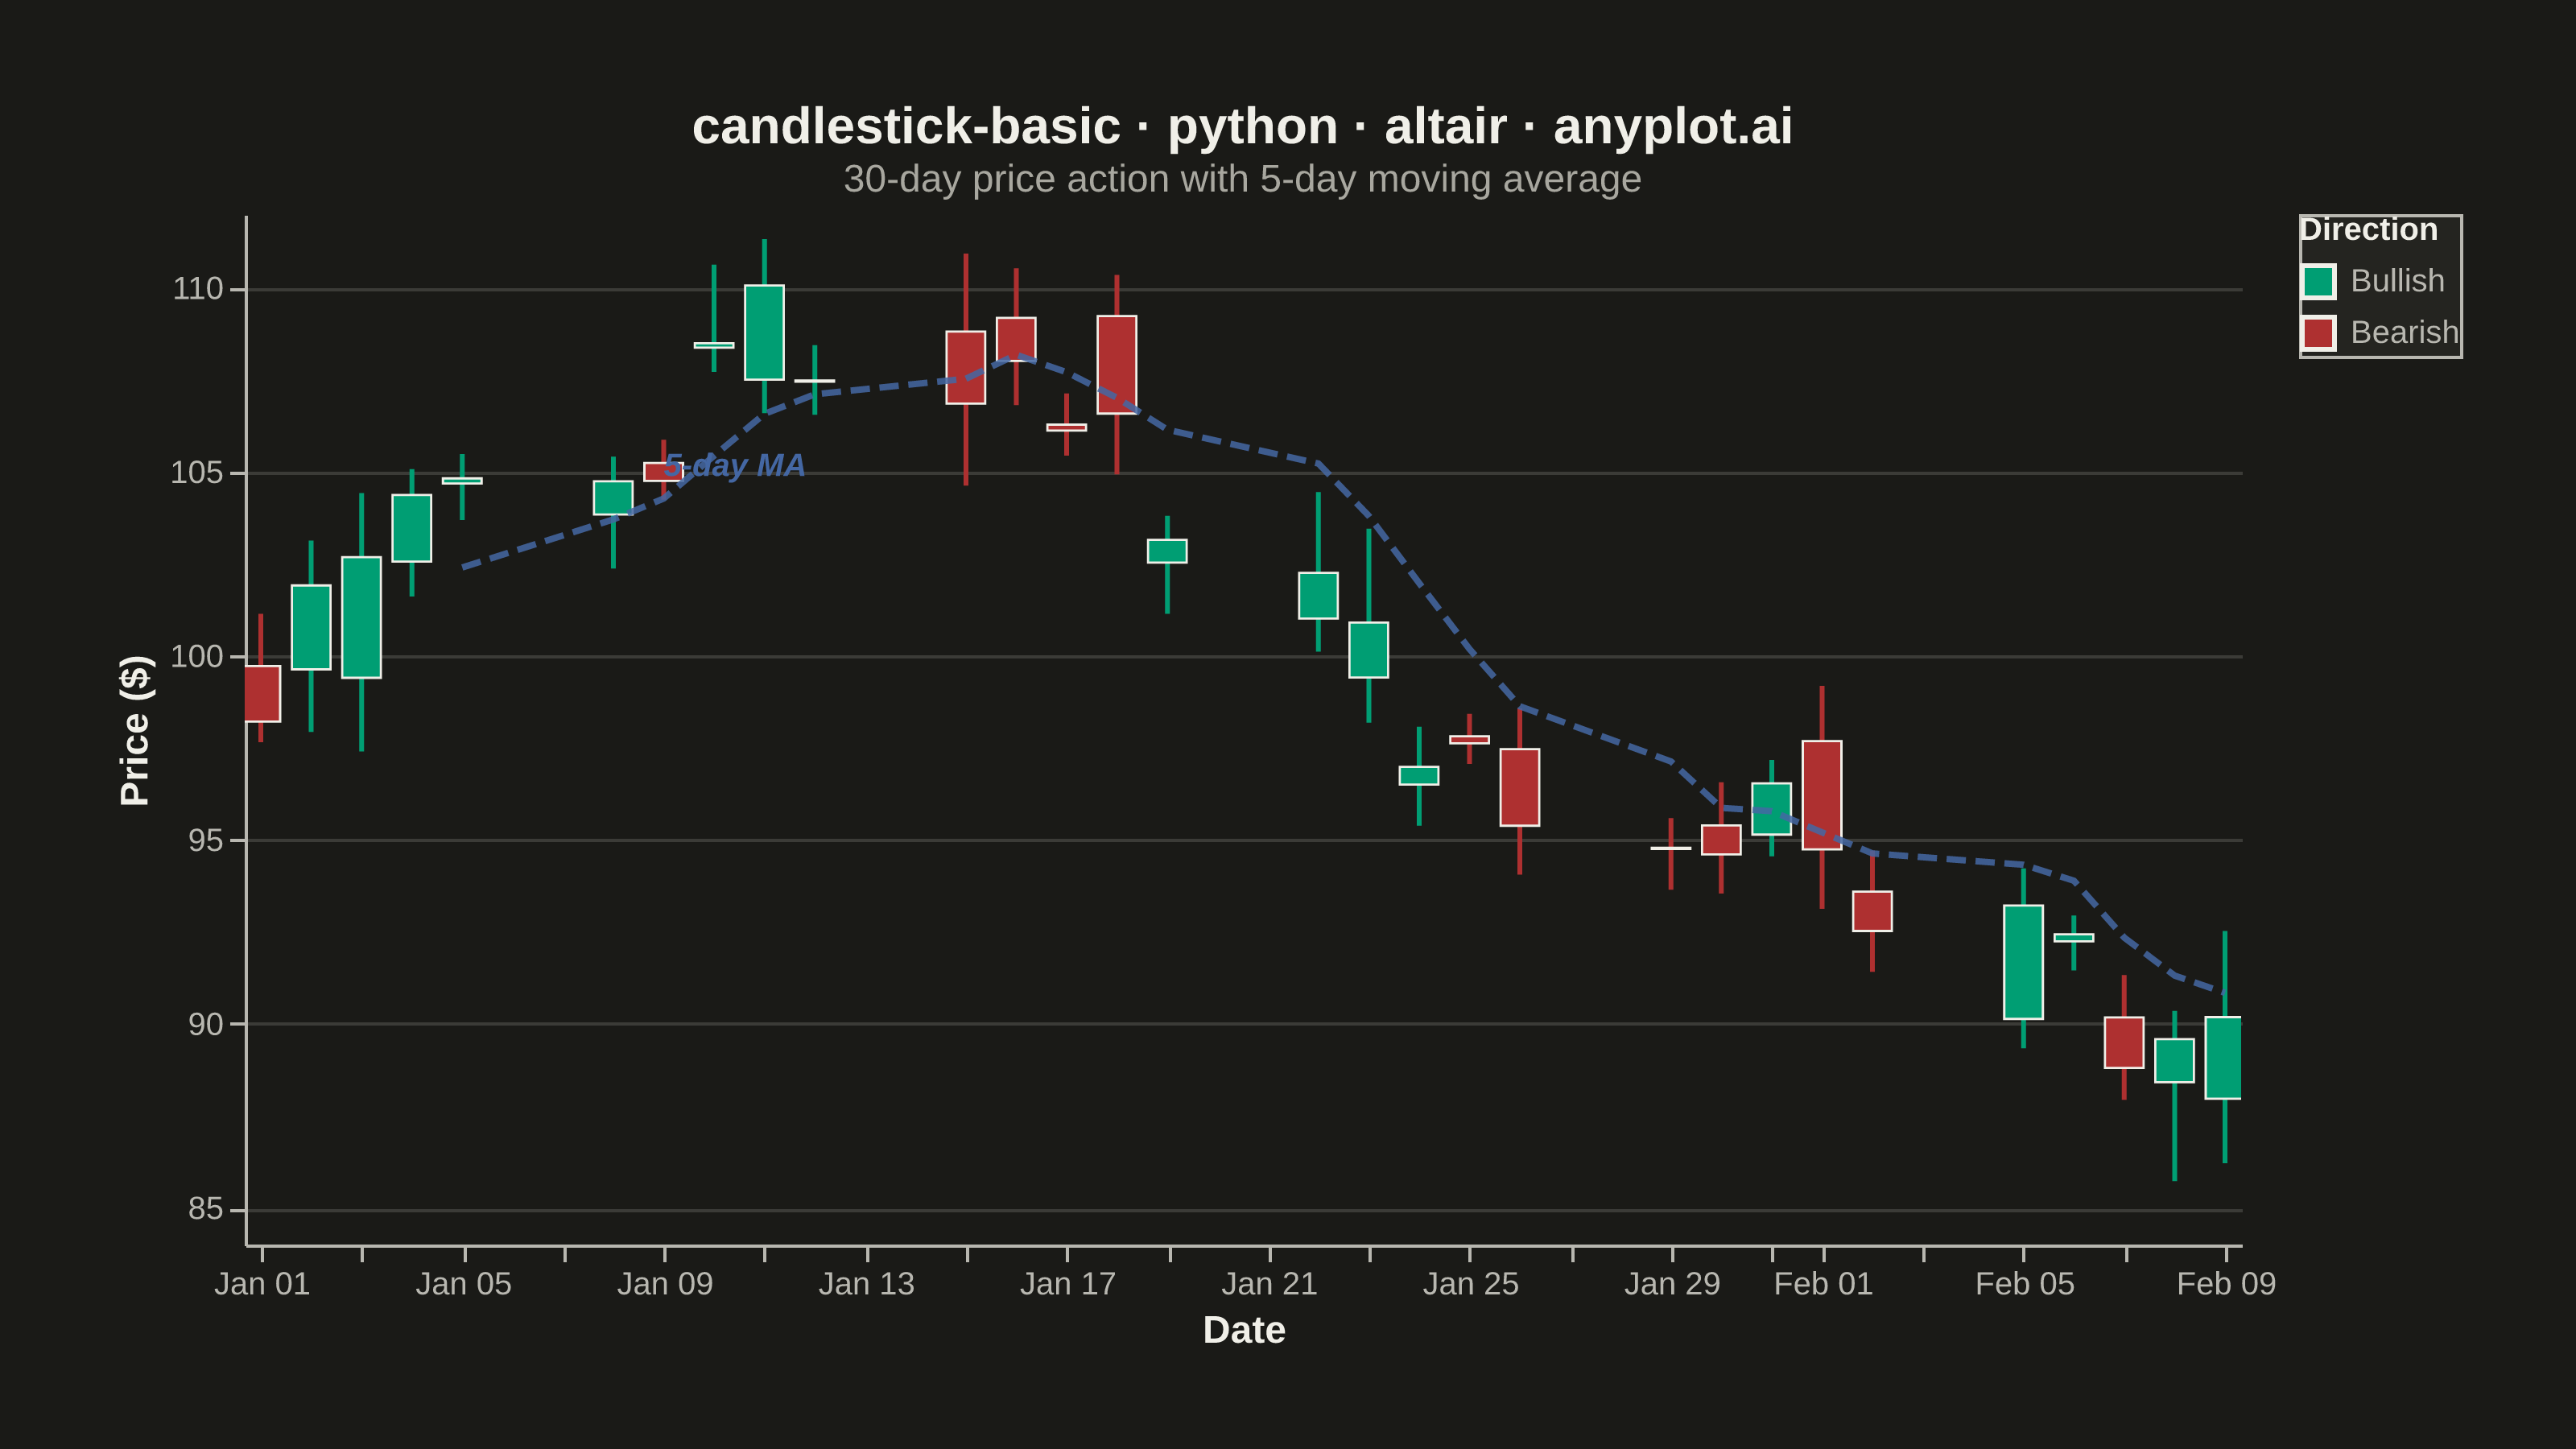
A candlestick chart displays open, high, low, and close (OHLC) price data for financial instruments over time. Each candlestick shows the price range within a specific period, with the body indicating the open-close range and the wicks (shadows) showing the high-low range. Color coding distinguishes bullish (price increase) from bearish (price decrease) periods, making it easy to identify trends and price patterns at a glance.
""" anyplot.ai
candlestick-basic: Basic Candlestick Chart
Library: altair 6.1.0 | Python 3.13.13
Quality: 87/100 | Updated: 2026-05-30
"""

import os
import sys


# Remove the script's own directory from sys.path so `import altair` finds the
# installed package, not this file (which is named altair.py).
_this_dir = os.path.dirname(os.path.abspath(__file__))
sys.path = [p for p in sys.path if p and os.path.abspath(p) != _this_dir]

import altair as alt
import numpy as np
import pandas as pd
from PIL import Image


THEME = os.getenv("ANYPLOT_THEME", "light")

# Theme-adaptive chrome tokens (Imprint palette style guide)
PAGE_BG = "#FAF8F1" if THEME == "light" else "#1A1A17"
ELEVATED_BG = "#FFFDF6" if THEME == "light" else "#242420"
INK = "#1A1A17" if THEME == "light" else "#F0EFE8"
INK_SOFT = "#4A4A44" if THEME == "light" else "#B8B7B0"
INK_MUTED = "#6B6A63" if THEME == "light" else "#A8A79F"

# Imprint palette — finance semantic exception: green=profit/bullish, red=loss/bearish
BULLISH = "#009E73"  # Imprint position 1, brand green
BEARISH = "#AE3030"  # Imprint position 5, matte red (loss/error semantic anchor)
SMA_COLOR = "#4467A3"  # Imprint position 3, blue

# Simulated 30 business days of stock price data
np.random.seed(42)
n_days = 30
dates = pd.date_range(start="2024-01-01", periods=n_days, freq="B")

prices = [100.0]
for _ in range(n_days - 1):
    change = np.random.randn() * 2
    prices.append(prices[-1] + change)

data = []
for i, date in enumerate(dates):
    base = prices[i]
    volatility = np.random.uniform(1, 3)
    open_price = base + np.random.uniform(-volatility, volatility)
    close_price = base + np.random.uniform(-volatility, volatility)
    high_price = max(open_price, close_price) + np.random.uniform(0.5, volatility)
    low_price = min(open_price, close_price) - np.random.uniform(0.5, volatility)
    data.append(
        {
            "date": date,
            "open": round(open_price, 2),
            "high": round(high_price, 2),
            "low": round(low_price, 2),
            "close": round(close_price, 2),
        }
    )

df = pd.DataFrame(data)
df["direction"] = np.where(df["close"] >= df["open"], "Bullish", "Bearish")
df["sma5"] = df["close"].rolling(window=5).mean()

# Imprint color scale — finance semantic: green=bullish, red=bearish
color_scale = alt.Scale(domain=["Bullish", "Bearish"], range=[BULLISH, BEARISH])

# Wicks: high-low lines, thinner than bodies
wicks = (
    alt.Chart(df)
    .mark_rule(strokeWidth=1.5)
    .encode(
        x=alt.X("date:T", title="Date", axis=alt.Axis(format="%b %d")),
        y=alt.Y("low:Q", title="Price ($)", scale=alt.Scale(zero=False)),
        y2="high:Q",
        color=alt.Color("direction:N", scale=color_scale, legend=None),
    )
)

# Bodies: open-close bars — thin ink stroke aids CVD accessibility (shape outline)
bodies = (
    alt.Chart(df)
    .mark_bar(size=12, stroke=INK, strokeWidth=0.7)
    .encode(
        x="date:T",
        y="open:Q",
        y2="close:Q",
        color=alt.Color(
            "direction:N", scale=color_scale, legend=alt.Legend(title="Direction", labelFontSize=10, titleFontSize=10)
        ),
        tooltip=[
            alt.Tooltip("date:T", title="Date", format="%b %d, %Y"),
            alt.Tooltip("open:Q", title="Open", format="$.2f"),
            alt.Tooltip("high:Q", title="High", format="$.2f"),
            alt.Tooltip("low:Q", title="Low", format="$.2f"),
            alt.Tooltip("close:Q", title="Close", format="$.2f"),
        ],
    )
)

# 5-day simple moving average overlay
sma_df = df.dropna(subset=["sma5"])
sma_line = (
    alt.Chart(sma_df)
    .mark_line(strokeWidth=2.0, strokeDash=[6, 3], opacity=0.85)
    .encode(x="date:T", y="sma5:Q", color=alt.value(SMA_COLOR))
)

# SMA inline label — positioned early (before the peak) to avoid overlap with tall candles
sma_mid = sma_df.iloc[[2]]
sma_label = (
    alt.Chart(sma_mid)
    .mark_text(align="left", dy=-10, fontSize=10, fontWeight="bold", fontStyle="italic")
    .encode(x="date:T", y="sma5:Q", text=alt.value("5-day MA"), color=alt.value(SMA_COLOR))
)

chart = (
    alt.layer(wicks, bodies, sma_line, sma_label)
    .resolve_scale(color="independent")
    .properties(
        width=620,
        height=320,
        background=PAGE_BG,
        title=alt.Title(
            "candlestick-basic · python · altair · anyplot.ai",
            fontSize=16,
            anchor="middle",
            color=INK,
            subtitle="30-day price action with 5-day moving average",
            subtitleFontSize=12,
            subtitleColor=INK_MUTED,
        ),
    )
    .configure_view(fill=PAGE_BG, strokeWidth=0)
    .configure_axis(
        domainColor=INK_SOFT,
        tickColor=INK_SOFT,
        gridColor=INK,
        gridOpacity=0.15,
        labelColor=INK_SOFT,
        titleColor=INK,
        labelFontSize=10,
        titleFontSize=12,
    )
    .configure_axisX(grid=False)
    .configure_legend(
        fillColor=ELEVATED_BG,
        strokeColor=INK_SOFT,
        labelColor=INK_SOFT,
        titleColor=INK,
        labelFontSize=10,
        titleFontSize=10,
    )
    .interactive()
)

# Save PNG at canonical landscape target: 3200 × 1800
chart.save(f"plot-{THEME}.png", scale_factor=4.0)

# PAD-only to canonical target — never crop (cropping clips title/labels, triggers AR-09)
TW, TH = 3200, 1800
_img = Image.open(f"plot-{THEME}.png").convert("RGB")
_w, _h = _img.size
if _w > TW or _h > TH:
    raise SystemExit(
        f"altair vl-convert produced {_w}×{_h}, exceeds target {TW}×{TH}. "
        f"Shrink chart .properties(width=, height=) values and re-render."
    )
if _w < TW or _h < TH:
    _canvas = Image.new("RGB", (TW, TH), PAGE_BG)
    _canvas.paste(_img, ((TW - _w) // 2, (TH - _h) // 2))
    _canvas.save(f"plot-{THEME}.png")

chart.save(f"plot-{THEME}.html")
Runnable source as JSON, for any HTTP client: https://api.anyplot.ai/specs/candlestick-basic/altair/code. Any spec id and library id listed in llms-full.txt fit the same URL shape; every URL below is complete and callable.
{
  "spec_id": "candlestick-basic",
  "language": "python",
  "library": "altair",
  "page": "https://anyplot.ai/candlestick-basic/python/altair",
  "hub": "https://anyplot.ai/candlestick-basic",
  "code_json": "https://api.anyplot.ai/specs/candlestick-basic/altair/code",
  "spec_json": "https://api.anyplot.ai/specs/candlestick-basic",
  "render_light_png": "https://storage.googleapis.com/anyplot-images/plots/candlestick-basic/python/altair/plot-light.png",
  "render_dark_png": "https://storage.googleapis.com/anyplot-images/plots/candlestick-basic/python/altair/plot-dark.png",
  "interactive_light_html": "https://storage.googleapis.com/anyplot-images/plots/candlestick-basic/python/altair/plot-light.html",
  "interactive_dark_html": "https://storage.googleapis.com/anyplot-images/plots/candlestick-basic/python/altair/plot-dark.html",
  "quality_score": 87.0,
  "license": "MIT",
  "guide": "https://anyplot.ai/llms.txt"
}
Part of Basic Candlestick Chart on anyplot.ai.