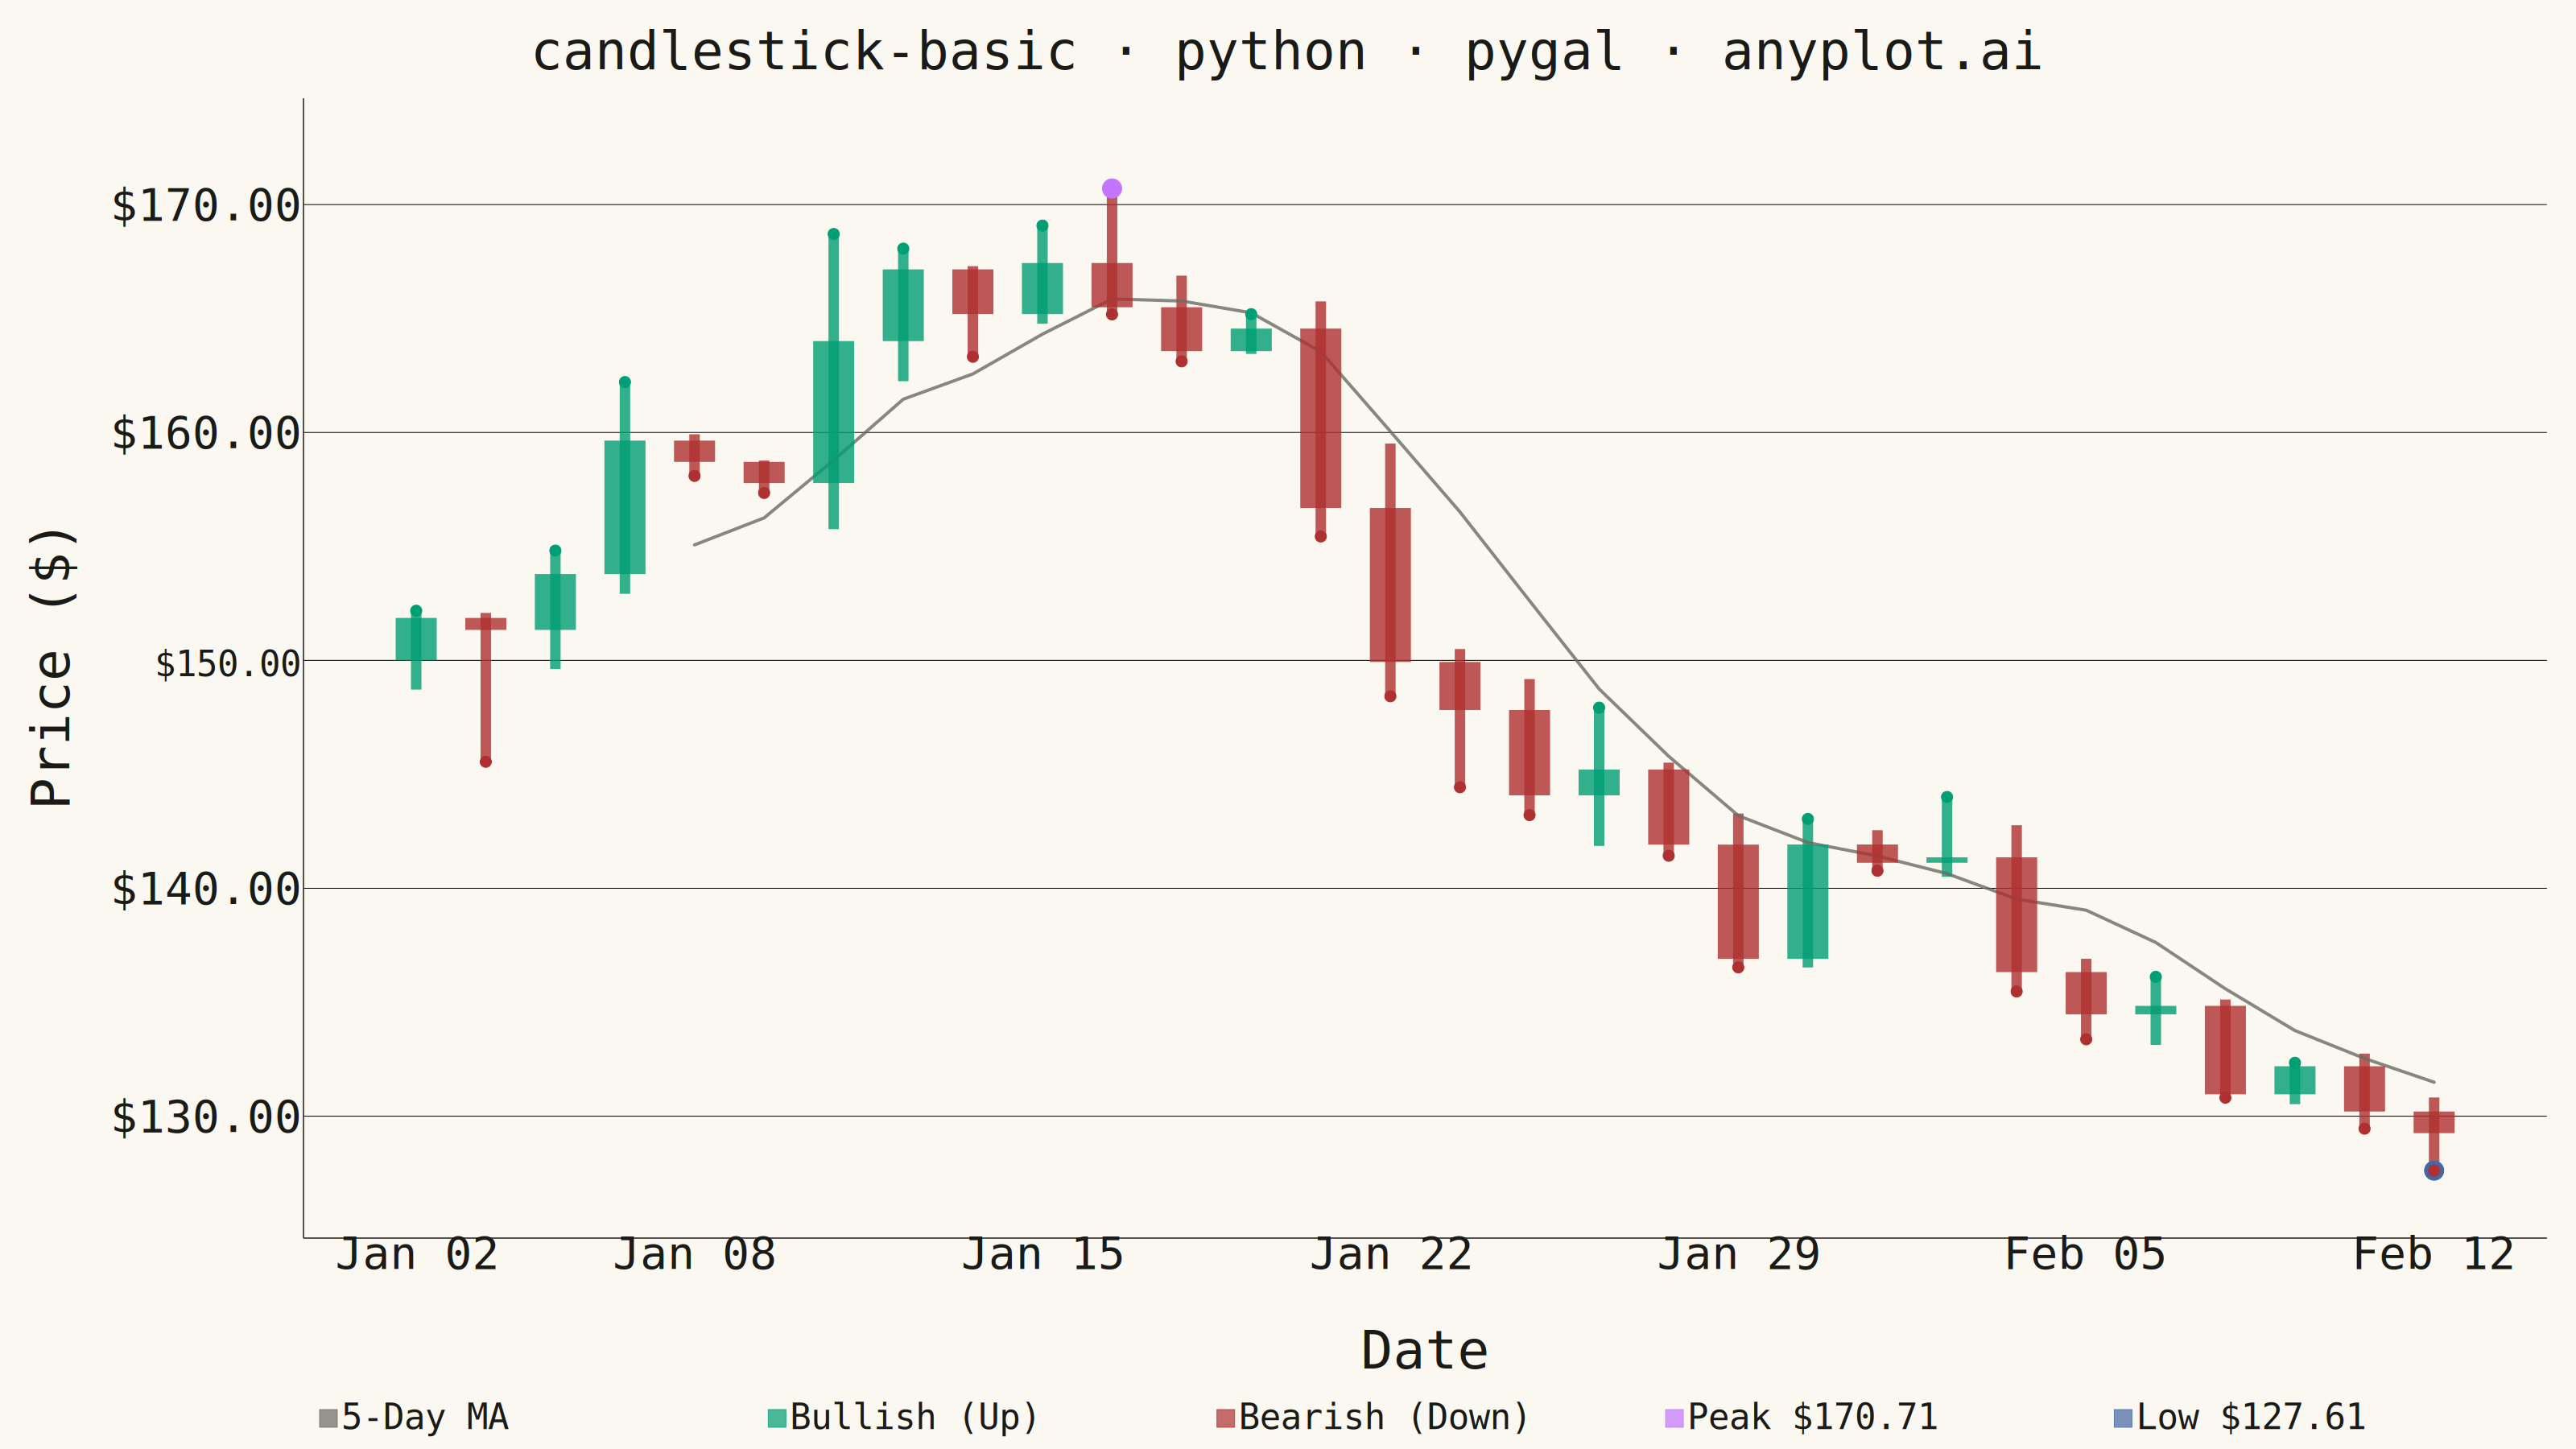
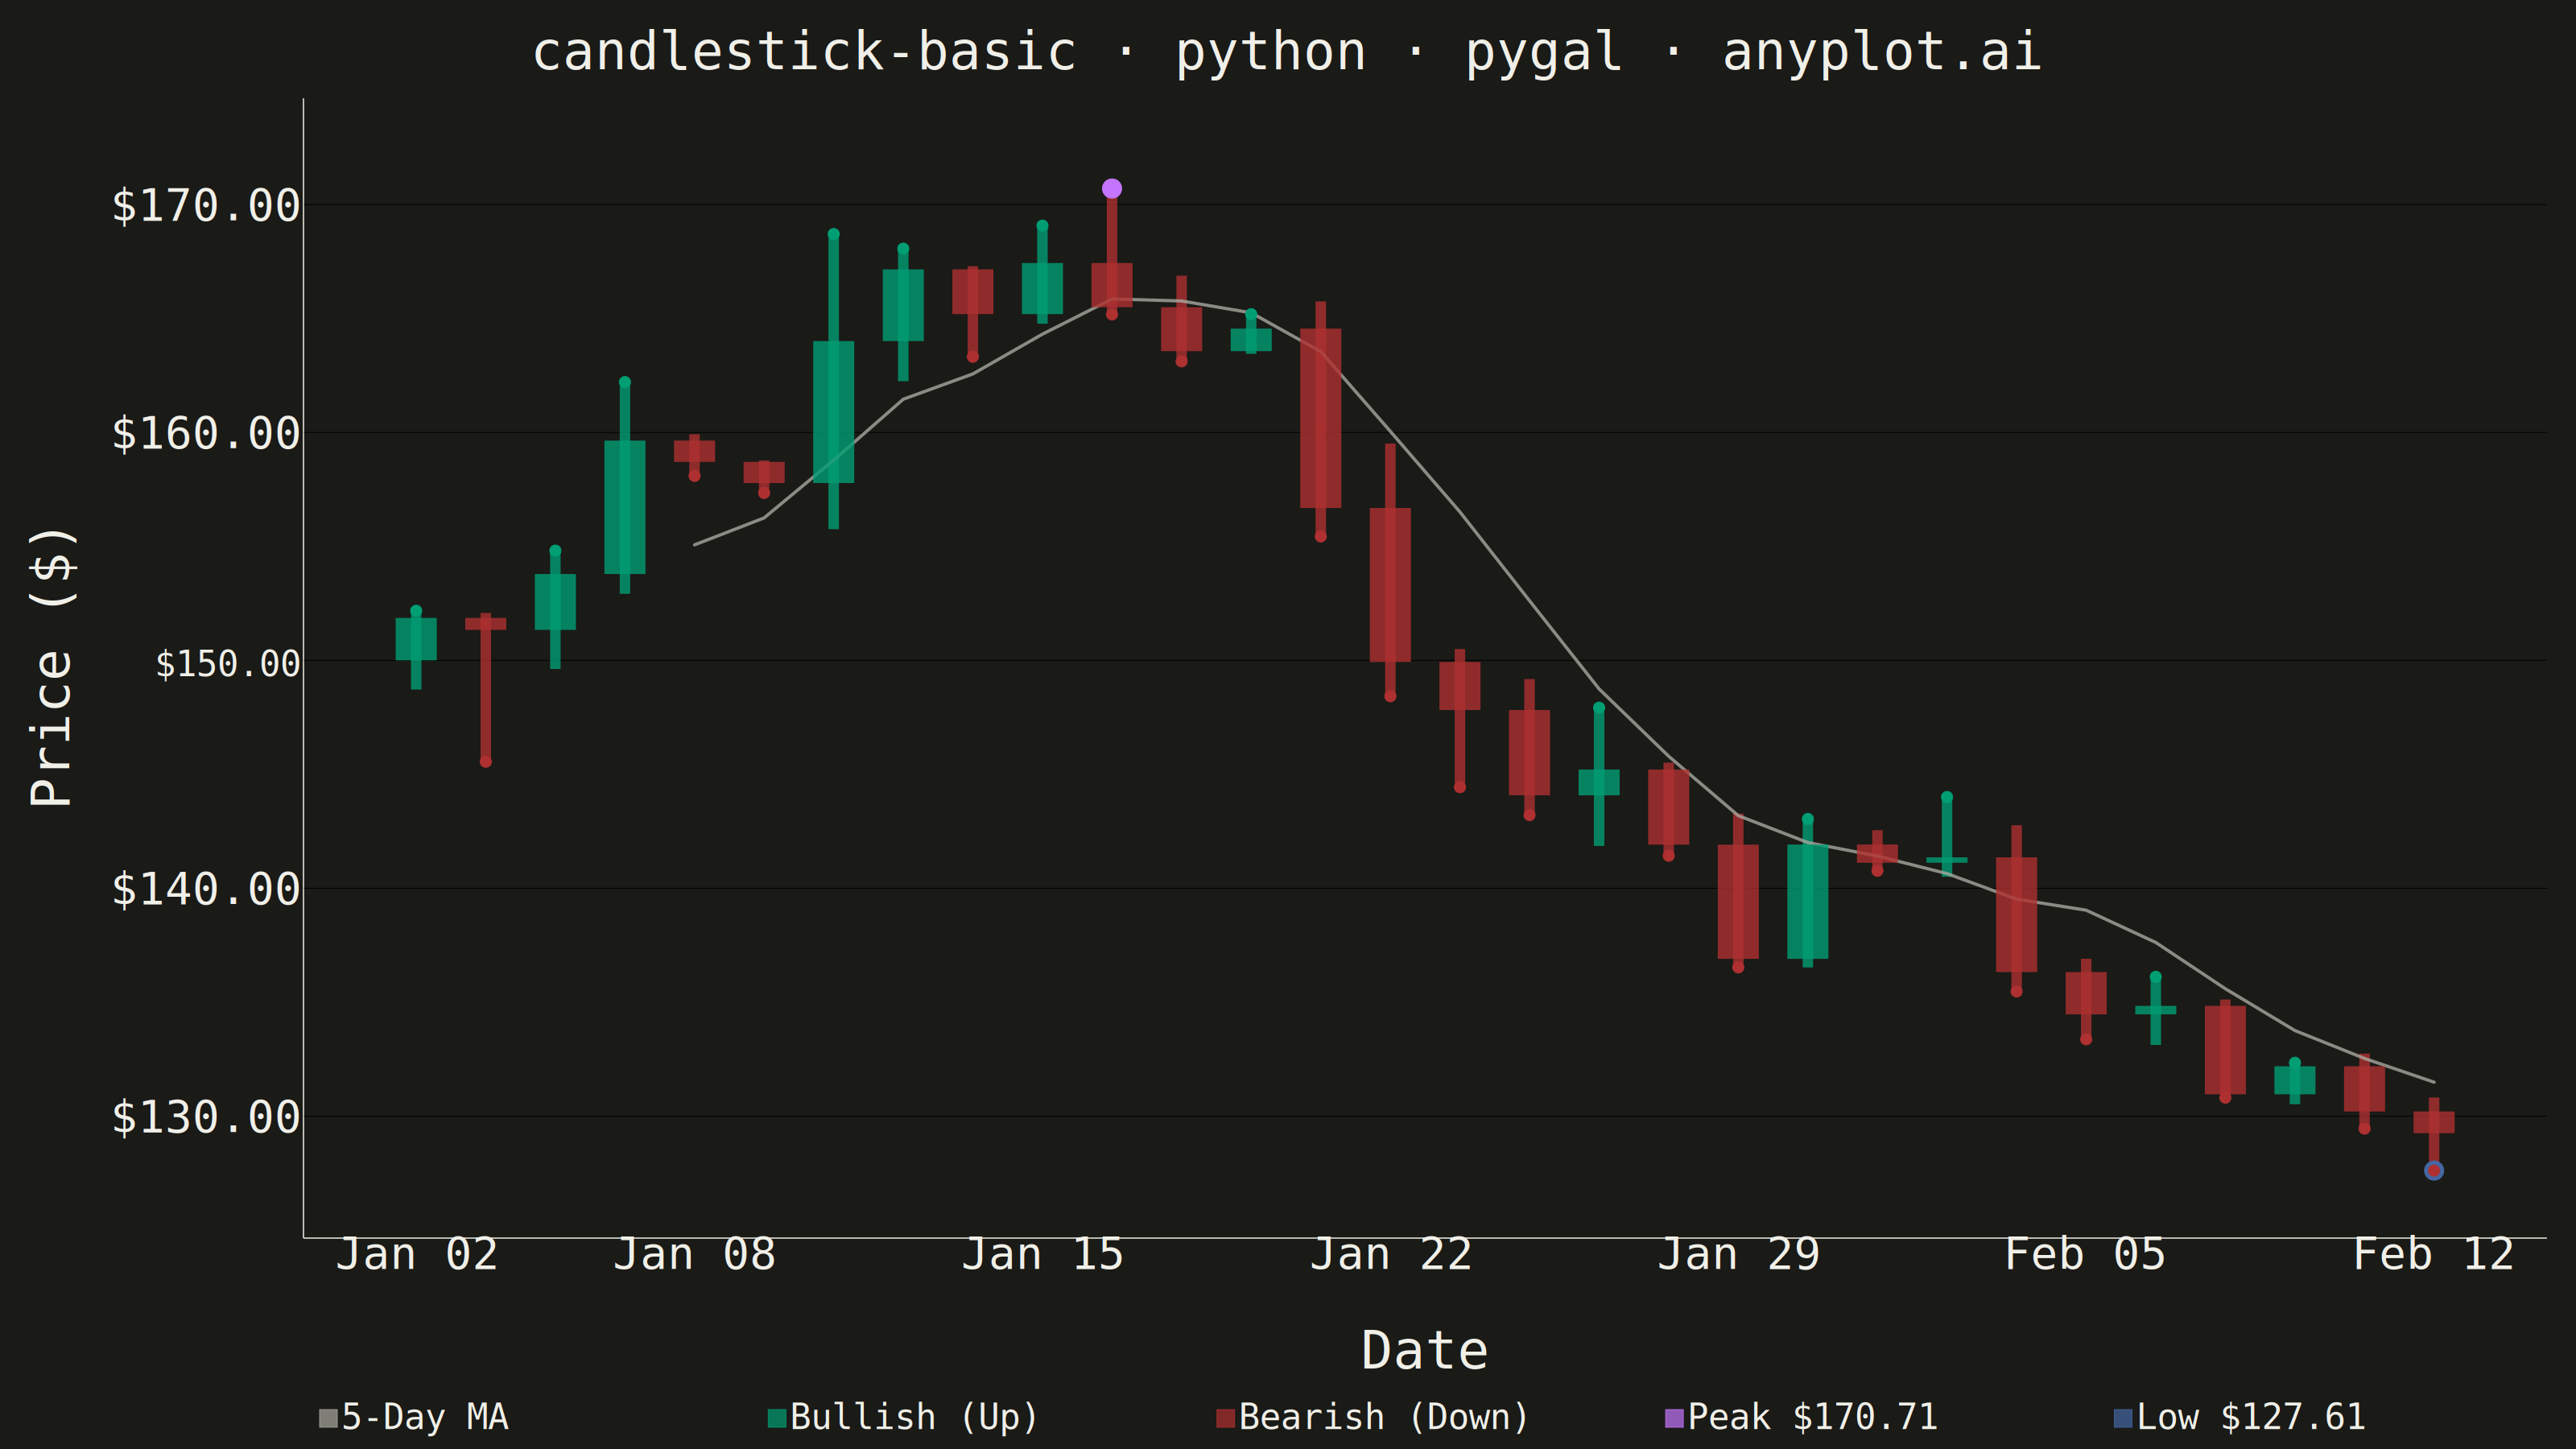
A candlestick chart displays open, high, low, and close (OHLC) price data for financial instruments over time. Each candlestick shows the price range within a specific period, with the body indicating the open-close range and the wicks (shadows) showing the high-low range. Color coding distinguishes bullish (price increase) from bearish (price decrease) periods, making it easy to identify trends and price patterns at a glance.
""" anyplot.ai
candlestick-basic: Basic Candlestick Chart
Library: pygal 3.1.0 | Python 3.13.13
Quality: 90/100 | Updated: 2026-05-30
"""

import os
import re
import sys
from datetime import datetime, timedelta


# This file is named 'pygal.py'; remove its own directory from sys.path so
# 'import pygal' resolves to the installed package rather than this script itself.
_self_dir = os.path.dirname(os.path.abspath(__file__))
sys.path = [p for p in sys.path if os.path.abspath(p or ".") != _self_dir]

import cairosvg
import numpy as np
import pygal
from pygal.style import Style


# --- Theme tokens (Imprint palette + theme-adaptive chrome) ---
THEME = os.getenv("ANYPLOT_THEME", "light")
PAGE_BG = "#FAF8F1" if THEME == "light" else "#1A1A17"
INK = "#1A1A17" if THEME == "light" else "#F0EFE8"
INK_MUTED = "#6B6A63" if THEME == "light" else "#A8A79F"

# Finance semantic: bullish=green (Imprint pos 1), bearish=matte-red (Imprint pos 5)
BULL = "#009E73"
BEAR = "#AE3030"
PEAK_CLR = "#C475FD"  # Imprint pos 2
LOW_CLR = "#4467A3"  # Imprint pos 3
MA_CLR = INK_MUTED  # theme-adaptive reference line

# --- Data: 30 trading days of OHLC stock prices ---
np.random.seed(42)
n_days = 30

start_date = datetime(2024, 1, 2)
dates = []
cur = start_date
for _ in range(n_days):
    while cur.weekday() >= 5:
        cur += timedelta(days=1)
    dates.append(cur)
    cur += timedelta(days=1)

base_price = 150.0
returns = np.random.randn(n_days) * 2.5
price_series = base_price * np.cumprod(1 + returns / 100)

ohlc_data = []
for i, close in enumerate(price_series):
    volatility = np.abs(np.random.randn()) * 2 + 0.5
    intraday_range = close * volatility / 100
    open_price = base_price if i == 0 else ohlc_data[-1]["close"]
    high = max(open_price, close) + np.random.rand() * intraday_range
    low = min(open_price, close) - np.random.rand() * intraday_range
    ohlc_data.append({"day": i + 1, "open": open_price, "high": high, "low": low, "close": close})

# 5-day moving average for trend context
closes = [d["close"] for d in ohlc_data]
ma_points = [(i + 1, float(np.mean(closes[i - 4 : i + 1]))) for i in range(4, n_days)]

# Price extremes for storytelling markers
peak = max(ohlc_data, key=lambda d: d["high"])
trough = min(ohlc_data, key=lambda d: d["low"])

# --- Group candlestick segments by direction (None = line break) ---
bull_wicks, bear_wicks = [], []
bull_bodies, bear_bodies = [], []

for candle in ohlc_data:
    x = candle["day"]
    wick = [(x, candle["low"]), (x, candle["high"]), None]
    body = [(x, candle["open"]), (x, candle["close"]), None]
    if candle["close"] >= candle["open"]:
        bull_wicks.extend(wick)
        bull_bodies.extend(body)
    else:
        bear_wicks.extend(wick)
        bear_bodies.extend(body)

# CVD redundant encoding: positional markers at wick extremes signal direction
# (top-of-wick dot = bullish / bottom-of-wick dot = bearish, independent of color)
bull_direction_pts = [(c["day"], c["high"]) for c in ohlc_data if c["close"] >= c["open"]]
bear_direction_pts = [(c["day"], c["low"]) for c in ohlc_data if c["close"] < c["open"]]

date_map = {i + 1: dates[i] for i in range(n_days)}

# --- Style: Imprint palette + theme-adaptive chrome ---
# 9 colors indexed by series add order (0–8 incl. hidden CVD marker series 7–8)
custom_style = Style(
    background=PAGE_BG,
    plot_background=PAGE_BG,
    foreground=INK,
    foreground_strong=INK,
    foreground_subtle=INK_MUTED,
    colors=(BULL, BEAR, MA_CLR, BULL, BEAR, PEAK_CLR, LOW_CLR, BULL, BEAR),
    title_font_size=66,
    label_font_size=56,
    major_label_font_size=44,
    legend_font_size=44,
    value_font_size=36,
)

# --- Chart: 3200×1800 landscape canvas ---
WICK_W, BODY_W, MA_W = 13, 51, 4

chart = pygal.XY(
    style=custom_style,
    width=3200,
    height=1800,
    title="candlestick-basic · python · pygal · anyplot.ai",
    x_title="Date",
    y_title="Price ($)",
    show_dots=False,
    show_x_guides=False,
    show_y_guides=True,
    allow_interruptions=True,
    range=(min(d["low"] for d in ohlc_data) - 2, max(d["high"] for d in ohlc_data) + 3),
    xrange=(0, n_days + 1),
    legend_box_size=22,
    legend_at_bottom=True,
    legend_at_bottom_columns=5,
    margin=36,
    spacing=20,
    tooltip_border_radius=8,
    truncate_legend=-1,
    value_formatter=lambda x: f"${x:.2f}",
)

chart.x_labels = [1, 5, 10, 15, 20, 25, 30]
chart.x_value_formatter = lambda x: date_map[int(round(x))].strftime("%b %d") if int(round(x)) in date_map else ""

# Series 0: bull wicks (hidden from legend)
chart.add(None, bull_wicks, stroke=True, show_dots=False, stroke_style={"width": WICK_W, "linecap": "butt"})
# Series 1: bear wicks (hidden from legend)
chart.add(None, bear_wicks, stroke=True, show_dots=False, stroke_style={"width": WICK_W, "linecap": "butt"})
# Series 2: moving average trend line
chart.add("5-Day MA", ma_points, stroke=True, show_dots=False, stroke_style={"width": MA_W, "linecap": "round"})
# Series 3: bullish candle bodies
chart.add("Bullish (Up)", bull_bodies, stroke=True, show_dots=False, stroke_style={"width": BODY_W, "linecap": "butt"})
# Series 4: bearish candle bodies
chart.add(
    "Bearish (Down)", bear_bodies, stroke=True, show_dots=False, stroke_style={"width": BODY_W, "linecap": "butt"}
)
# Series 5: peak accent marker
chart.add(f"Peak ${peak['high']:.2f}", [(peak["day"], peak["high"])], stroke=False, show_dots=True, dots_size=12)
# Series 6: trough accent marker
chart.add(f"Low ${trough['low']:.2f}", [(trough["day"], trough["low"])], stroke=False, show_dots=True, dots_size=12)
# Series 7: CVD direction markers — top of bullish wicks (hidden from legend)
chart.add(None, bull_direction_pts, stroke=False, show_dots=True, dots_size=7)
# Series 8: CVD direction markers — bottom of bearish wicks (hidden from legend)
chart.add(None, bear_direction_pts, stroke=False, show_dots=True, dots_size=7)

# --- Render: SVG post-processing for cairosvg and visual refinement ---
# cairosvg ignores CSS class-based stroke properties; inline them directly on each series group
svg = chart.render(is_unicode=True)

# 1. Inline stroke widths for cairosvg compatibility
series_strokes = {
    0: (WICK_W, "butt"),
    1: (WICK_W, "butt"),
    2: (MA_W, "round"),
    3: (BODY_W, "butt"),
    4: (BODY_W, "butt"),
}
for sid, (width, cap) in series_strokes.items():
    style_attr = f' style="stroke-width:{width};stroke-linecap:{cap}"'
    svg = re.sub(
        rf'(class="series serie-{sid} color-{sid}"[^>]*>.*?</g>)',
        lambda m, s=style_attr: m.group(0).replace('class="line reactive nofill"', 'class="line reactive nofill"' + s),
        svg,
        count=1,
        flags=re.DOTALL,
    )

# 2. Grid lines: override dashed default with solid lines
svg = re.sub(r"stroke-dasharray\s*:\s*[\d.,\s]+", "stroke-dasharray:none", svg)

# 3. L-spine border: replace full-frame rect with left + bottom lines only
m = re.search(r'<g\b[^>]*class="plot"[^>]*>\s*(<rect\b[^>]*/?>)', svg)
if m:
    rect_tag = m.group(1)
    rx = re.search(r'\bx="([^"]+)"', rect_tag)
    ry = re.search(r'\by="([^"]+)"', rect_tag)
    rw = re.search(r'\bwidth="([^"]+)"', rect_tag)
    rh = re.search(r'\bheight="([^"]+)"', rect_tag)
    if rx and ry and rw and rh:
        x, y, w, h = float(rx.group(1)), float(ry.group(1)), float(rw.group(1)), float(rh.group(1))
        no_stroke = re.sub(r'\bstroke="[^"]*"', 'stroke="none"', rect_tag)
        if "stroke=" not in rect_tag:
            no_stroke = rect_tag[:-2] + ' stroke="none"/>' if rect_tag.endswith("/>") else rect_tag
        l_spine = (
            f'<line x1="{x:.1f}" y1="{y:.1f}" x2="{x:.1f}" y2="{y + h:.1f}" '
            f'stroke="{INK_MUTED}" stroke-width="1.5"/>'
            f'<line x1="{x:.1f}" y1="{y + h:.1f}" x2="{x + w:.1f}" y2="{y + h:.1f}" '
            f'stroke="{INK_MUTED}" stroke-width="1.5"/>'
        )
        svg = svg.replace(rect_tag, no_stroke + l_spine, 1)

cairosvg.svg2png(bytestring=svg.encode("utf-8"), write_to=f"plot-{THEME}.png")
with open(f"plot-{THEME}.html", "w") as f:
    f.write(chart.render(is_unicode=True))
Runnable source as JSON, for any HTTP client: https://api.anyplot.ai/specs/candlestick-basic/pygal/code. Any spec id and library id listed in llms-full.txt fit the same URL shape; every URL below is complete and callable.
{
  "spec_id": "candlestick-basic",
  "language": "python",
  "library": "pygal",
  "page": "https://anyplot.ai/candlestick-basic/python/pygal",
  "hub": "https://anyplot.ai/candlestick-basic",
  "code_json": "https://api.anyplot.ai/specs/candlestick-basic/pygal/code",
  "spec_json": "https://api.anyplot.ai/specs/candlestick-basic",
  "render_light_png": "https://storage.googleapis.com/anyplot-images/plots/candlestick-basic/python/pygal/plot-light.png",
  "render_dark_png": "https://storage.googleapis.com/anyplot-images/plots/candlestick-basic/python/pygal/plot-dark.png",
  "interactive_light_html": "https://storage.googleapis.com/anyplot-images/plots/candlestick-basic/python/pygal/plot-light.html",
  "interactive_dark_html": "https://storage.googleapis.com/anyplot-images/plots/candlestick-basic/python/pygal/plot-dark.html",
  "quality_score": 90.0,
  "license": "MIT",
  "guide": "https://anyplot.ai/llms.txt"
}
Part of Basic Candlestick Chart on anyplot.ai.