The same plot in 14 other libraries — JavaScript: Chart.js, D3.js, Apache ECharts, MUI X Charts; Python: Altair, Bokeh, lets-plot, Matplotlib, Plotly, plotnine, Pygal, Seaborn; R: ggplot2; Julia: Makie.jl. Compare all 15 side by side: Basic Candlestick Chart in Python, R, Julia and JavaScript.
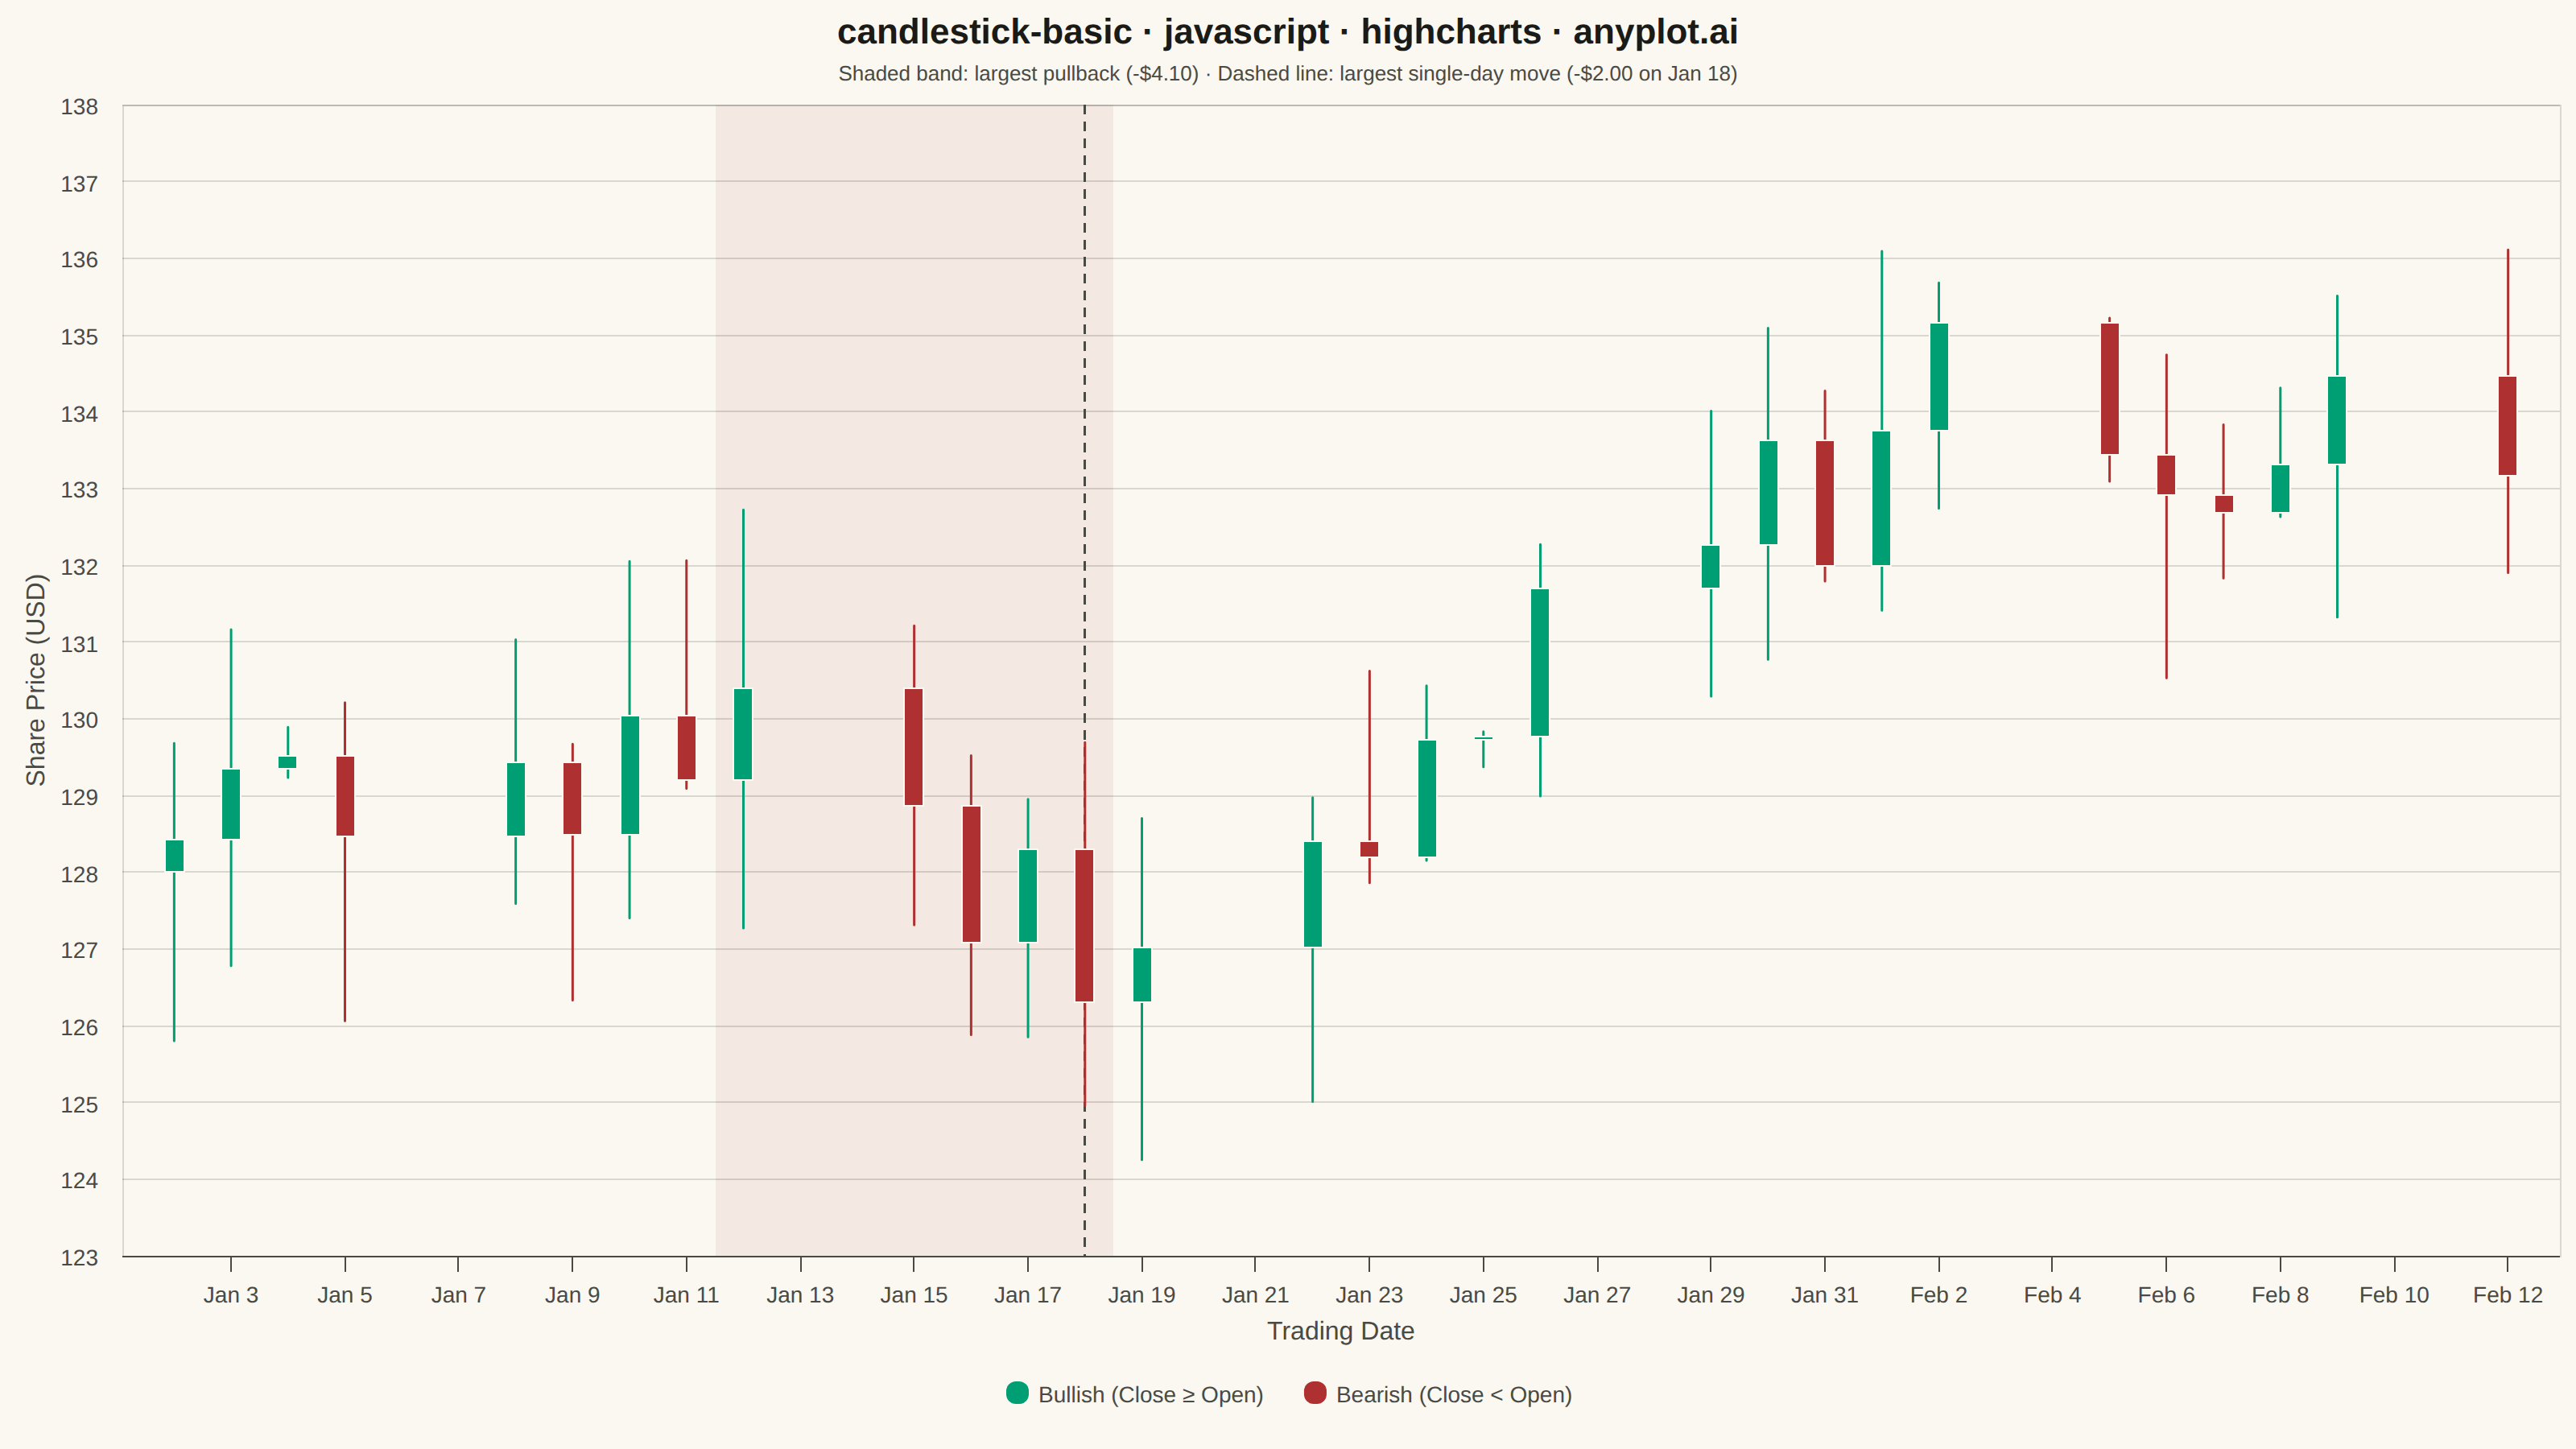
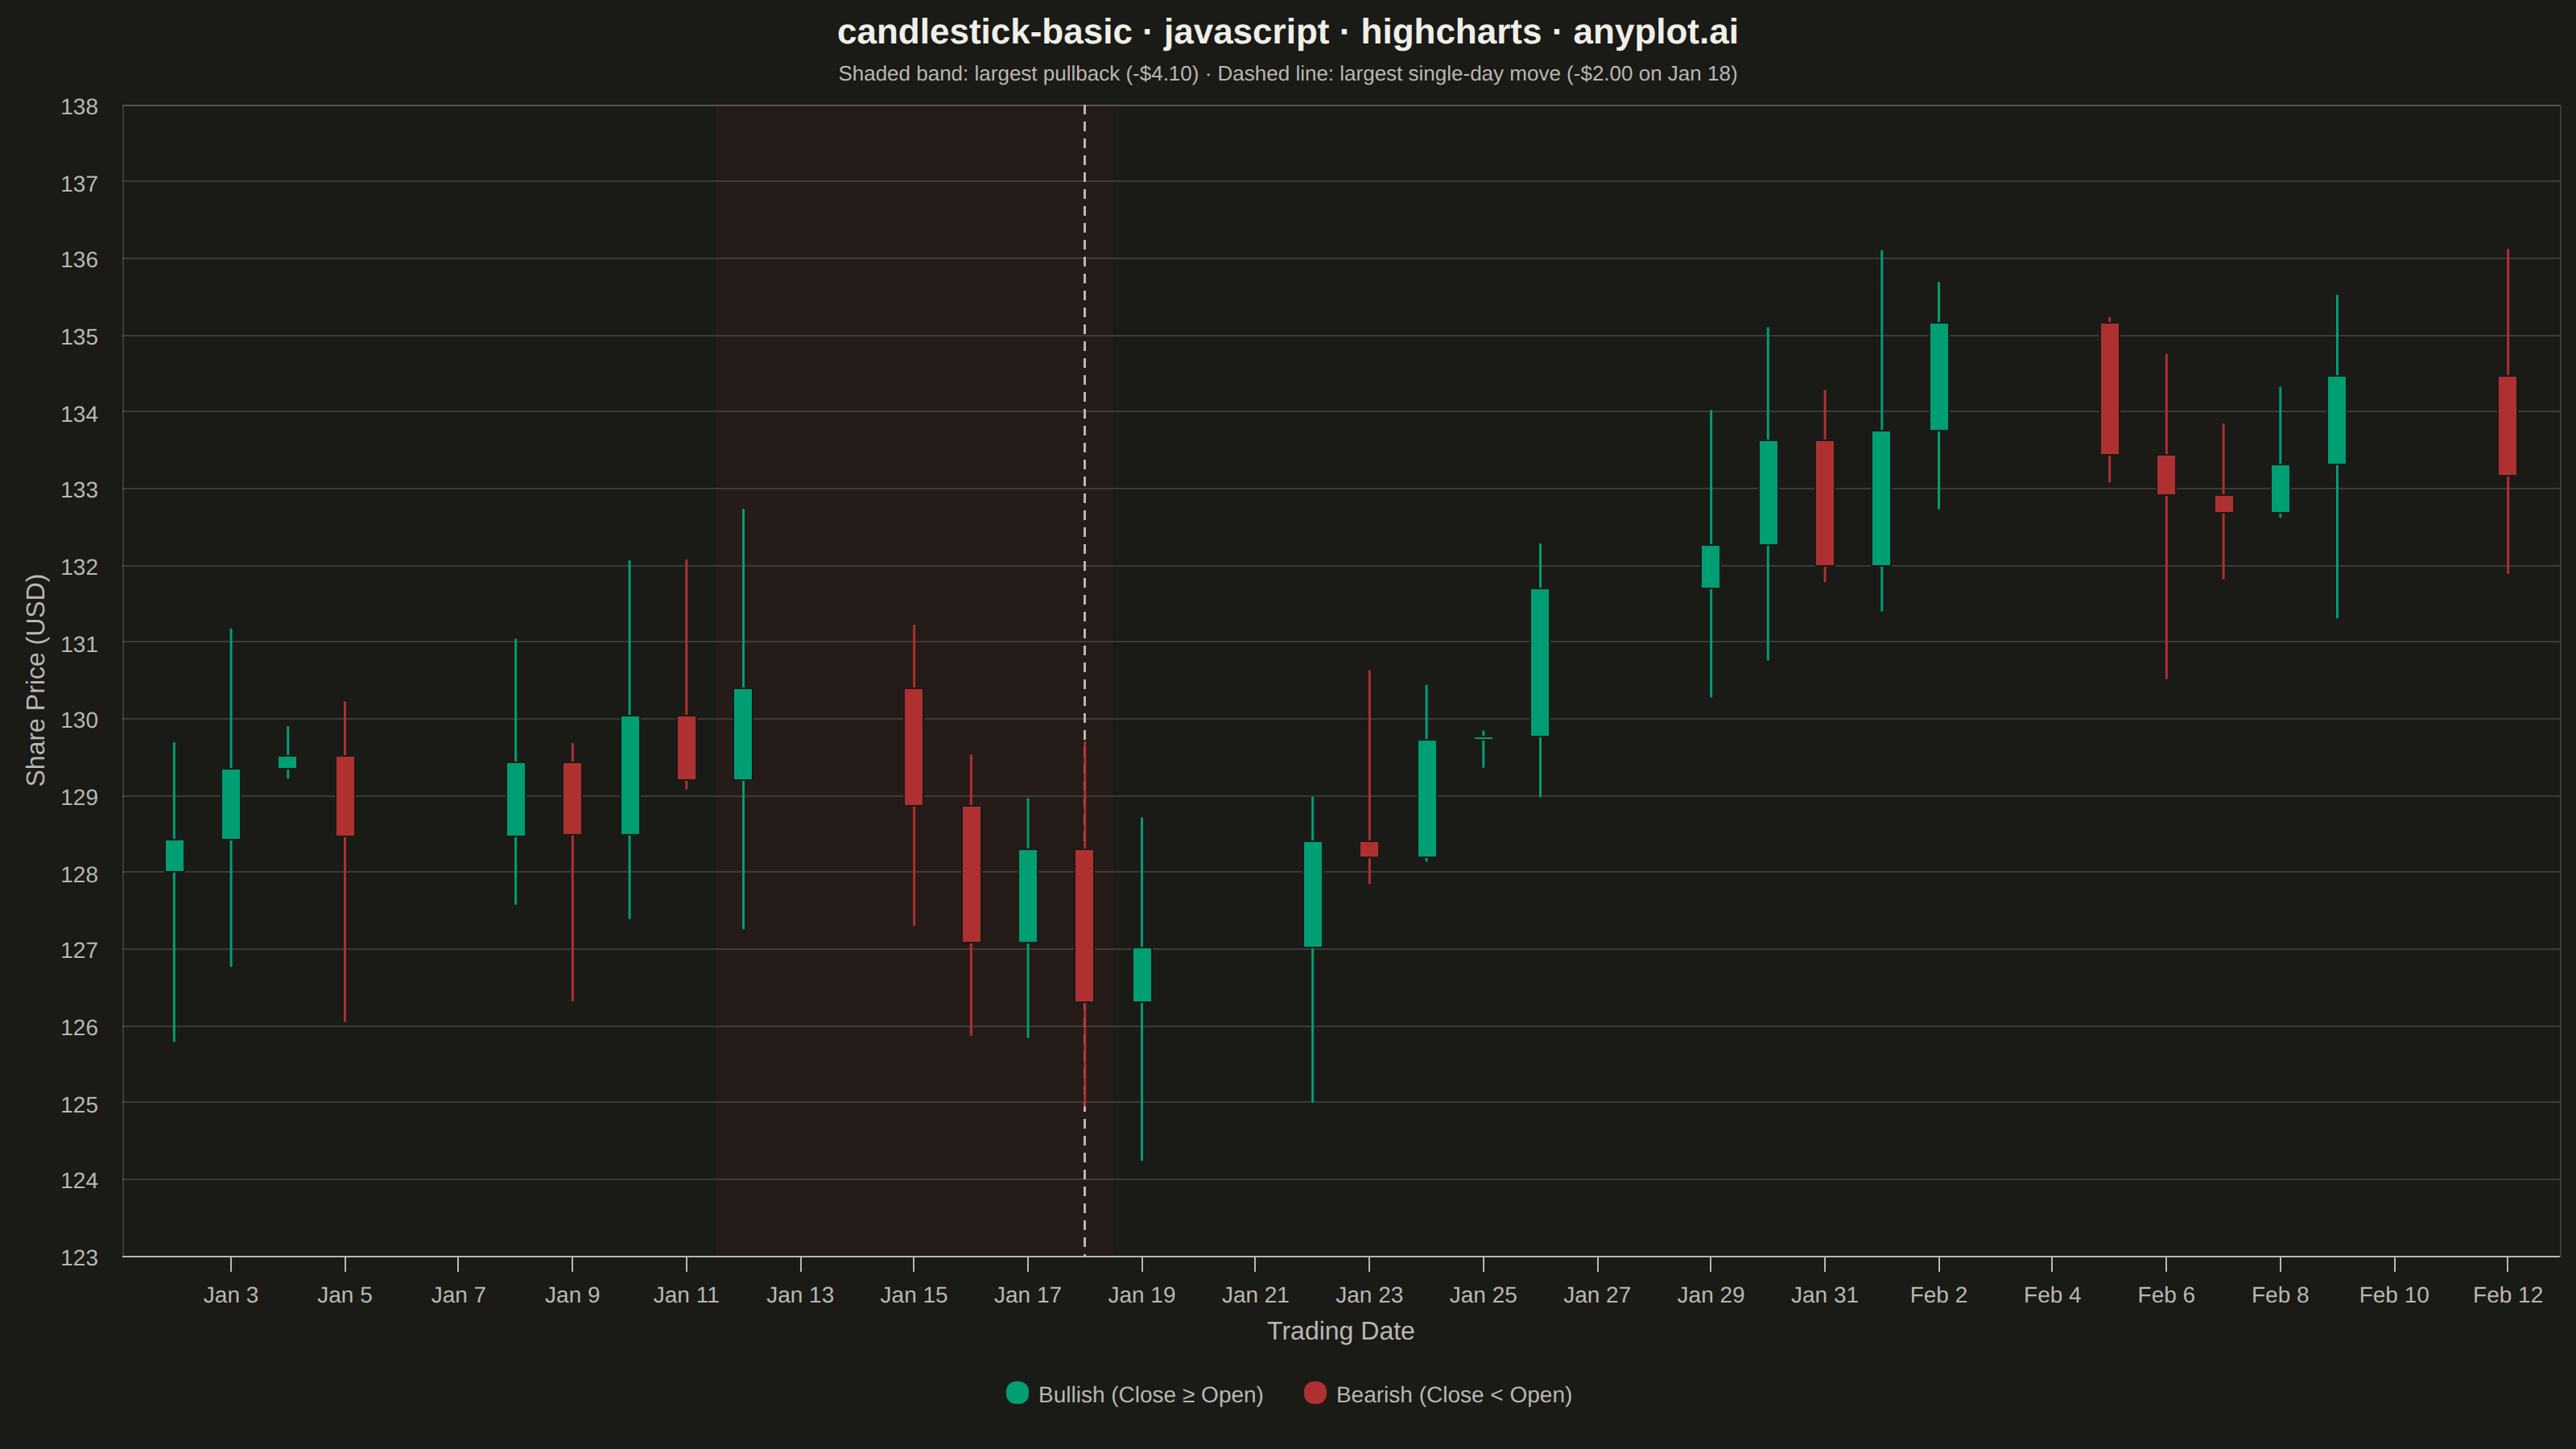
A candlestick chart displays open, high, low, and close (OHLC) price data for financial instruments over time. Each candlestick shows the price range within a specific period, with the body indicating the open-close range and the wicks (shadows) showing the high-low range. Color coding distinguishes bullish (price increase) from bearish (price decrease) periods, making it easy to identify trends and price patterns at a glance.
// anyplot.ai
// candlestick-basic: Basic Candlestick Chart
// Library: highcharts 12.6.0 | JavaScript 22.23.2
// Quality: 90/100 | Created: 2026-08-24

// The core bundle (no highcharts-more / modules/stock) has no "candlestick"
// series — that type ships in modules/stock.js, which isn't loaded. Each
// candle is built the same way box-basic builds boxplots: an invisible
// "Floor" column stacked under a colorByPoint "Body" column for the
// open→close range, with per-direction "line" series (null-separated, one
// pair per candle) for the high→low wicks drawn *before* the body so the
// wick's middle segment is covered by the box — pure core series types, no
// add-on module, no cross-library workaround.
const t = window.ANYPLOT_TOKENS;

// --- Data (in-memory, deterministic LCG) ------------------------------------
let seed = 42;
function lcg() {
  seed = (seed * 1103515245 + 12345) & 0x7fffffff;
  return seed / 0x7fffffff;
}

const upColor = t.palette[0]; // #009E73 brand green — bullish (profit/up)
const downColor = t.palette[4]; // #AE3030 matte red — bearish (loss/down), finance semantic anchor

const dayMs = 24 * 3600 * 1000;
const numDays = 30;
const dates = [];
let cursor = Date.UTC(2024, 0, 2); // Tue 2 Jan 2024
while (dates.length < numDays) {
  const weekday = new Date(cursor).getUTCDay();
  if (weekday !== 0 && weekday !== 6) dates.push(cursor);
  cursor += dayMs;
}

let price = 128;
const candles = dates.map((time) => {
  const open = price;
  const drift = (lcg() - 0.48) * 4.2;
  const close = Math.max(5, open + drift);
  const high = Math.max(open, close) + lcg() * 2.4;
  const low = Math.max(1, Math.min(open, close) - lcg() * 2.4);
  price = close;
  return {
    time,
    open: +open.toFixed(2),
    high: +high.toFixed(2),
    low: +low.toFixed(2),
    close: +close.toFixed(2),
    bullish: close >= open,
  };
});

const floorData = candles.map((c) => ({
  x: c.time,
  y: +Math.min(c.open, c.close).toFixed(2),
}));
const bodyData = candles.map((c) => ({
  x: c.time,
  y: +Math.abs(c.close - c.open).toFixed(2),
  color: c.bullish ? upColor : downColor,
  custom: c,
}));
const wickUpData = candles
  .filter((c) => c.bullish)
  .flatMap((c) => [{ x: c.time, y: c.low }, { x: c.time, y: c.high }, { x: c.time, y: null }]);
const wickDownData = candles
  .filter((c) => !c.bullish)
  .flatMap((c) => [{ x: c.time, y: c.low }, { x: c.time, y: c.high }, { x: c.time, y: null }]);

const allLows = candles.map((c) => c.low);
const allHighs = candles.map((c) => c.high);
const pad = (Math.max(...allHighs) - Math.min(...allLows)) * 0.08;
const yMin = Math.floor(Math.min(...allLows) - pad);
const yMax = Math.ceil(Math.max(...allHighs) + pad);

// --- Focal-point annotations (derived from the data, not hard-coded) --------
// Largest single-day move, by |close - open|.
let moveIdx = 0;
candles.forEach((c, i) => {
  const move = Math.abs(c.close - c.open);
  const bestMove = Math.abs(candles[moveIdx].close - candles[moveIdx].open);
  if (move > bestMove) moveIdx = i;
});
const moveCandle = candles[moveIdx];
const moveSize = Math.abs(moveCandle.close - moveCandle.open);

// Largest peak-to-trough pullback (max drawdown on closing price).
let peakIdx = 0;
let drawdownPeakIdx = 0;
let drawdownTroughIdx = 0;
let maxDrawdown = 0;
candles.forEach((c, i) => {
  if (c.close > candles[peakIdx].close) peakIdx = i;
  const drawdown = candles[peakIdx].close - c.close;
  if (drawdown > maxDrawdown) {
    maxDrawdown = drawdown;
    drawdownPeakIdx = peakIdx;
    drawdownTroughIdx = i;
  }
});
const pullbackFrom = candles[drawdownPeakIdx].time - dayMs / 2;
const pullbackTo = candles[drawdownTroughIdx].time + dayMs / 2;

// --- Chart -------------------------------------------------------------------
Highcharts.chart("container", {
  chart: {
    type: "column",
    backgroundColor: "transparent",
    animation: false,
    style: { fontFamily: "inherit" },
    plotBorderWidth: 1,
    plotBorderColor: t.grid,
  },
  credits: { enabled: false },
  colors: t.palette,
  title: {
    text: "candlestick-basic · javascript · highcharts · anyplot.ai",
    style: { color: t.ink, fontSize: "22px", fontWeight: "600" },
  },
  subtitle: {
    text:
      `Shaded band: largest pullback (-$${maxDrawdown.toFixed(2)}) · ` +
      `Dashed line: largest single-day move (${moveCandle.bullish ? "+" : "-"}$${moveSize.toFixed(2)} on ${Highcharts.dateFormat("%b %e", moveCandle.time)})`,
    style: { color: t.inkSoft, fontSize: "13px" },
  },
  xAxis: {
    type: "datetime",
    lineColor: t.inkSoft,
    tickColor: t.inkSoft,
    labels: { style: { color: t.inkSoft, fontSize: "14px" } },
    title: { text: "Trading Date", style: { color: t.inkSoft, fontSize: "16px" } },
    plotBands: [
      {
        from: pullbackFrom,
        to: pullbackTo,
        color: Highcharts.color(downColor).setOpacity(0.08).get(),
        zIndex: 0,
      },
    ],
    plotLines: [
      {
        value: moveCandle.time,
        color: t.inkSoft,
        dashStyle: "Dash",
        width: 1.5,
        zIndex: 3,
      },
    ],
  },
  yAxis: {
    min: yMin,
    max: yMax,
    reversedStacks: false, // keep series[0] (invisible floor) at the bottom of the stack
    title: { text: "Share Price (USD)", style: { color: t.inkSoft, fontSize: "16px" } },
    gridLineColor: t.grid,
    labels: { style: { color: t.inkSoft, fontSize: "14px" } },
  },
  legend: {
    enabled: true,
    itemStyle: { color: t.inkSoft, fontSize: "14px" },
    itemHoverStyle: { color: t.ink },
    symbolRadius: 6,
    itemDistance: 24,
    padding: 12,
  },
  tooltip: {
    outside: false,
    formatter: function () {
      const c = this.point.custom;
      if (!c) return false;
      return (
        `<b>${Highcharts.dateFormat("%b %e, %Y", c.time)}</b><br/>` +
        `Open: ${c.open.toFixed(2)}<br/>High: ${c.high.toFixed(2)}<br/>` +
        `Low: ${c.low.toFixed(2)}<br/>Close: ${c.close.toFixed(2)}`
      );
    },
  },
  plotOptions: {
    column: {
      stacking: "normal",
      pointWidth: 12,
      borderRadius: 0,
      animation: false,
    },
    series: { animation: false },
  },
  series: [
    {
      name: "Floor",
      data: floorData,
      color: "transparent",
      borderWidth: 0,
      enableMouseTracking: false,
      showInLegend: false,
    },
    {
      type: "line",
      name: "Wicks (up)",
      data: wickUpData,
      color: upColor,
      lineWidth: 1.5,
      marker: { enabled: false },
      enableMouseTracking: false,
      showInLegend: false,
    },
    {
      type: "line",
      name: "Wicks (down)",
      data: wickDownData,
      color: downColor,
      lineWidth: 1.5,
      marker: { enabled: false },
      enableMouseTracking: false,
      showInLegend: false,
    },
    {
      name: "Body",
      data: bodyData,
      borderColor: t.pageBg,
      borderWidth: 1,
      showInLegend: false,
    },
    {
      name: "Bullish (Close ≥ Open)",
      type: "column",
      data: [],
      color: upColor,
      showInLegend: true,
    },
    {
      name: "Bearish (Close < Open)",
      type: "column",
      data: [],
      color: downColor,
      showInLegend: true,
    },
  ],
});
Runnable source as JSON, for any HTTP client: https://api.anyplot.ai/specs/candlestick-basic/highcharts/code. Any spec id and library id listed in llms-full.txt fit the same URL shape; every URL below is complete and callable.
{
  "spec_id": "candlestick-basic",
  "language": "javascript",
  "library": "highcharts",
  "page": "https://anyplot.ai/candlestick-basic/javascript/highcharts",
  "hub": "https://anyplot.ai/candlestick-basic",
  "code_json": "https://api.anyplot.ai/specs/candlestick-basic/highcharts/code",
  "spec_json": "https://api.anyplot.ai/specs/candlestick-basic",
  "render_light_png": "https://storage.googleapis.com/anyplot-images/plots/candlestick-basic/javascript/highcharts/plot-light.png",
  "render_dark_png": "https://storage.googleapis.com/anyplot-images/plots/candlestick-basic/javascript/highcharts/plot-dark.png",
  "interactive_light_html": "https://storage.googleapis.com/anyplot-images/plots/candlestick-basic/javascript/highcharts/plot-light.html",
  "interactive_dark_html": "https://storage.googleapis.com/anyplot-images/plots/candlestick-basic/javascript/highcharts/plot-dark.html",
  "quality_score": 90.0,
  "license": "MIT",
  "guide": "https://anyplot.ai/llms.txt"
}
Part of Basic Candlestick Chart on anyplot.ai.