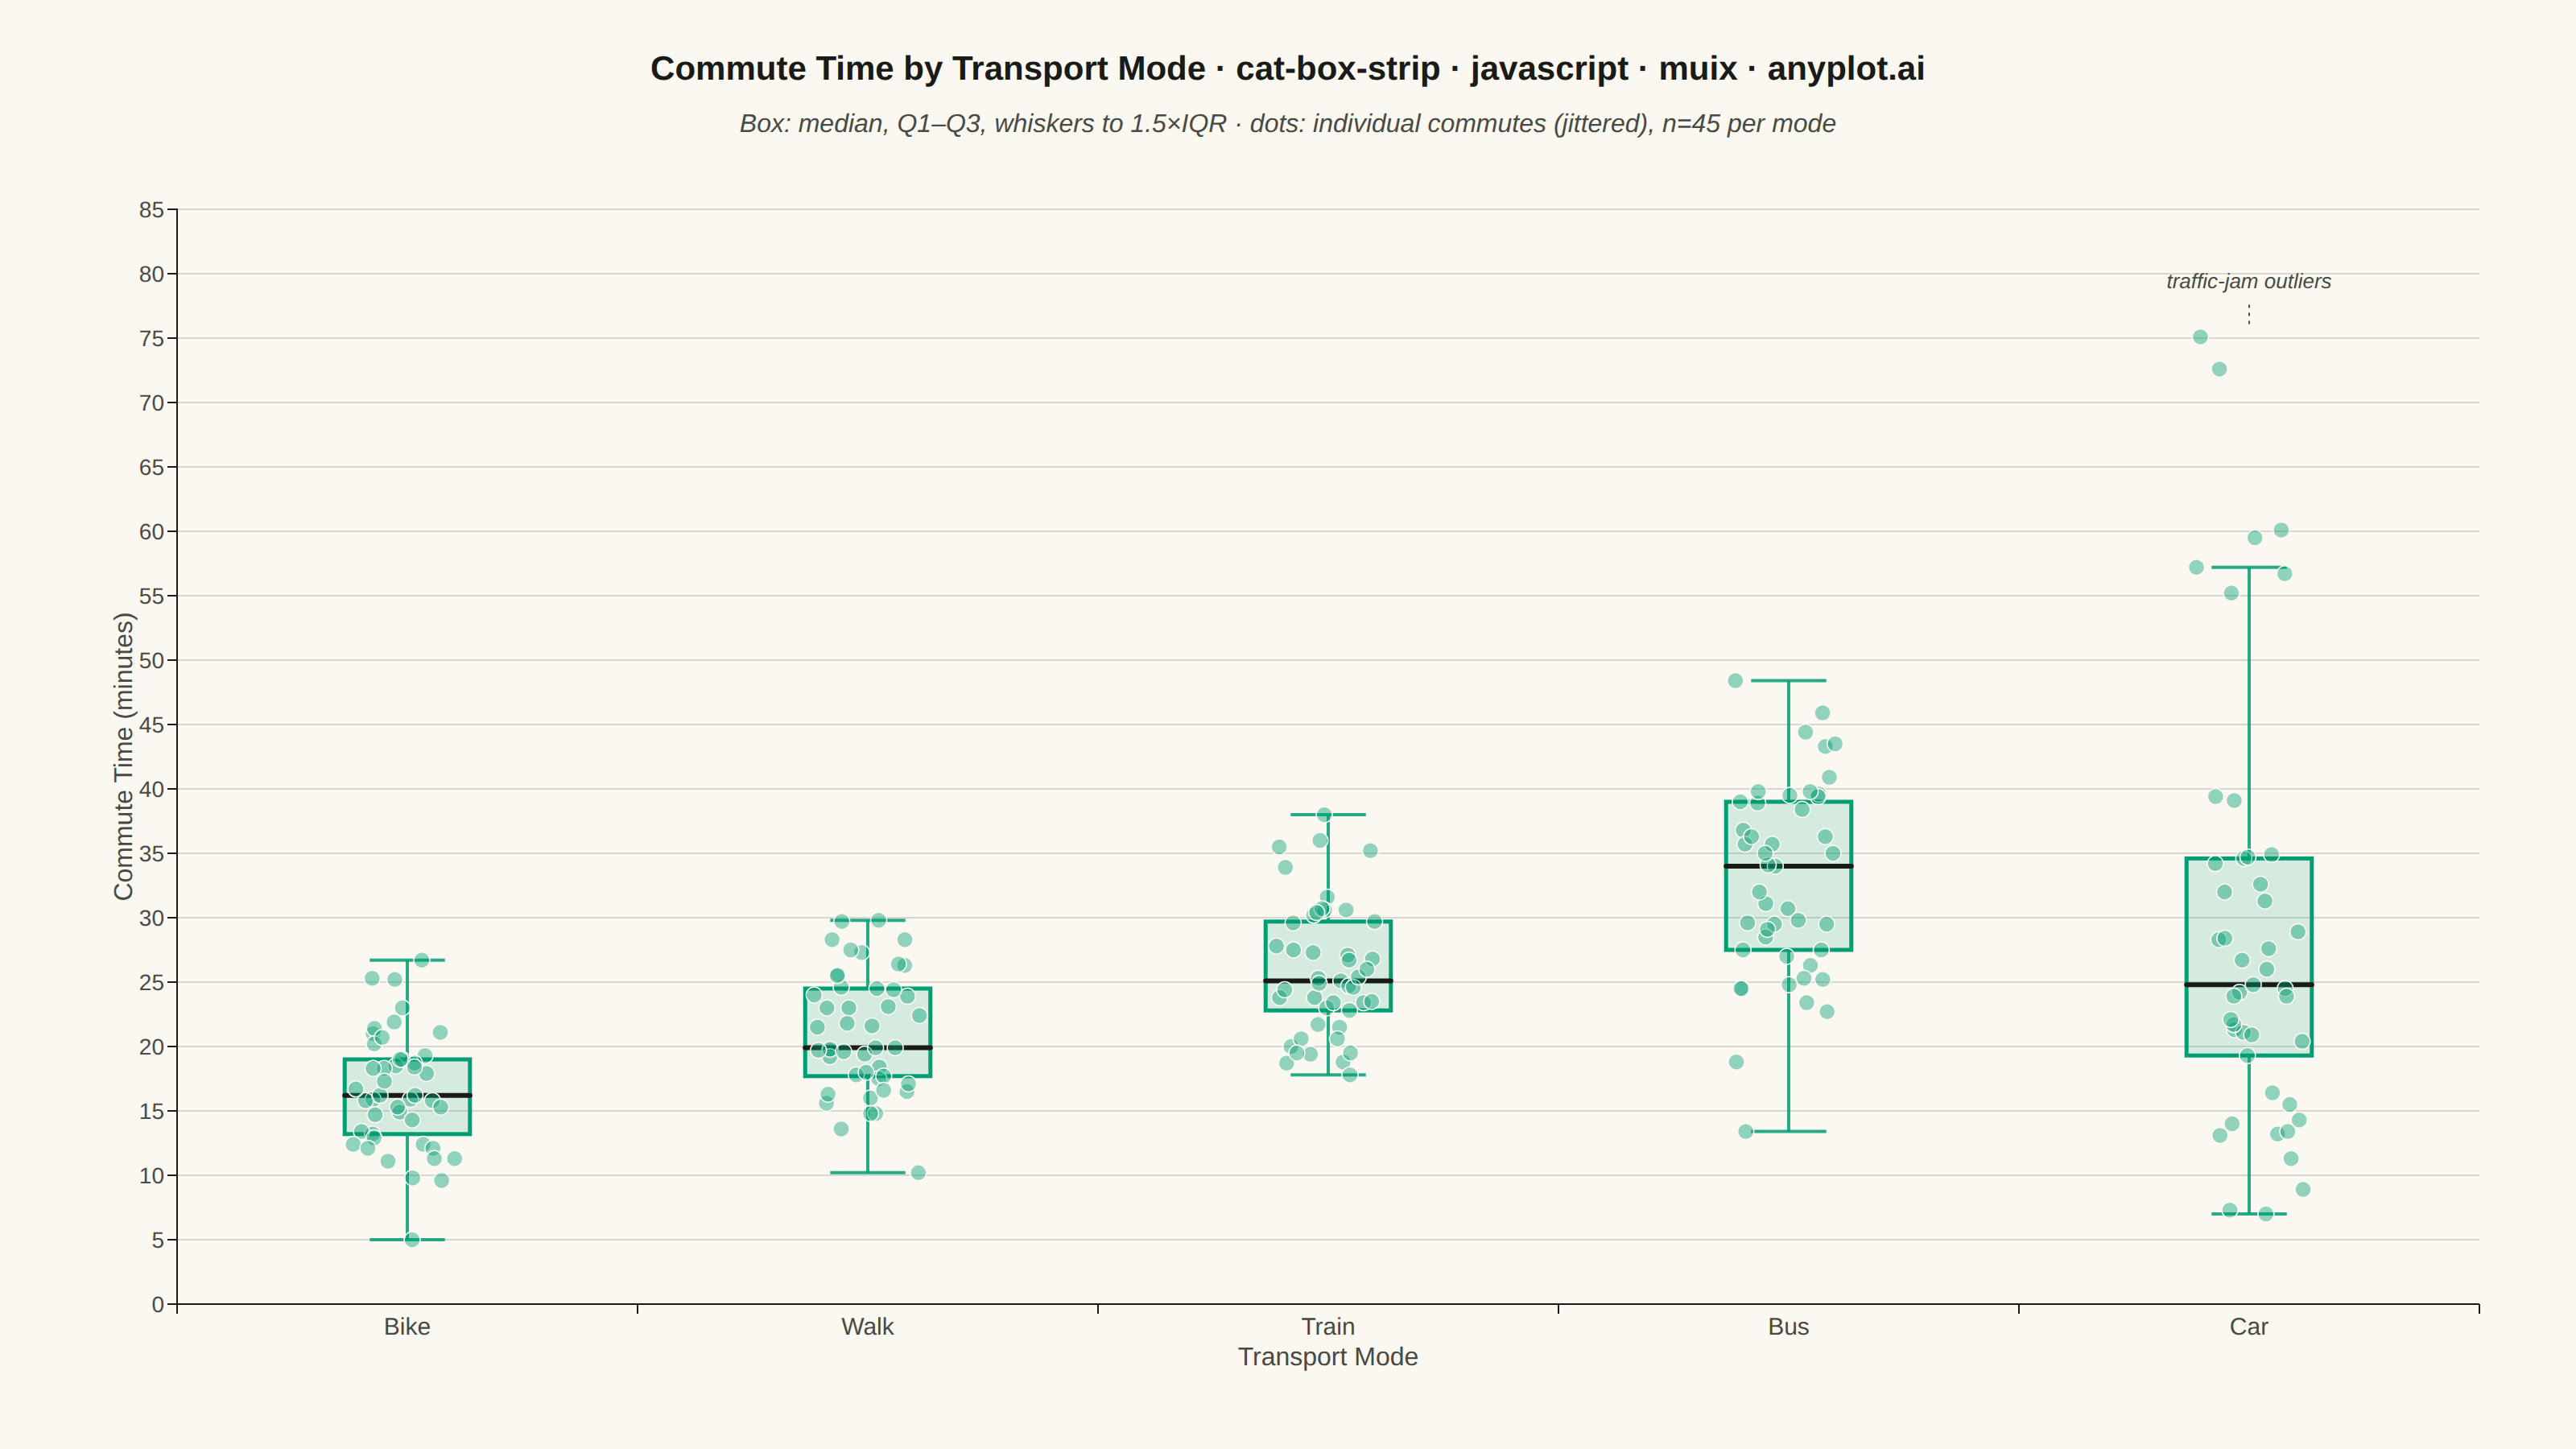
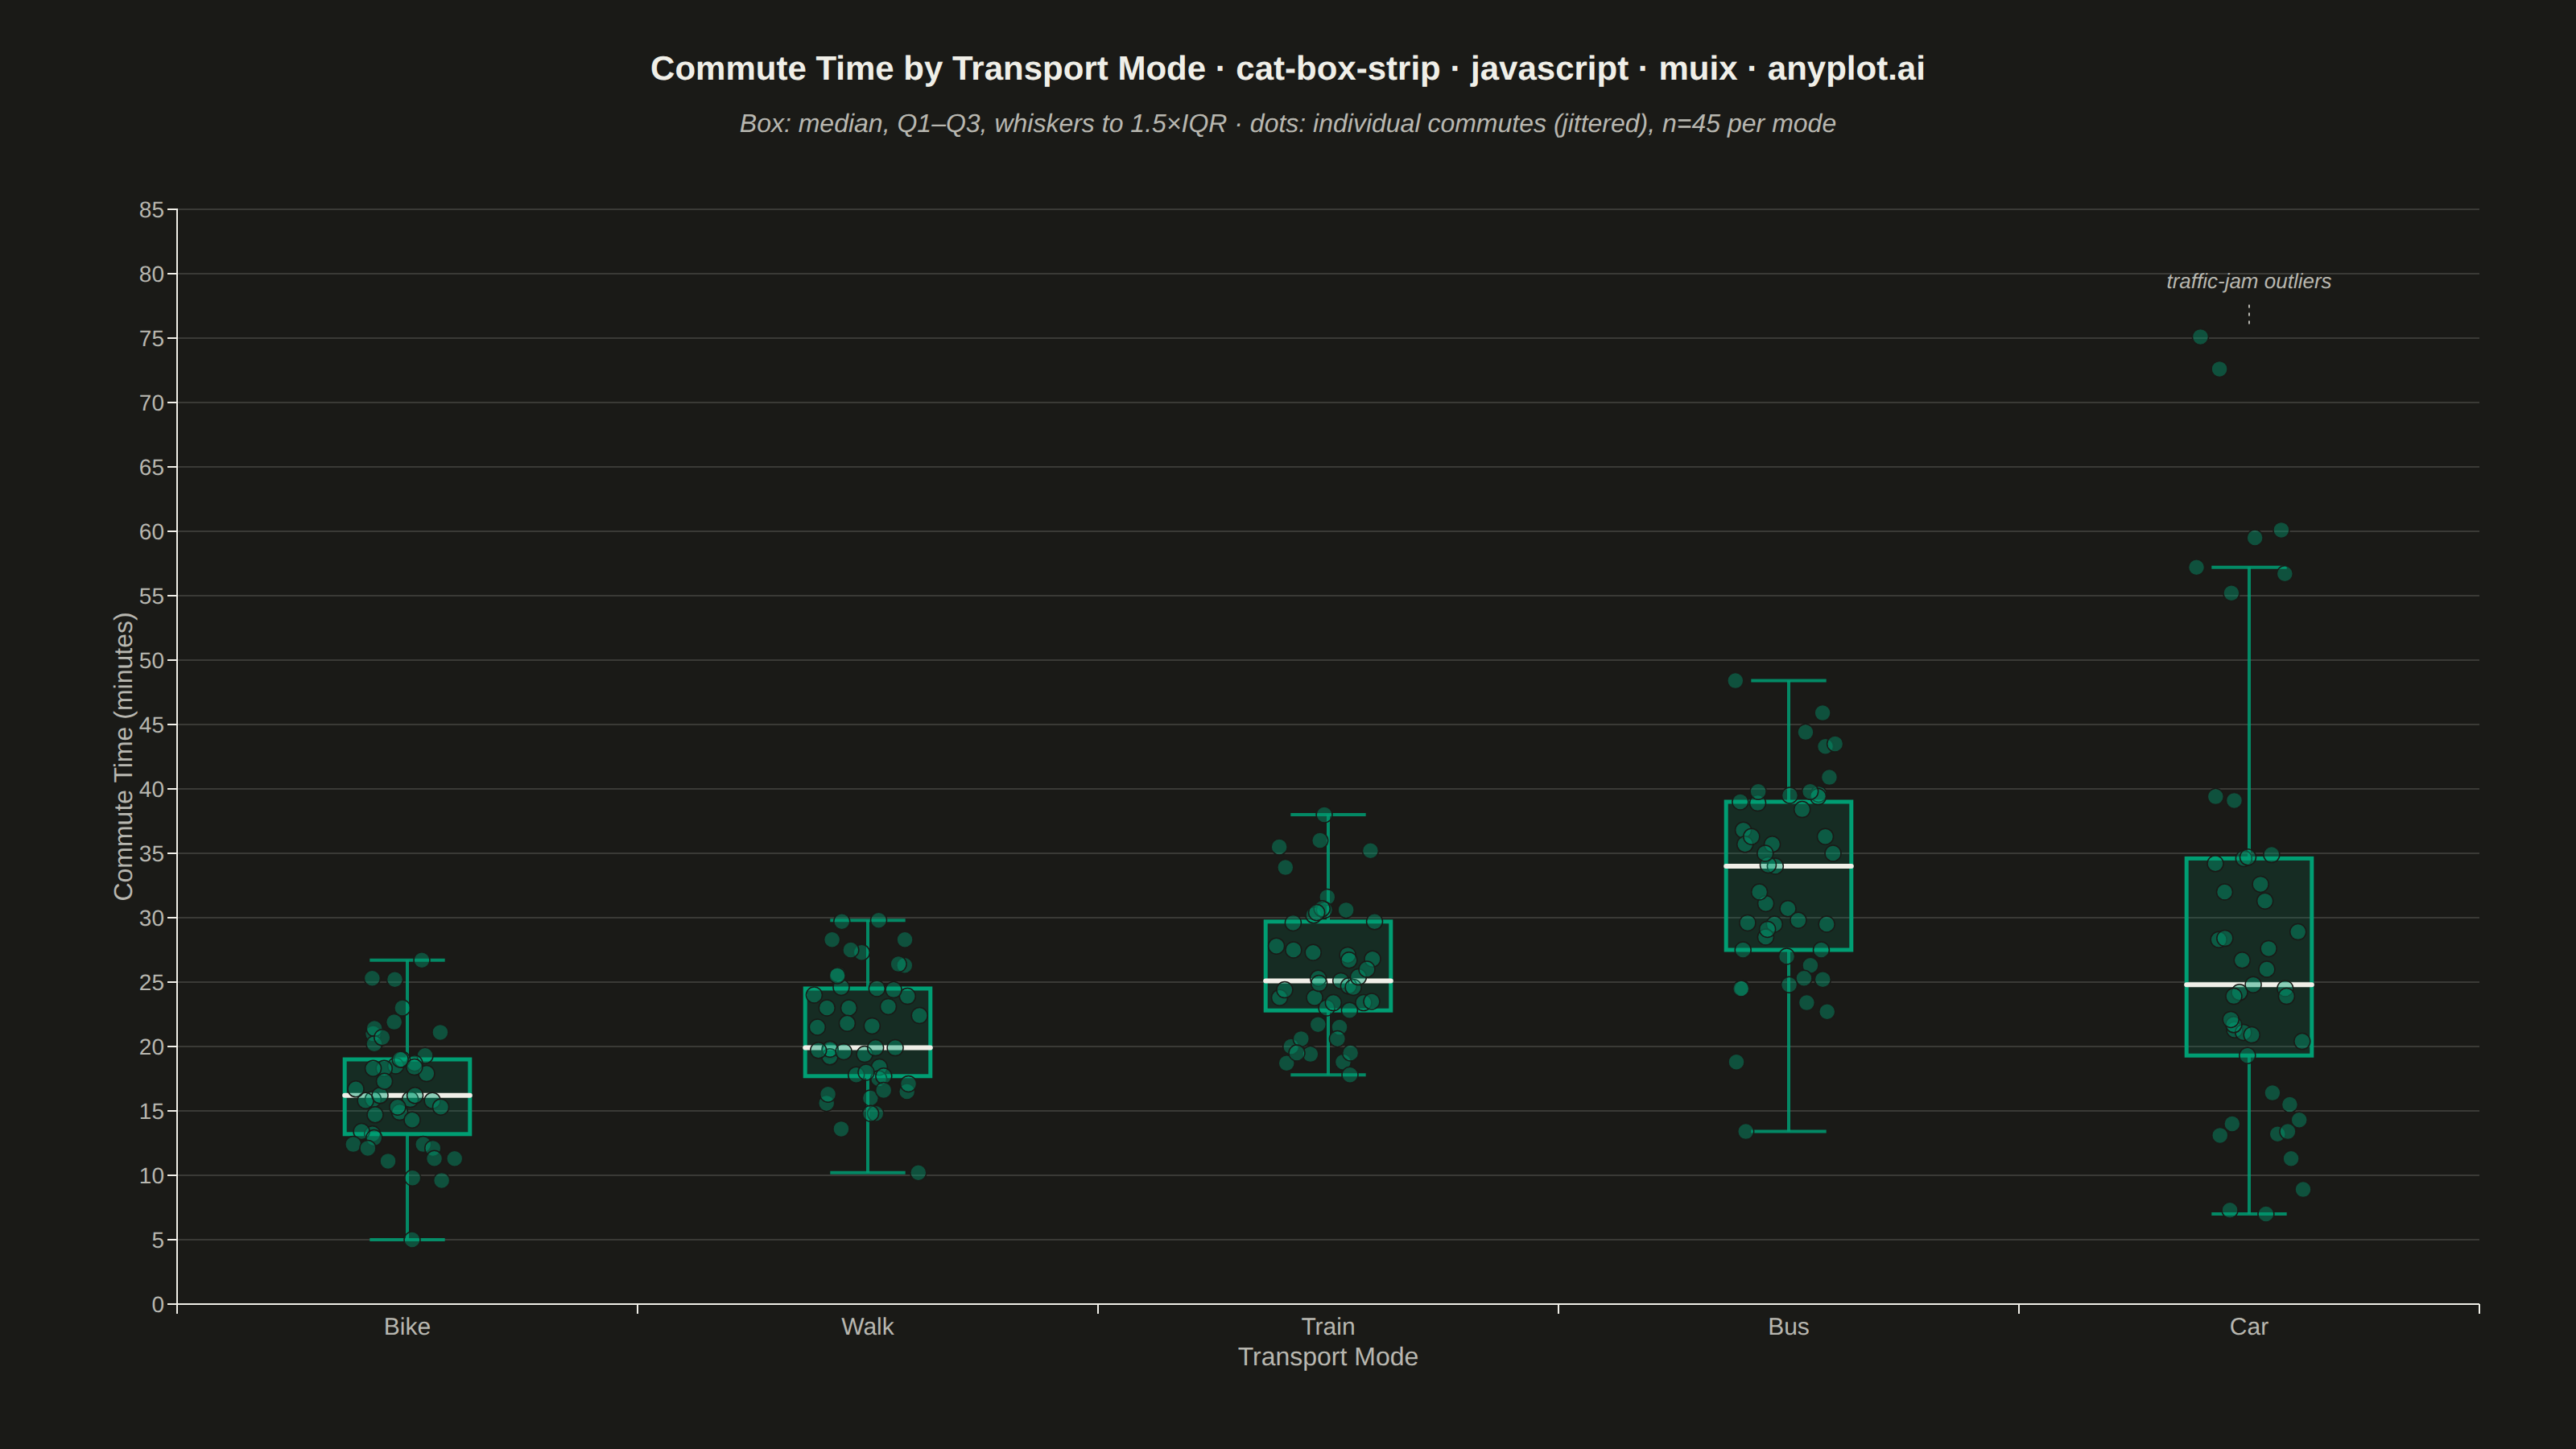
A combined visualization that overlays individual data points (strip plot) on top of a box plot. This provides both summary statistics (median, quartiles, whiskers) and visibility of the actual data distribution.
Preview render from the MUI X Charts implementation.