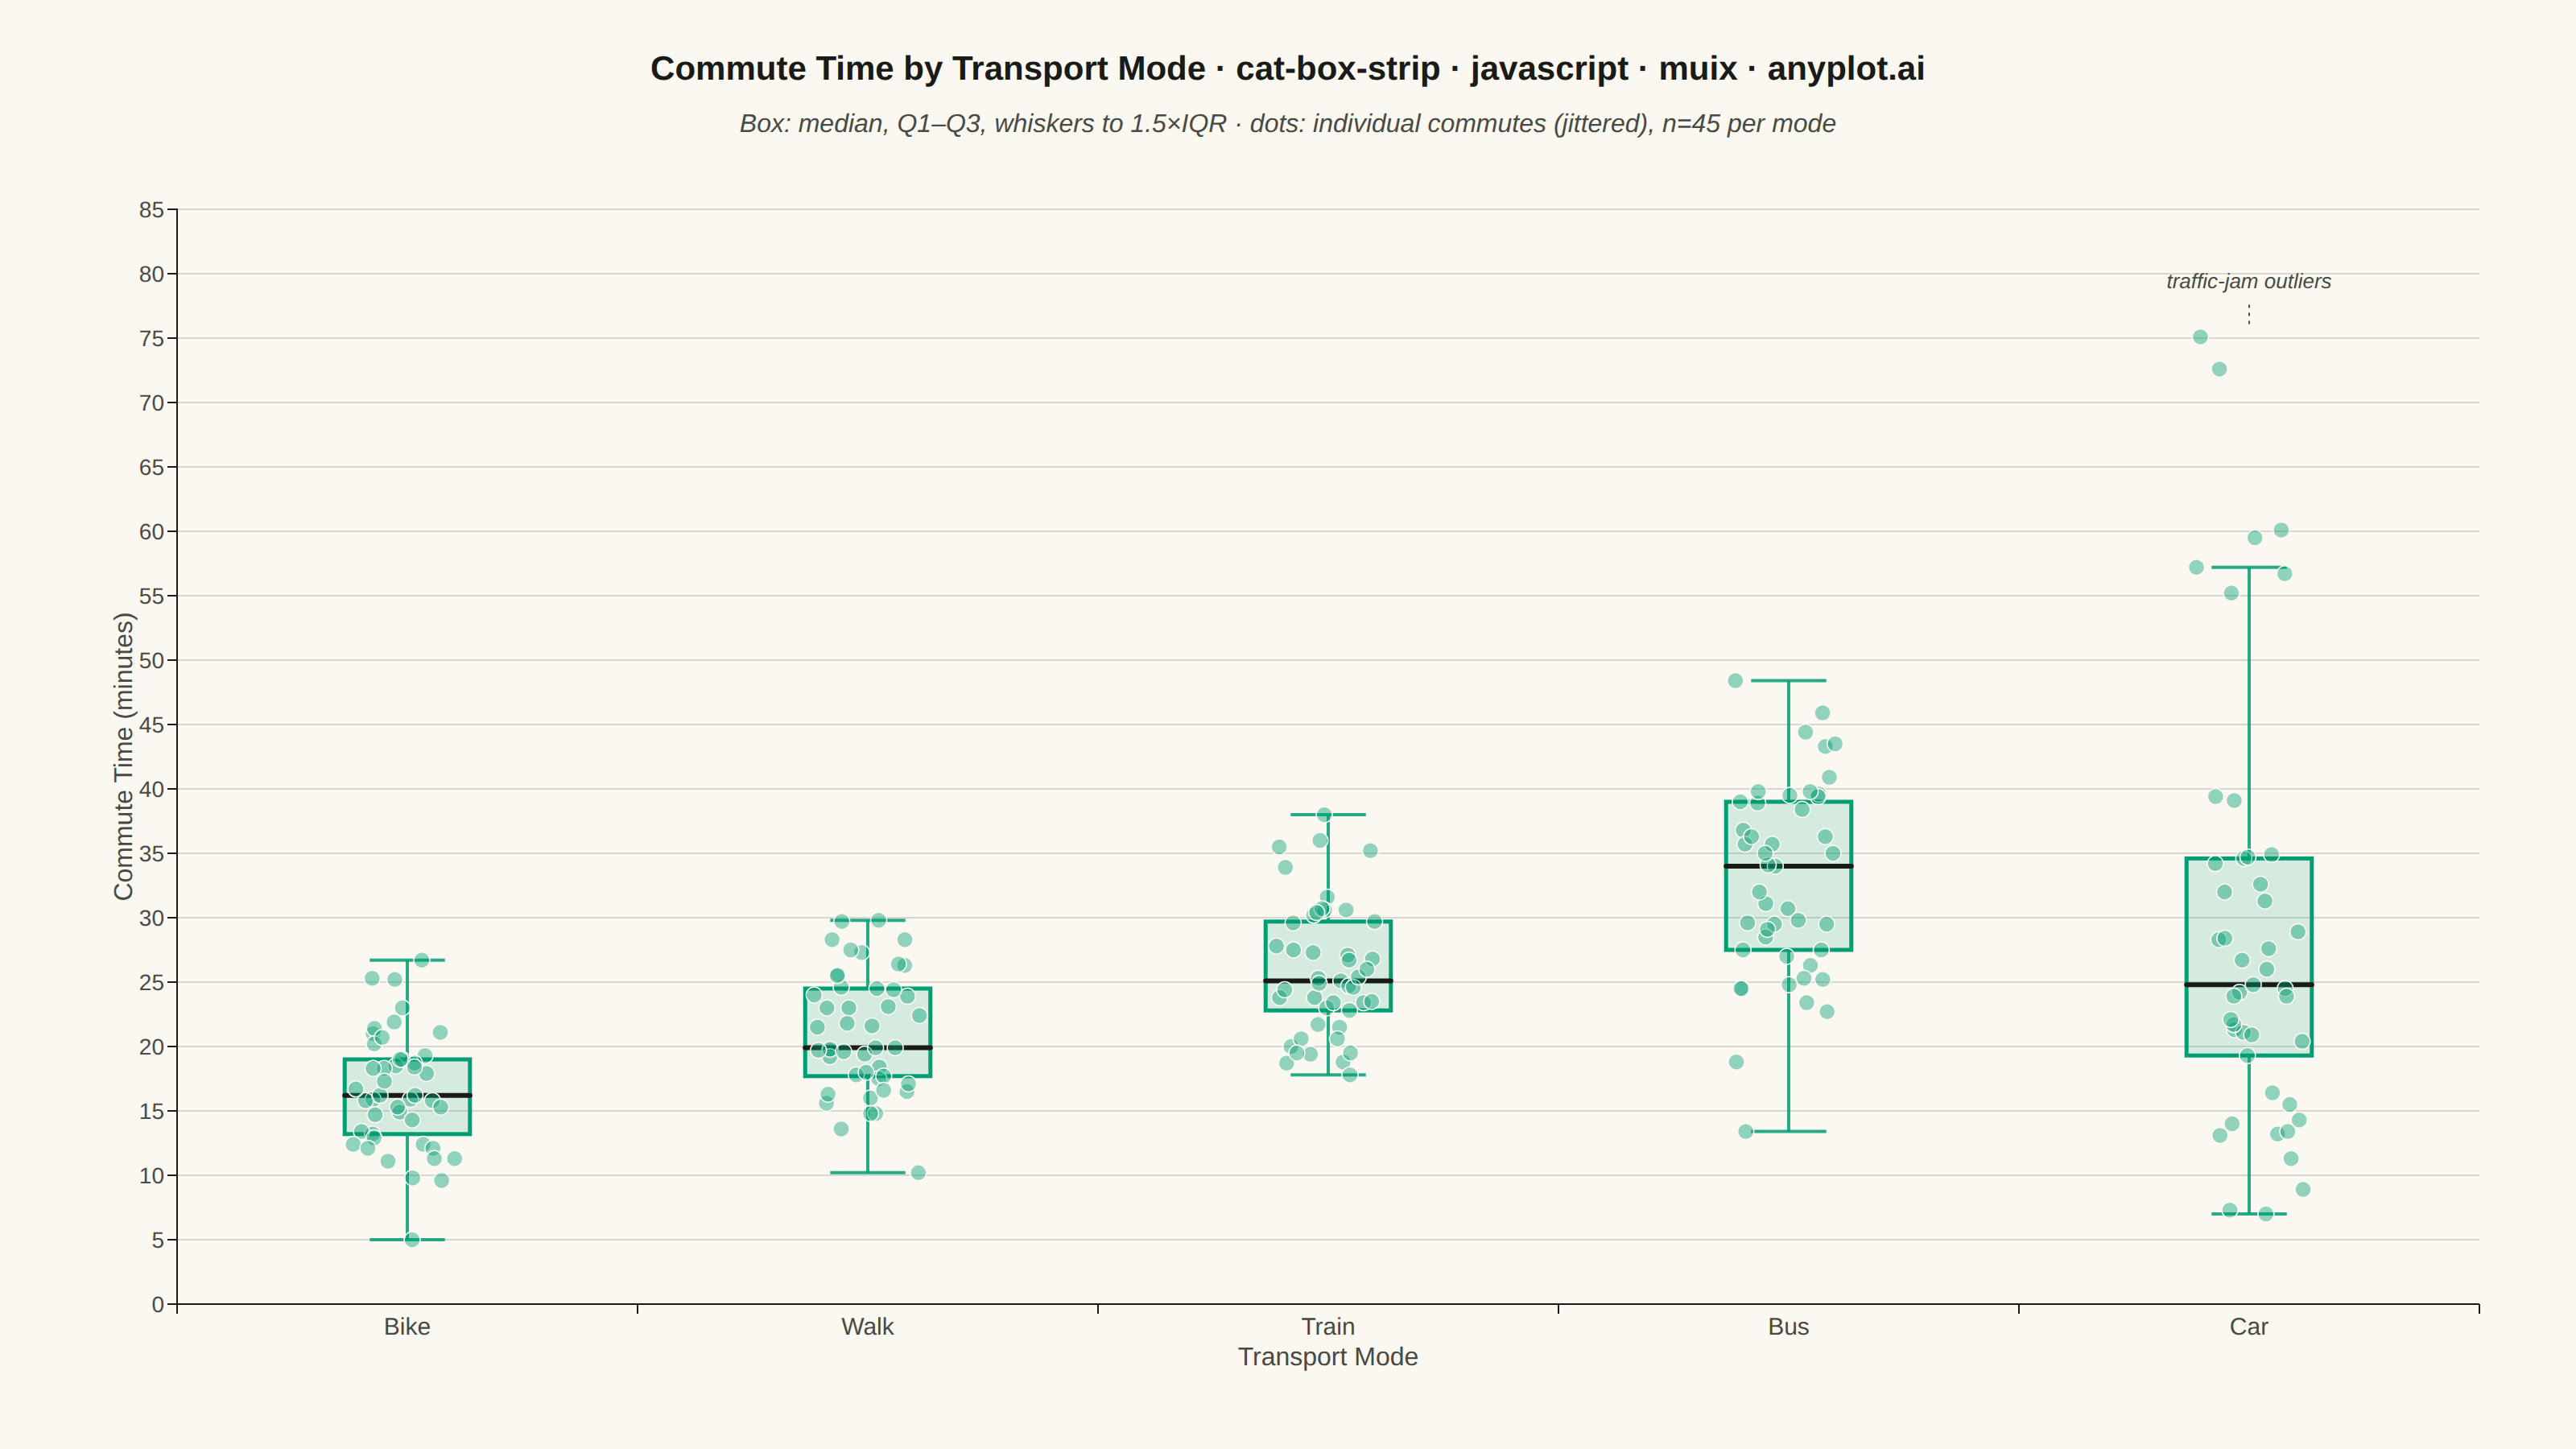
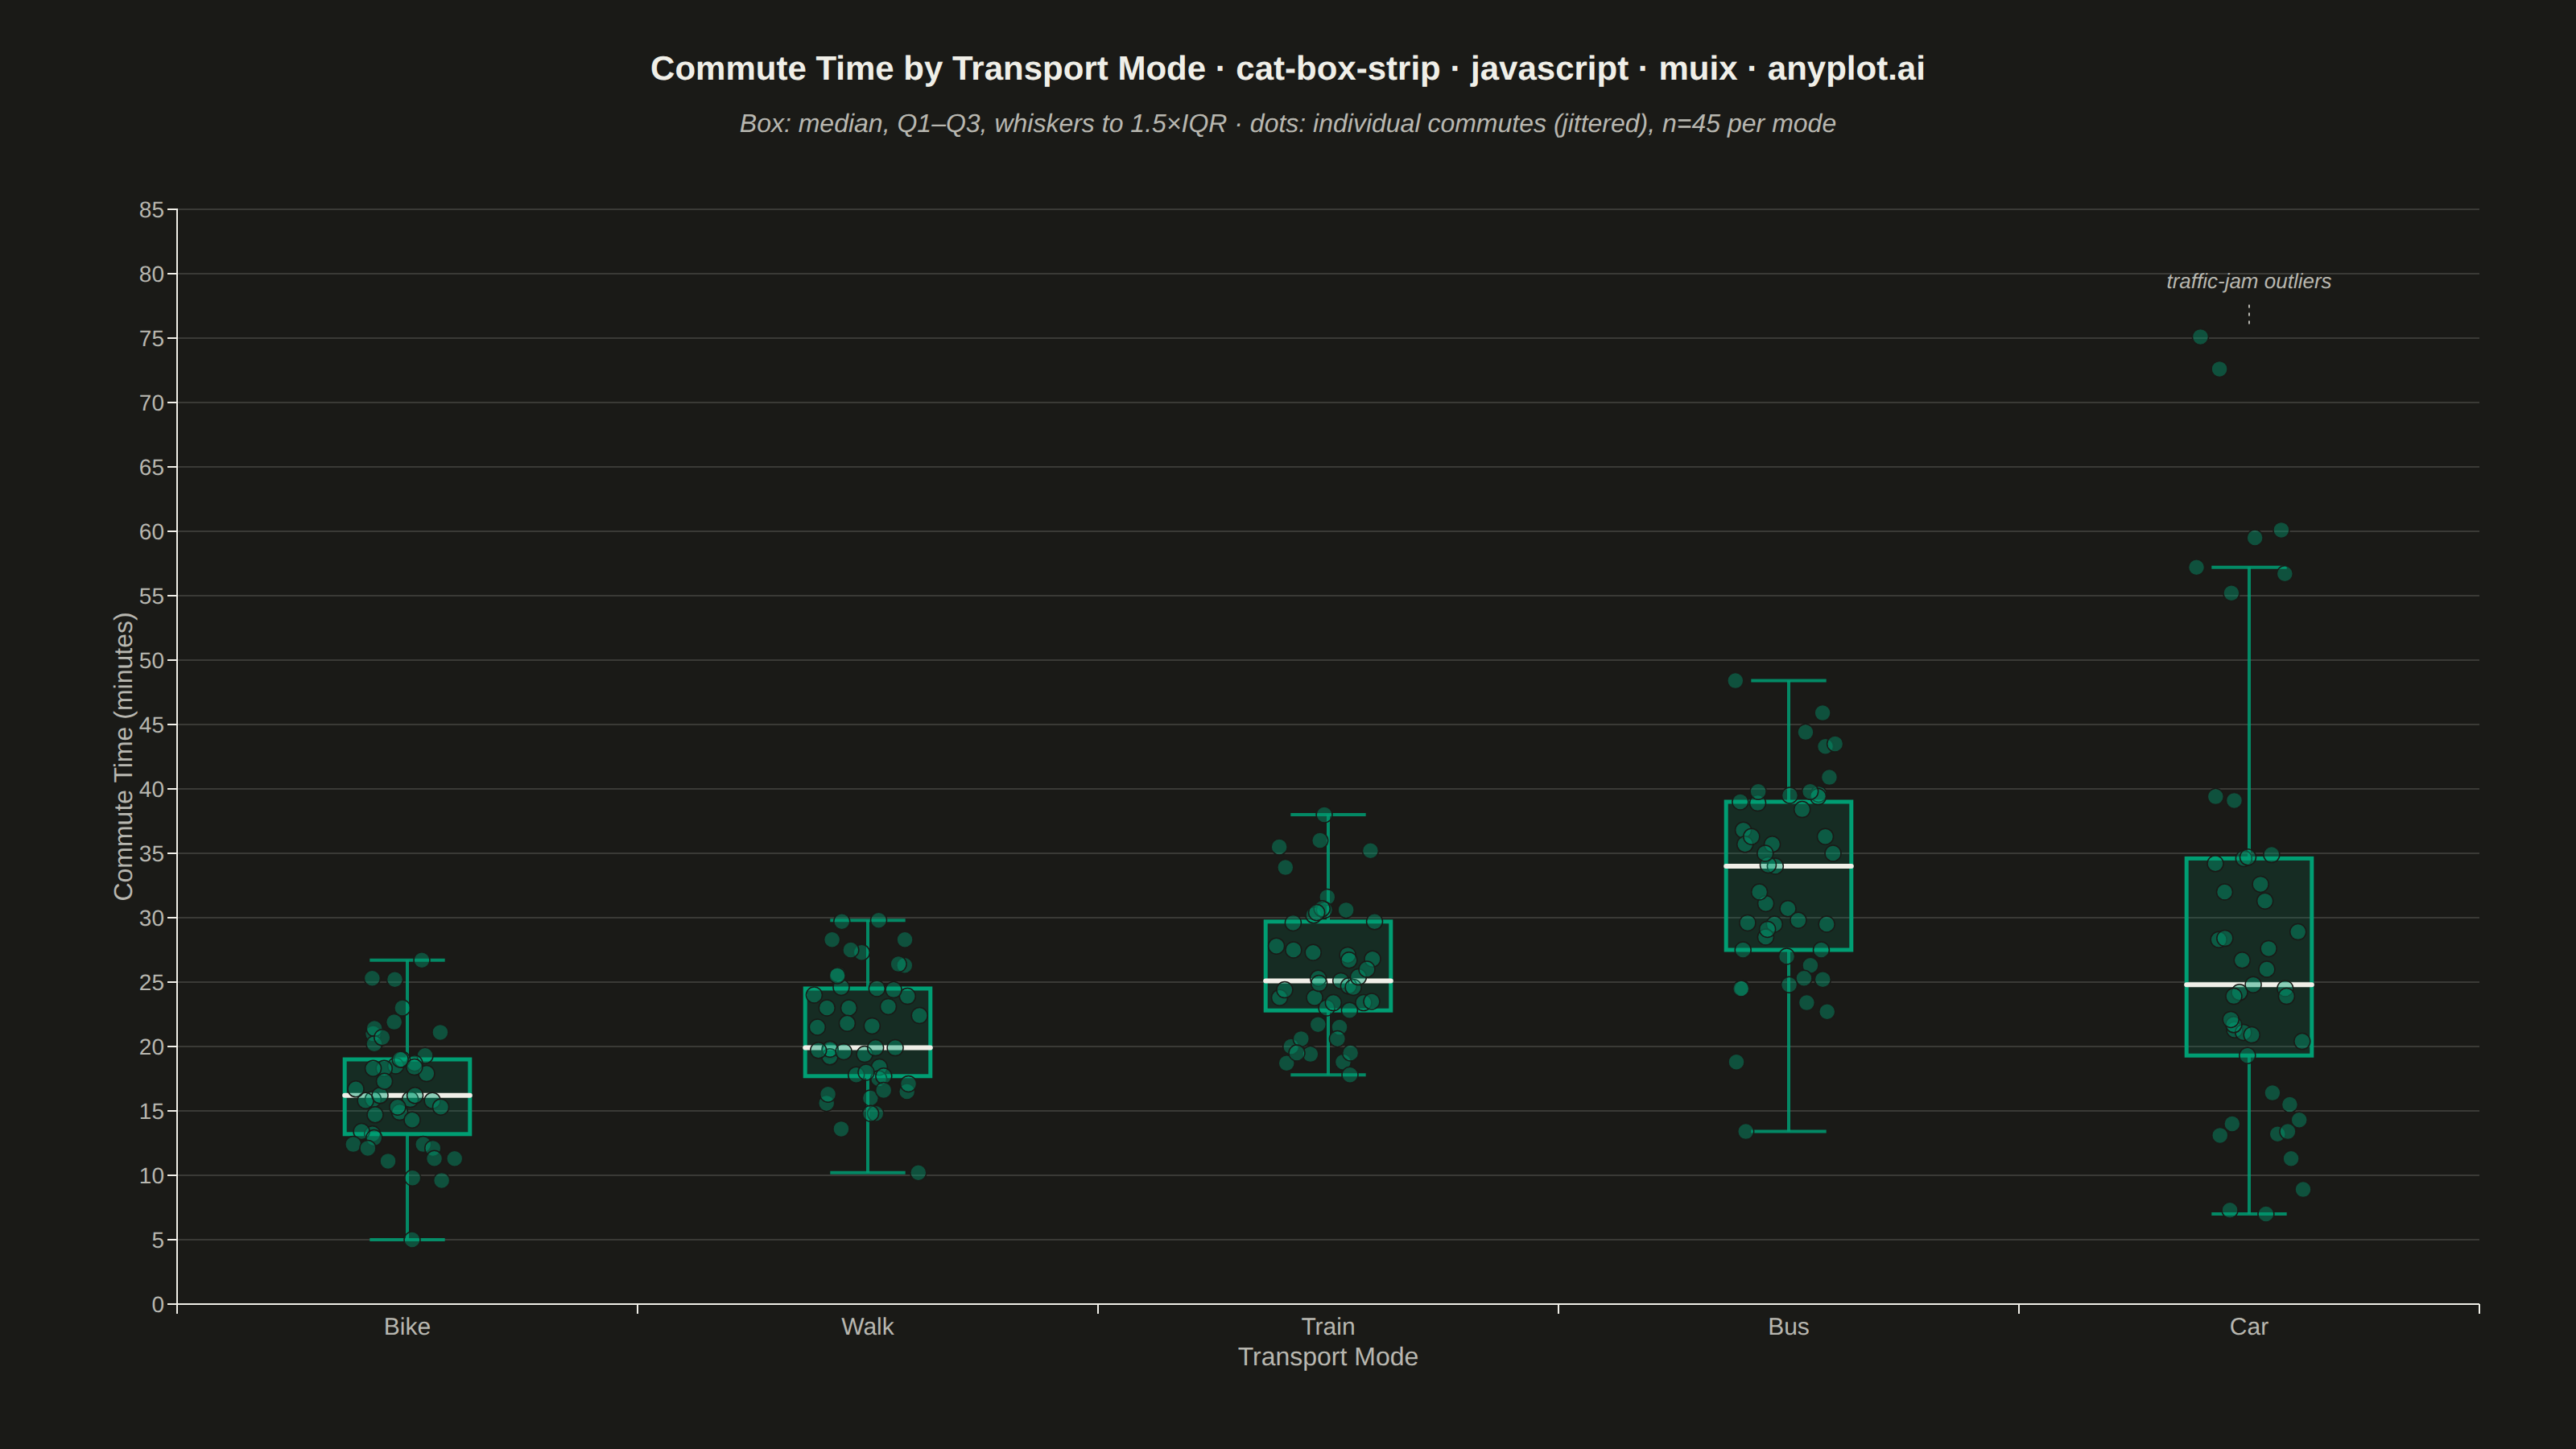
The same plot in 14 other libraries — JavaScript: Chart.js, D3.js, Apache ECharts, Highcharts; Python: Altair, Bokeh, lets-plot, Matplotlib, Plotly, plotnine, Pygal, Seaborn; R: ggplot2; Julia: Makie.jl. Compare all 15 side by side: Box Plot with Strip Overlay in Python, R, Julia and JavaScript.
A combined visualization that overlays individual data points (strip plot) on top of a box plot. This provides both summary statistics (median, quartiles, whiskers) and visibility of the actual data distribution.
// anyplot.ai
// cat-box-strip: Box Plot with Strip Overlay
// Library: muix 7.29.1 | JavaScript 22.23.2
// Quality: 93/100 | Created: 2026-09-02
//# anyplot-orientation: landscape
// anyplot.ai
// cat-box-strip: Box Plot with Strip Overlay
// Library: MUI X Charts | React | Node 22
// License: @mui/x-charts — MIT (community). Pro/Premium are out of scope.
// Quality: pending | Created: 2026-09-02
import { ChartContainer } from "@mui/x-charts/ChartContainer";
import { ChartsXAxis } from "@mui/x-charts/ChartsXAxis";
import { ChartsYAxis } from "@mui/x-charts/ChartsYAxis";
import { ChartsGrid } from "@mui/x-charts/ChartsGrid";
import { useXScale, useYScale } from "@mui/x-charts/hooks";

const t = window.ANYPLOT_TOKENS;

// --- Data (in-memory, deterministic) ----------------------------------------
// Commute time (minutes) by transport mode — synthetic but realistic: bike
// and walk are tight low-variance distributions, train is fairly consistent,
// bus has wider spread from stop-to-stop variability, and car carries a right
// skew from occasional traffic-jam outliers.
function mulberry32(seed) {
  return function rand() {
    seed |= 0;
    seed = (seed + 0x6d2b79f5) | 0;
    let x = Math.imul(seed ^ (seed >>> 15), 1 | seed);
    x = (x + Math.imul(x ^ (x >>> 7), 61 | x)) ^ x;
    return ((x ^ (x >>> 14)) >>> 0) / 4294967296;
  };
}
function gaussian(rand) {
  const u1 = Math.max(rand(), 1e-9);
  const u2 = rand();
  return Math.sqrt(-2 * Math.log(u1)) * Math.cos(2 * Math.PI * u2);
}
function quantile(sorted, q) {
  const pos = (sorted.length - 1) * q;
  const base = Math.floor(pos);
  const rest = pos - base;
  return sorted[base + 1] !== undefined
    ? sorted[base] + rest * (sorted[base + 1] - sorted[base])
    : sorted[base];
}

const N_PER_CATEGORY = 45;
const CATEGORY_PARAMS = [
  { category: "Bike", mean: 17, sd: 4, min: 5 },
  { category: "Walk", mean: 21, sd: 5, min: 6 },
  { category: "Train", mean: 26, sd: 5, min: 10 },
  { category: "Bus", mean: 31, sd: 8, min: 9 },
  { category: "Car", mean: 24, sd: 9, min: 7, jamProb: 0.12, jamExtra: 25 },
];
const CATEGORIES = CATEGORY_PARAMS.map((c) => c.category);

const dataRand = mulberry32(42);
const jitterRand = mulberry32(1337);

const STATS = CATEGORY_PARAMS.map(
  ({ category, mean, sd, min, jamProb, jamExtra }) => {
    const values = [];
    for (let i = 0; i < N_PER_CATEGORY; i += 1) {
      let v = mean + gaussian(dataRand) * sd;
      if (jamProb && dataRand() < jamProb) v += jamExtra + dataRand() * jamExtra;
      values.push(Math.max(min, Math.round(v * 10) / 10));
    }
    const jittered = values.map((value) => ({
      value,
      offset: jitterRand() - 0.5,
    }));
    const sorted = [...values].sort((a, b) => a - b);
    const q1 = quantile(sorted, 0.25);
    const median = quantile(sorted, 0.5);
    const q3 = quantile(sorted, 0.75);
    const iqr = q3 - q1;
    const lowFence = q1 - 1.5 * iqr;
    const highFence = q3 + 1.5 * iqr;
    const inFence = sorted.filter((v) => v >= lowFence && v <= highFence);
    const whiskerLow = inFence.length ? inFence[0] : sorted[0];
    const whiskerHigh = inFence.length ? inFence[inFence.length - 1] : sorted[sorted.length - 1];
    return {
      category,
      jittered,
      q1,
      median,
      q3,
      whiskerLow,
      whiskerHigh,
      outliers: sorted.filter((v) => v < whiskerLow || v > whiskerHigh),
    };
  },
);

const ALL_VALUES = STATS.flatMap((s) => s.jittered.map((p) => p.value));
const RAW_MIN = Math.min(...ALL_VALUES);
const RAW_MAX = Math.max(...ALL_VALUES);
const PAD = (RAW_MAX - RAW_MIN) * 0.1;
const Y_MIN = Math.max(0, Math.floor((RAW_MIN - PAD) / 5) * 5);
const Y_MAX = Math.ceil((RAW_MAX + PAD) / 5) * 5;

// --- Custom layer: whiskers, box, median, jittered strip points -------------
// MUI X community has no boxplot series type, so the box + whisker + strip
// geometry is drawn directly from the chart's own band/linear scales via
// useXScale/useYScale — the same composition pattern the harness expects for
// chart types outside the built-in series set.
function BoxStripLayer() {
  const xScale = useXScale("x");
  const yScale = useYScale("y");
  if (!xScale || !yScale) return null;

  const bandwidth = (xScale as any).bandwidth();
  const boxWidth = bandwidth * 0.34;
  const capHalf = boxWidth * 0.3;
  const jitterSpread = bandwidth * 0.3;

  return (
    <g>
      {STATS.map((s) => {
        const cx = (xScale as any)(s.category) + bandwidth / 2;
        const yLow = (yScale as any)(s.whiskerLow);
        const yQ1 = (yScale as any)(s.q1);
        const yQ3 = (yScale as any)(s.q3);
        const yHigh = (yScale as any)(s.whiskerHigh);
        const yMed = (yScale as any)(s.median);
        return (
          <g key={s.category}>
            <line x1={cx} y1={yLow} x2={cx} y2={yQ1} stroke={t.palette[0]} strokeWidth={2} strokeOpacity={0.85} />
            <line x1={cx} y1={yQ3} x2={cx} y2={yHigh} stroke={t.palette[0]} strokeWidth={2} strokeOpacity={0.85} />
            <line x1={cx - capHalf} y1={yLow} x2={cx + capHalf} y2={yLow} stroke={t.palette[0]} strokeWidth={2} strokeOpacity={0.85} />
            <line x1={cx - capHalf} y1={yHigh} x2={cx + capHalf} y2={yHigh} stroke={t.palette[0]} strokeWidth={2} strokeOpacity={0.85} />
            <rect
              x={cx - boxWidth / 2}
              y={yQ3}
              width={boxWidth}
              height={Math.max(1, yQ1 - yQ3)}
              fill={t.palette[0]}
              fillOpacity={0.14}
              stroke={t.palette[0]}
              strokeWidth={2.5}
            />
            <line x1={cx - boxWidth / 2} y1={yMed} x2={cx + boxWidth / 2} y2={yMed} stroke={t.ink} strokeWidth={3} strokeLinecap="round" />
          </g>
        );
      })}
      {STATS.map((s) => {
        const cx = (xScale as any)(s.category) + bandwidth / 2;
        return s.jittered.map((p, i) => (
          <circle
            key={`${s.category}-${i}`}
            cx={cx + p.offset * jitterSpread}
            cy={(yScale as any)(p.value)}
            r={5}
            fill={t.palette[0]}
            fillOpacity={0.42}
            stroke={t.pageBg}
            strokeWidth={0.75}
          />
        ));
      })}
      {(() => {
        // Callout on the category whose outliers reach furthest above its
        // whisker cap — sharpens the story instead of a fixed, hardcoded label.
        const withOutliers = STATS.filter((s) => s.outliers.length > 0);
        if (!withOutliers.length) return null;
        const target = withOutliers.reduce((a, b) =>
          Math.max(...b.outliers) > Math.max(...a.outliers) ? b : a,
        );
        const topOutlier = Math.max(...target.outliers);
        const cx = (xScale as any)(target.category) + bandwidth / 2;
        const cyOutlier = (yScale as any)(topOutlier);
        const labelY = cyOutlier - 30;
        return (
          <g>
            <line
              x1={cx}
              y1={cyOutlier - 8}
              x2={cx}
              y2={labelY + 8}
              stroke={t.inkSoft}
              strokeWidth={1}
              strokeDasharray="2,3"
            />
            <text
              x={cx}
              y={labelY}
              textAnchor="middle"
              fontSize={13}
              fontStyle="italic"
              fill={t.inkSoft}
            >
              traffic-jam outliers
            </text>
          </g>
        );
      })()}
    </g>
  );
}

// --- Chart (default-exported component — the harness mounts it) -------------
export default function Chart() {
  const W = window.ANYPLOT_SIZE.width;
  const H = window.ANYPLOT_SIZE.height;

  const title =
    "Commute Time by Transport Mode · cat-box-strip · javascript · muix · anyplot.ai";
  const titleSize = title.length > 70 ? Math.round(24 * (70 / title.length)) : 24;
  const subtitle =
    "Box: median, Q1–Q3, whiskers to 1.5×IQR · dots: individual commutes (jittered), n=45 per mode";

  return (
    <ChartContainer
      width={W}
      height={H}
      series={[]}
      skipAnimation
      xAxis={[
        {
          id: "x",
          scaleType: "band",
          data: CATEGORIES,
          label: "Transport Mode",
          labelStyle: { fontSize: 16, fill: t.inkSoft },
          tickLabelStyle: { fontSize: 15, fill: t.inkSoft },
        },
      ]}
      yAxis={[
        {
          id: "y",
          scaleType: "linear",
          min: Y_MIN,
          max: Y_MAX,
          label: "Commute Time (minutes)",
          labelStyle: { fontSize: 16, fill: t.inkSoft },
          tickLabelStyle: { fontSize: 14, fill: t.inkSoft },
        },
      ]}
      margin={{ top: 130, bottom: 90, left: 110, right: 60 }}
    >
      <ChartsGrid horizontal />
      <BoxStripLayer />
      <ChartsXAxis axisId="x" />
      <ChartsYAxis axisId="y" />
      <text
        x={W / 2}
        y={44}
        textAnchor="middle"
        dominantBaseline="middle"
        fontSize={titleSize}
        fontWeight={600}
        fill={t.ink}
        fontFamily="-apple-system, BlinkMacSystemFont, 'Segoe UI', Roboto, Helvetica, Arial, sans-serif"
      >
        {title}
      </text>
      <text
        x={W / 2}
        y={78}
        textAnchor="middle"
        dominantBaseline="middle"
        fontSize={16}
        fontStyle="italic"
        fill={t.inkSoft}
        fontFamily="-apple-system, BlinkMacSystemFont, 'Segoe UI', Roboto, Helvetica, Arial, sans-serif"
      >
        {subtitle}
      </text>
    </ChartContainer>
  );
}
Runnable source as JSON, for any HTTP client: https://api.anyplot.ai/specs/cat-box-strip/muix/code. Any spec id and library id listed in llms-full.txt fit the same URL shape; every URL below is complete and callable.
{
  "spec_id": "cat-box-strip",
  "language": "javascript",
  "library": "muix",
  "page": "https://anyplot.ai/cat-box-strip/javascript/muix",
  "hub": "https://anyplot.ai/cat-box-strip",
  "code_json": "https://api.anyplot.ai/specs/cat-box-strip/muix/code",
  "spec_json": "https://api.anyplot.ai/specs/cat-box-strip",
  "render_light_png": "https://storage.googleapis.com/anyplot-images/plots/cat-box-strip/javascript/muix/plot-light.png",
  "render_dark_png": "https://storage.googleapis.com/anyplot-images/plots/cat-box-strip/javascript/muix/plot-dark.png",
  "interactive_light_html": "https://storage.googleapis.com/anyplot-images/plots/cat-box-strip/javascript/muix/plot-light.html",
  "interactive_dark_html": "https://storage.googleapis.com/anyplot-images/plots/cat-box-strip/javascript/muix/plot-dark.html",
  "quality_score": 93.0,
  "license": "MIT",
  "guide": "https://anyplot.ai/llms.txt"
}
Part of Box Plot with Strip Overlay on anyplot.ai.